

INTRODUCTION
Controlling occlusal forces is one of the main goals of occlusal adjustments and restorative dentistry.1 Despite a clinician’s best efforts to control occlusal forces, failures relating to occlusal force imbalances persist, such as fractured teeth, chipped porcelain, broken frameworks, connectors, screws, abutments, and fixtures. Often, these failures are blamed upon the physical properties of the materials or prosthesis design, rather than on the possibility that sub-optimal insertion occlusal adjustment endpoints were achieved by the operator.
Optimally distributing force can decrease the amount of stress on teeth, dental implants, and restorative materials. Various inks and films are used to visualize the occlusal contacts and adjustment therapy decisions are made based on the operator’s Subjective Interpretation of the force at each of the contacts.2,3 However, there is no scientific evidence within the literature that states films, ribbons or any articulating papers can measure occlusal forces.4 One comprehensive analysis of 600 paper markings made from loads up to 450N showed that any mark size can represent any load, that equal sized marks represented many different loads, and that large paper marks were forceful only 14 % of the time.5
Two recent studies illustrated the profound inability of dentists to reliably distinguish forceful from non-forceful occlusal contacts using Subjective Interpretation.6,7 In an earlier publication, 295 dentists performing Subjective Interpretation of photographs of quadrants of articulating paper marks, correctly chose the most forceful contacts only 12.8 % of the time, almost the same percentage as for chance (12.5 %).6 In the 2nd study, 152 dentists correctly chose the most forceful contacts by visually observing paper marks only 13.13 % of the time.7 The findings of both studies strongly indicate that dentists cannot “Subjectively Interpret” paper markings and accurately determine which are the high force occlusal contacts.
A computerized occlusal analysis system (T- Scan II, Tekscan Inc. S. Boston, MA, USA) provides the operator with a measurement-based method of obtaining objective occlusal contact relative force and real-time data, which has been shown to allow for more refined occlusal force equalization.8
The T-Scan II recording sensor is a resistive, electronic tactile sensor that uses pressure sensitive conductive ink distributed in a series of columns and rows, encased in Mylar in the shape of a dental arch, that draws power from a personal computer.9 When the points on the grid (or sensels) are loaded by occlusal contact, they relay a voltage drop to the companion software. The T-Scan displays 256 levels of relative occlusal contact force and contact time-sequences in a graphical format. The T-Scan II recording sensor is scanned by the T-Scan II software at rate of 100 frames/second, and plays back the occlusal contact force and timing data in a dynamic video comprised of 0.01second-spaced frames.9
Fourth generation high definition (HD) sensors with the software and hardware of the T-Scan II have been shown to reproduce occlusal force for up to 24 recordings9 and still report the same force distribution around the dental arch with multiple sensor crushes 95 % of the time.10 The entire system affords the operator qualitative and quantitative occlusal data, from which occlusal adjustment therapy decisions can be measurably discerned. This data, when applied as a clinical guide during the adjustments of occlusal contacts, has been shown in clinical reports and research studies to improve occlusal adjustment endpoints beyond that which is achievable with the naked eye, tactile sense, and paper, film, or ribbon, using Subjective Interpretation.11–15
The purpose of this in-vitro study was to compare the occlusal adjustment results obtained with conventional articulating paper and film, with those obtained when further occlusal refinement was guided by computerized occlusal analysis. Two additional goals were; 1) to determine if the computer analysis resulted in a significantly more refined occlusion than the information given solely by ribbons and film, and 2) to determine how many computer-guided correction sequences were required to achieve arch half occlusal force equalization when using the computerized occlusal analysis method.
METHODS & MATERIALS
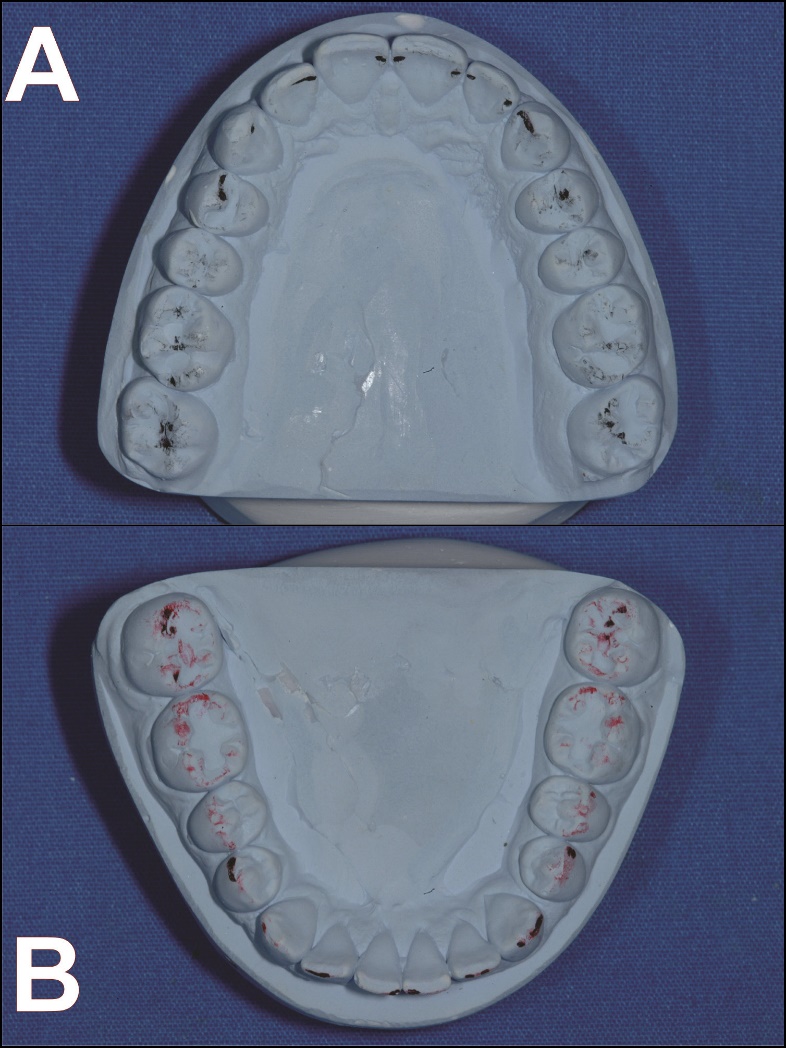
A set of well interdigitated upper and lower arch preliminary casts were obtained from regular impressions made on an adult patient with a stable, asymptomatic occlusion and with equal numbers of teeth, bilaterally (Figure 1). A baseline occlusal force arch half percentage was established by mounting the preliminary casts into a Wide-Vue Articulator (Waterpik, Fort Collins, CO, USA) midway between the upper and lower members, centered antero-posteriorly and medio-laterally.

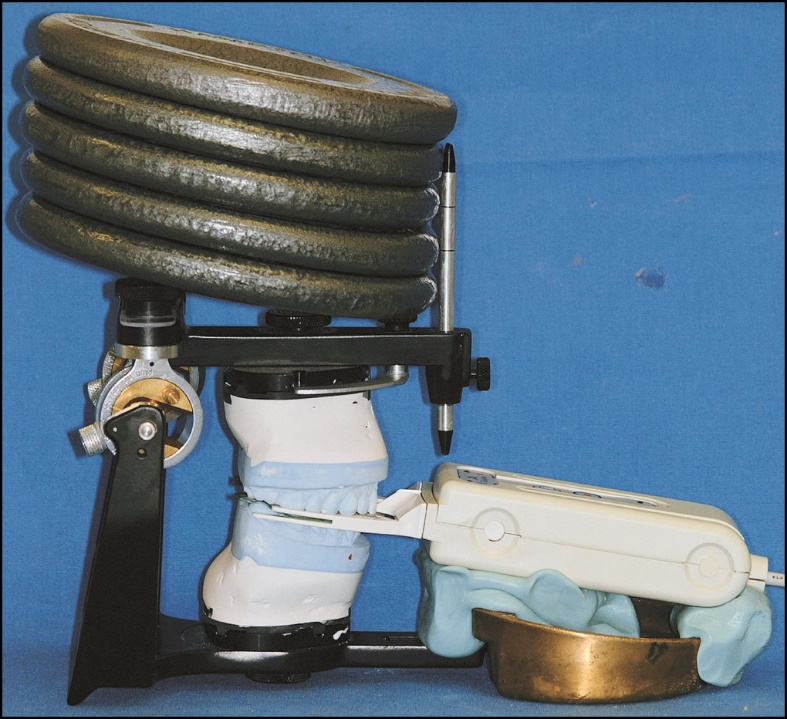
Computerized occlusal analysis measurements were made with the T-Scan II USB recording handle and a High Definition sensor. The handle was attached to the articulator using Exaflex Vinyl Polysiloxane Putty (G.C. America Inc., Alsip, IL, USA). This silicone formed a cradle that could be detached from the articulator to allow access for adjustment, and then replaced in the same position relative to the articulator (Figure 2). The sensor was placed to rest evenly and lightly on the cusp tips of the mandibular cast parallel with the occlusal plane, avoiding distortion of the sensor to ensure an accurate representation of the occlusal forces.

The unused HD sensor was conditioned to the tooth contours, according to the manufacturer’s instructions,16 by loading it between the set of casts four times in a series of test closures before the baseline recording was made. The upper member of the articulator was then closed so that with the HD sensor interposed, the upper and lower casts were placed into maximum intercuspation. A weight of about 25 1bs. (or approximately 111 Newtons) was placed on the upper member of the closed articulator (Figure 2) to provide a constant load throughout the recording duration. With the application of this constant load, a recording sensitivity of Mid -2 was chosen for all recorded force movies,9,10 as this sensitivity level yielded only 3 sensels of red pressure (indicating highest relative pressure). This was the best recording setting according to the Manufacturer’s guidelines.16
All of the recordings commenced with the articulator fully closed, so the resultant data measured the relative percentage load of all teeth when fully intercuspated. No initial corrective adjustments were accomplished prior to the determination of cast baseline arch-half contact force percentages. The baseline setting process was repeated 3 more times to allow for crimping deformation of the sensor in and around each tooth’s anatomy.9,10,16
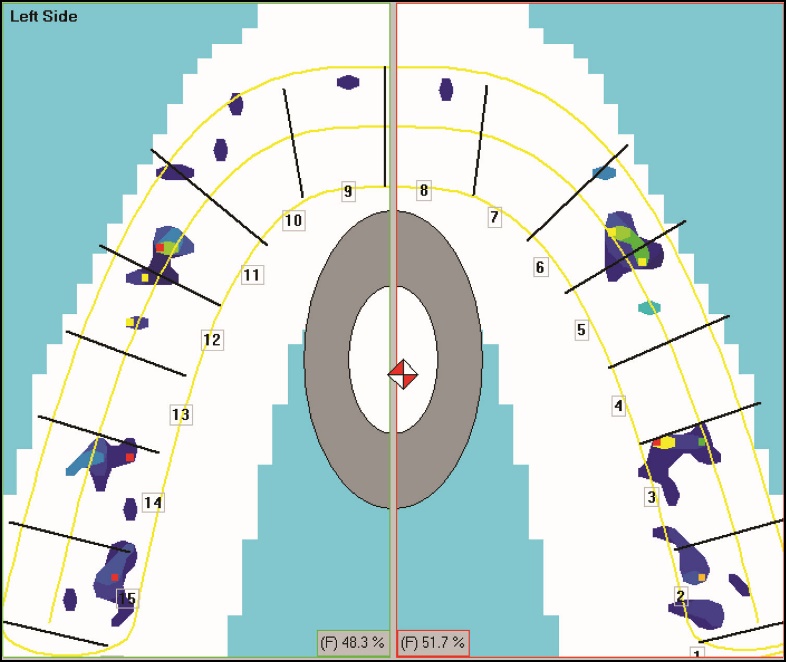
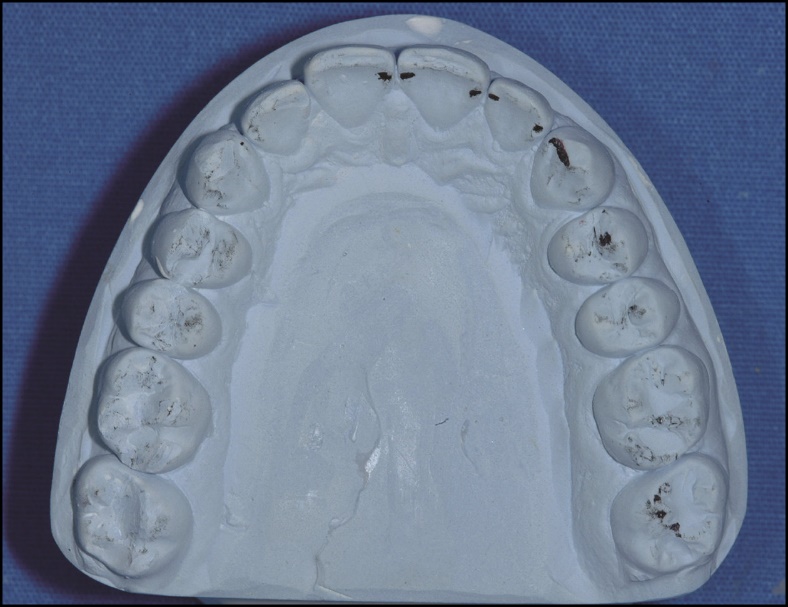
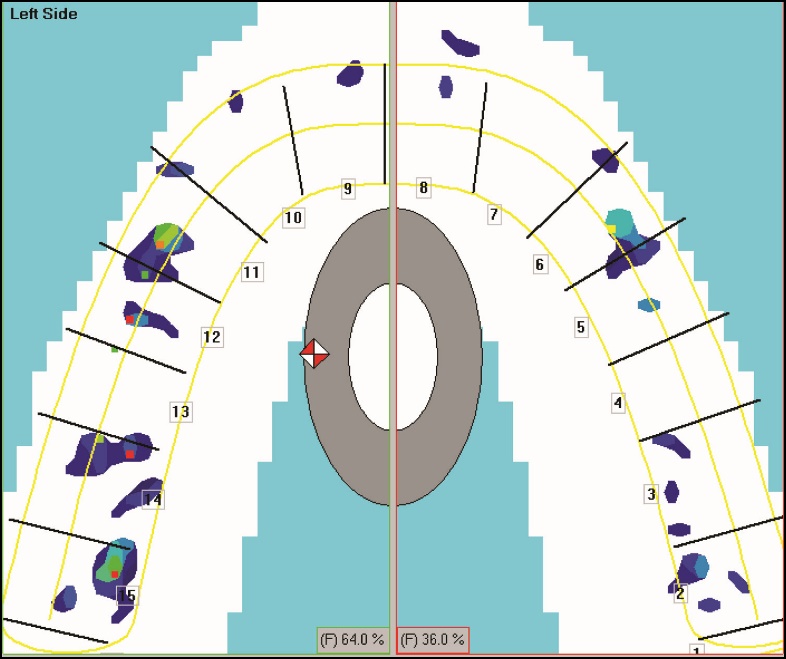
The baseline recording of the preliminary casts revealed a force imbalance of 48.3% left – 51.7% right (Figure 3). A discrepancy was then induced to the right side of the preliminary casts by grinding the occlusal surface of some of the right-side teeth. This was a random, unmeasured “dusting” of the right-side occlusal surfaces, where there was the presence of articulation paper markings (Figure 4). A force movie recording of the induced discrepancy was obtained, which revealed the arch force discrepancy increased to 64.0% left – 36.0% right (Figure 5).


To standardize the discrepancy among all mounted casts that were to be adjusted in the study, the adjusted preliminary casts were then invested in PolyPour Duplicating Vinyl Polysiloxane (G.C. America Inc., Alsip, IL, USA). The resultant impression was repeatedly poured with white Poly-Die Polyeurethane Resin (Vident, Brea, CA, USA) to give forty duplicate maxillary casts and one duplicate mandibular cast. A sample size determination analysis using the nQuery Advisor Software (Statistical Solutions Ltd., Cork, Ireland) indicated that a sample size of n = 40 casts would have a 90% power to detect a difference between the 2 proposed adjustment methods, using Student’s paired t-test with α = 0.05 for significance in a two-tailed distribution.
The duplicate mandibular cast was cross-mounted to the preliminary maxillary cast. Then all forty duplicate maxillary casts were cross-mounted to the duplicate mandibular cast using hand articulation, onto the same articulator. The same mandibular cast was used throughout the study as the opposing cast, while all occlusal adjustments were made on the 40 maxillary casts (Figure 1).
The goal of the single experienced operator was to correct the induced force discrepancy using traditional adjustment methods (Method 1). The operator was trying to obtain an exact 50%/50% right-to-left force balance by making adjustments to only the maxillary cast, using a 0.012 size, fine grit football diamond bur (Brasseler USA, Savannah, GA, USA) in a high-speed hand piece. Occlusal contact marks made with double-sided, 23-micron-thick marking strips (AccuFilm II, Parkell, Inc., Farmingdale, NY, USA) were further evaluated tactilely, with 8µm thick Shimstock foil (Hanel Shimstock, Coltene/ Whaledent Inc., Cuyahoga Falls, OH, USA). Completion of this adjustment procedure occurred when there appeared visually to be an even distribution of pinpoint markings on cusp tips and flat surfaces of each maxillary cast, and by tactile observation of each contact for “hold” with Shimstock foil.
To assess the articulating paper only results, and to further balance the remaining discrepancy, T-Scan force movies were recorded after Method 1 was deemed complete. The computer data was then employed to guide additional adjustments to the maxillary casts utilizing the same paper, foil, and high-speed diamond bur. But the adjustment decisions were based on the operator’s reading of the digital occlusal data (Method 2).
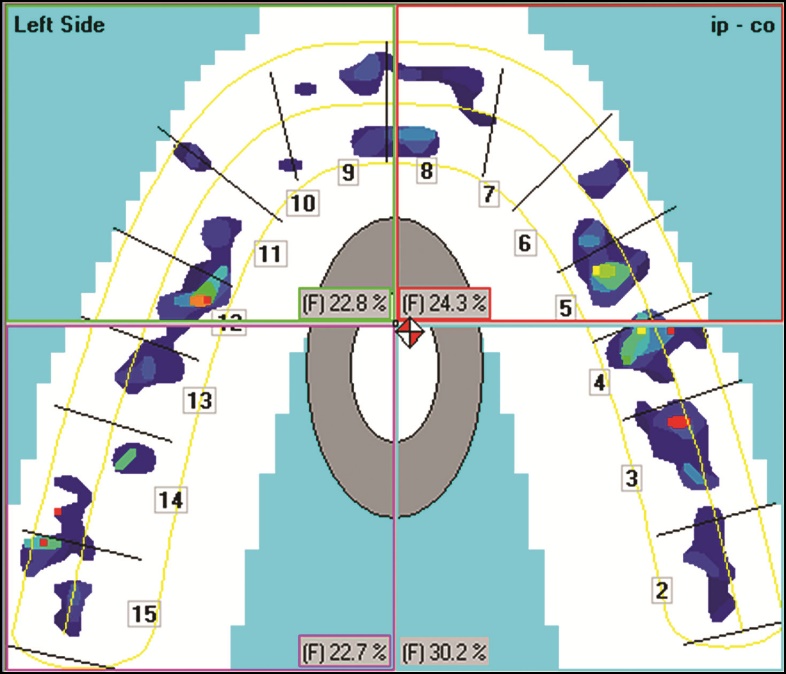
The computer guided technique employed the T-Scan software feature known as Quadrant Force Percentage Determination, which allows an operator to divide the 2-dimensional force plot into any 4 quadrants selected, and displays the percent force for each quadrant. Combined with the vertical line that divides the force plot into right and left arch halves, the operator is able to localize the most forceful contacts using vertical and horizontal coordinates to pinpoint the correct mark to adjust (Figure 6).

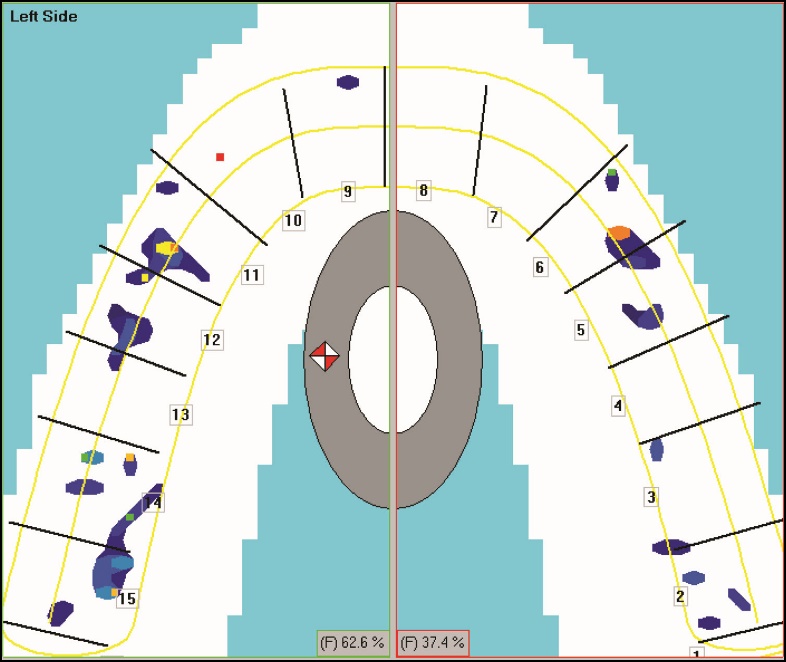
A force plot of the results of each cast that underwent experimental adjustment Method 1 was obtained for comparison to the baseline. A new HD sensor was used for each maxillary cast and it was conditioned with a series of four test closures (just as previously described). Once conditioned, the same sensor recorded the baseline discrepancy per individual cast, the Method 1 result obtained with paper only adjusting, and all of the adjustment recordings made during Method 2. An example of Method 1 results for cast #15 can be seen in Figure 7, where subjectively adjusting the contacts minimally improved the baseline force discrepancy to 62.6% left – 37.4% right. Cast #15 is a clear example of how subjectively interpreting the markings and adjusting with operator perception, can be quite ineffective.

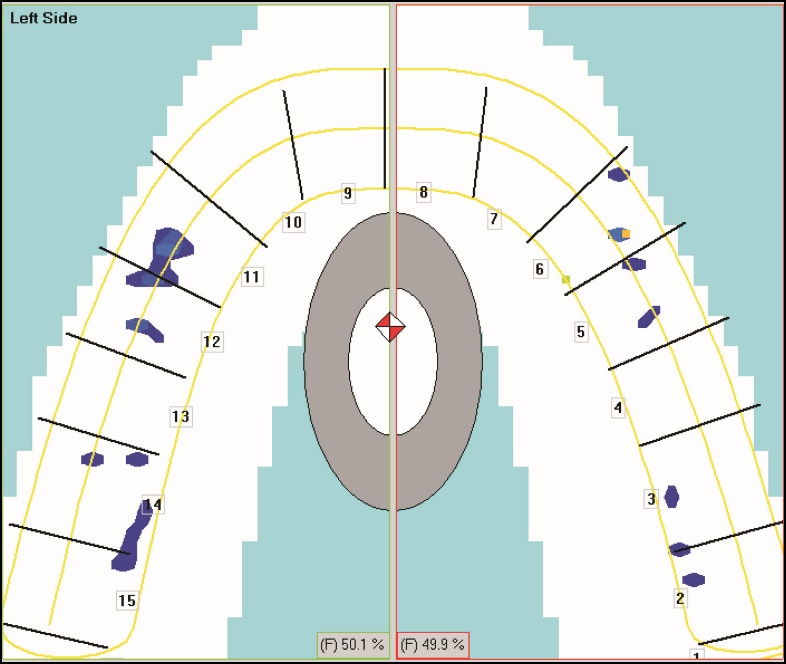
After the subjectively accomplished adjustments were completed (Method 1), new discrepancy measurements were recorded assessing the Method 1 outcomes. Next, Method 2 adjustments were then completed, and a final force movie per cast was recorded. Each of the 40 maxillary casts underwent the same cycling of Method 1 followed by Method 2 procedures. They were labeled numerically in the order of their adjustment sequence. Figure 8 shows the Method 2 results for Cast #1. The force discrepancy was reduced to 50.1% left – 49.9% right. Cast #1 is a clear example of how objectively measuring the contact forces with the T-Scan technology, and then adjusting without having to use any operator interpretation can yield a high degree of arch-half balance.

The Statistical Analysis System (SAS) version 9.1 software (SAS Institute Inc., Cary, NC, USA) was used to analyze the data. Because the study design called for a comparison of two groups, (Baseline minus Method 1, and Baseline minus Method 1 minus Method 2), Student’s t-test was used. Furthermore, since the two groups were related data sets, a paired-samples t-test was used to determine if a significant difference resulted between the two methods (p < 0.05). Baseline, Method 1, and Method 2 statistical comparisons are presented in Figure 13.
RESULTS
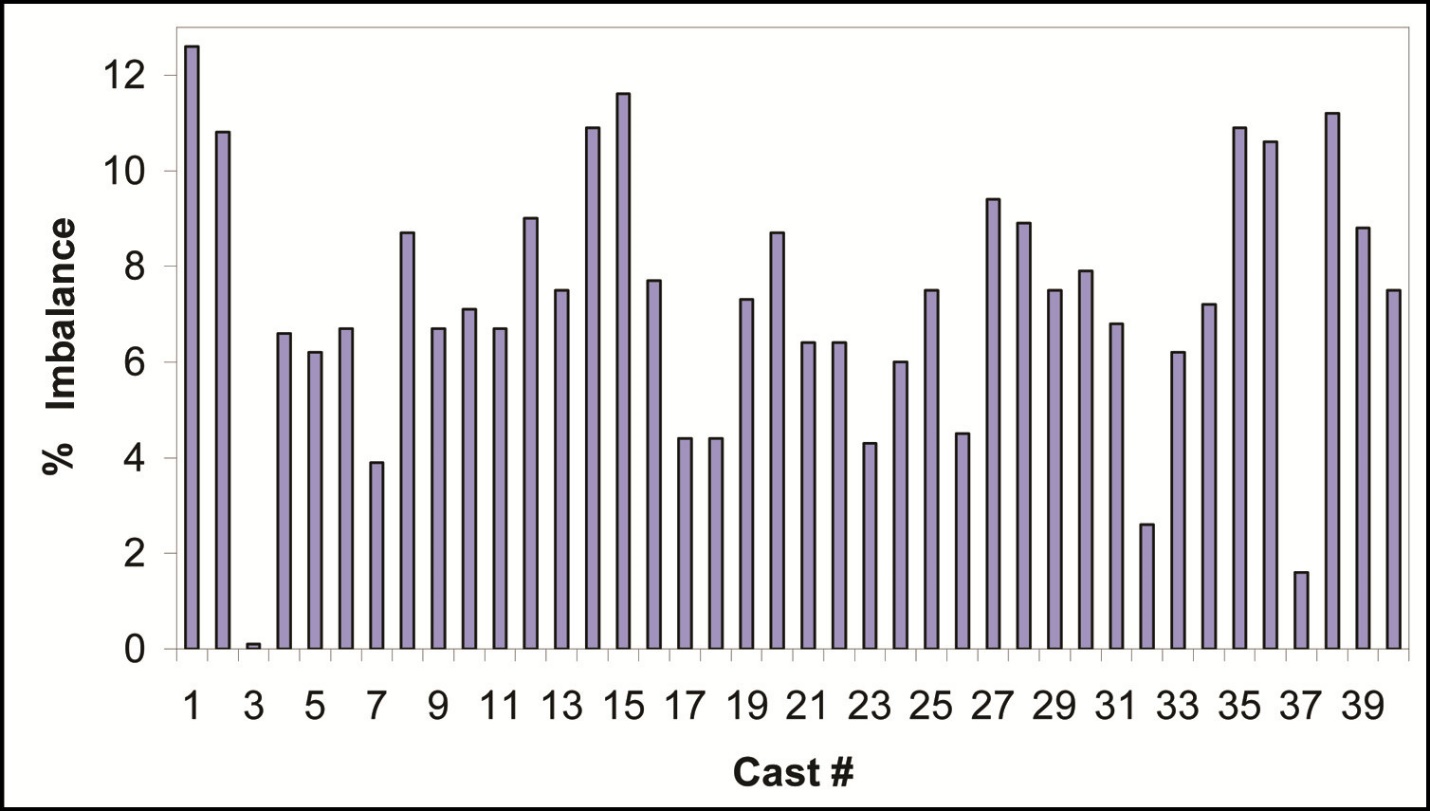
Figure 9 shows the baseline discrepancies for each cast before any adjustment methods were applied to equalize the right and left force percentage. The discrepancies ranged from 0.1 % for Cast #3 to 12.6 % for Cast #1. The mean baseline discrepancy of the forty casts was 7.25 %. Cast #3 had a near perfect baseline balance.

Figure 10 shows the discrepancies after Method 1 was applied to all casts. Method 1 improved the right to left force discrepancy, as the mean discrepancy decreased (Mean discrepancy after Method 1 = 4.73%). After Method 1, 26 of the casts showed a discrepancy decrease. But 12 casts showed a discrepancy increase, which indicated that Method 1 procedures worsened 30% of the casts. 1 Cast which had near perfect balance pre adjustment, was worsened by Method 1 procedures. 1 Cast showed no change. 4 casts obtained near perfect balance. Therefore, only 10% of the casts resulted in an ideal occlusal adjustment endpoint after application of Method 1. Overall, the mean discrepancy reduction of 2.52 %, was reflected in a 34 % discrepancy improvement resulted from Method I procedures.

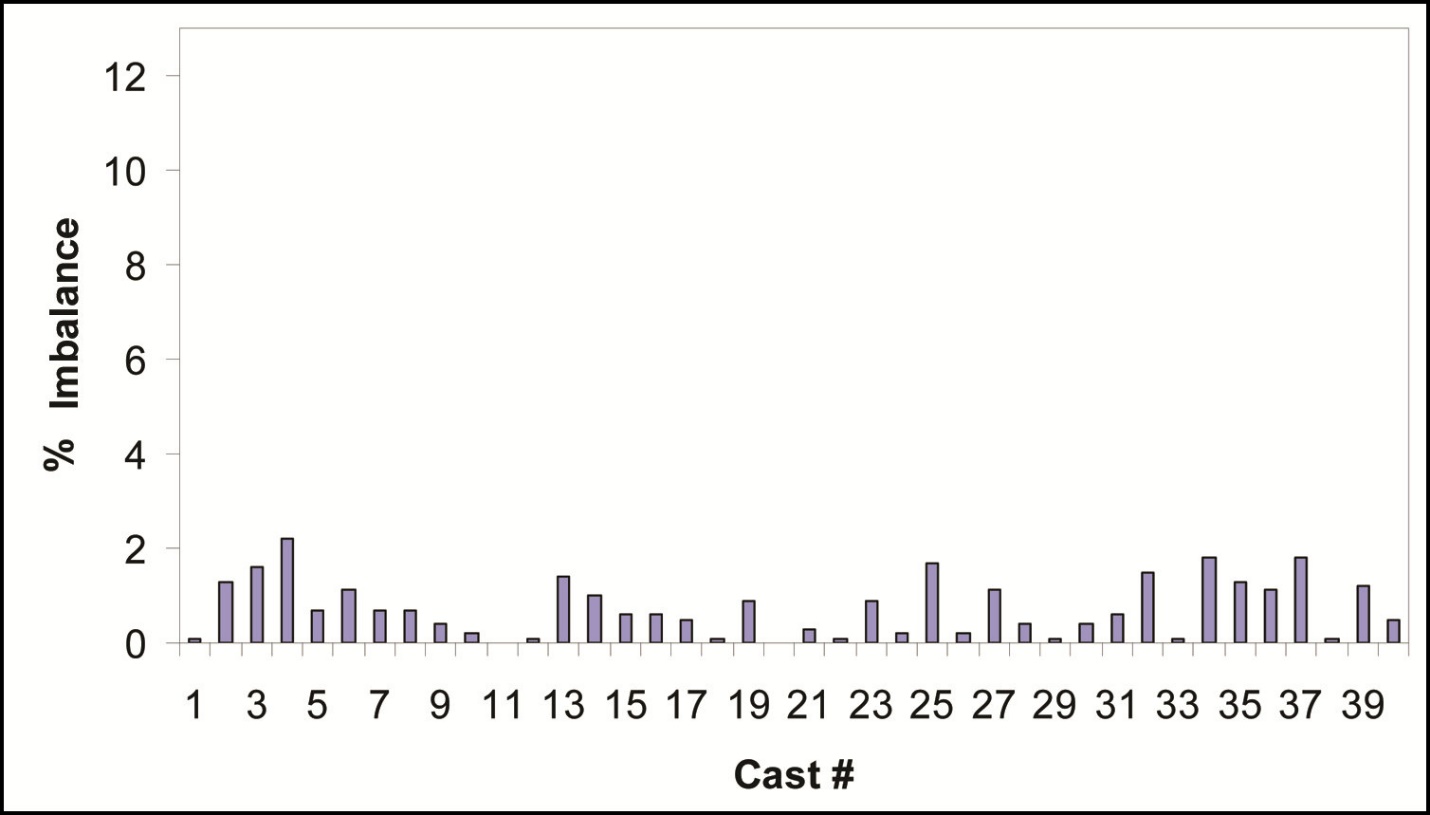
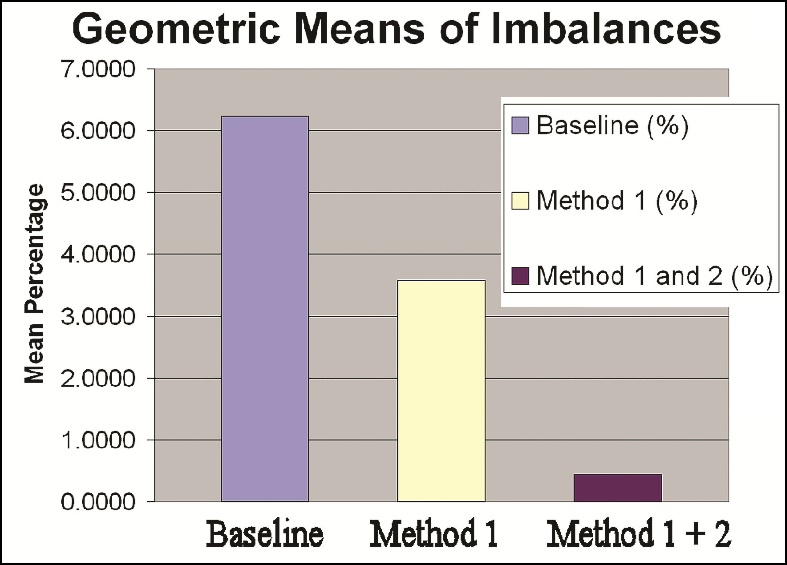
Figure 11 shows the discrepancies after Method 2 was applied to all casts. The improvement from Method 2 procedures can be seen by comparing Figure 10 to Figure 11, whereby Method 2 has further reduced the overall right-to-left force percentage discrepancy mean down to only 0.74 %. The discrepancies ranged from 0.0% for Cast #11 to 2.2% for Cast #4. Only 2 Casts did not show a discrepancy decrease, and 1 cast was worsened (1.2% increase over the 0.5% discrepancy recorded after Method 1). Figure 12 shows that the mean baseline discrepancy of the forty casts; a) before Method 1 was equal to 7.25 %, b) after Method 1 the discrepancy was equal to 4.73 % and c) after Method 2 the discrepancy was equal to 0.74%.


To compare the effect each adjustment method had on equalizing the mean right-to-left arch half force discrepancy, the mean improvement of
Method 1 was compared to the mean improvement of Method 1 + Method 2:
Method 1 (the 7.25 % baseline was reduced to 4.73 %); the improvement = 2.52 %.
Method 1 + Method 2 (the 7.25 % baseline was reduced to 0.74 %); the improvement) = 6.51 %.
The corrective power of Method 1 + Method 2 (6.51%) over Method 1 alone (2.52%) was approximately 2.58 times greater reduction than the corrective power of Method 1 alone.
Since the baseline discrepancy for each cast was not identical, the data required standardization for comparison validity. The average percentage that all casts differed from the 50%/50% value (no discrepancy), was initially compared to the individual baseline discrepancies. Then they were compared for significant differences (Figure 13.).

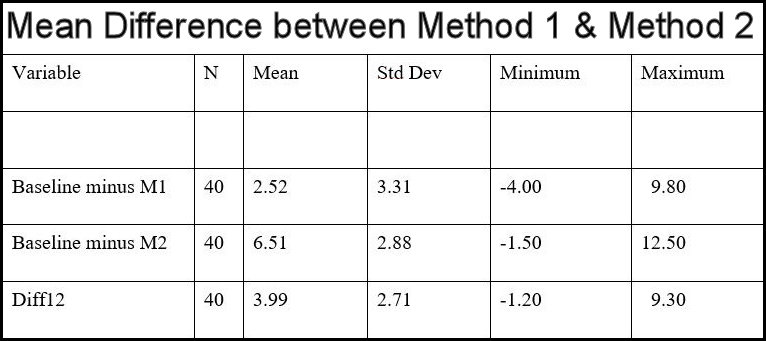
The paired-sample t-test analysis revealed a statistically significant difference in percentages for correcting the discrepancy from the baseline between the two methods (p < 0.0001). The results indicate that the mean percentage for correcting the discrepancy from the baseline using Method 2 after Method 1 was significantly greater than that for using Method 1 alone. Moreover, the mean percentage difference between the two methods (Method 2 – Method 1) was 3.99 % (std. dev. = 2.71). Figure 14 illustrates that with a 95% confidence level probability, the actual difference between the mean of Method 1 condition and the mean of Method 2 condition, ranged between 3.12% and 4.85%.

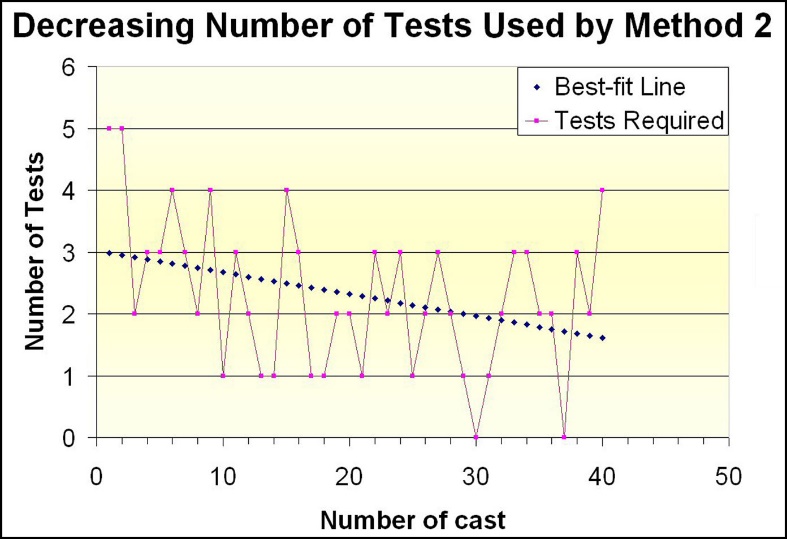
Figure 15 illustrates the number of recordings required and force plot displays used in Method 2 for each cast. A trend line shows that less recordings were required to obtain the results of Method 2 in the later casts, implying sequential learning was accomplished by the single operator over the course of adjusting Cast #1 to Cast #40.

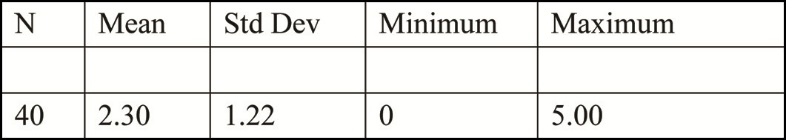
Figure 16 shows that the average number of recordings and graphical displays used to perform Method 2 = 2.30 recordings.

DISCUSSION
The results of this study show that a statistically significant better force balance was obtained in the laboratory, by employing computerized occlusal analysis, following articulating ribbon and shim stock alone. These results have an implication on how T-Scan occlusal analysis improves occlusal force balancing during clinical occlusal adjustment. An operator using Method 1, must guess which contacts require adjustment based upon the operator’s own paper mark perceptions, rather than on measured occlusal contact force percentages. This became quite clear when only 4 (10%) of the Method 1 casts had a near perfect occlusal balance endpoint. But, with Method 2 employing computer analysis and known force percentages, 23 (57.5%) of the casts had near perfect occlusal adjustment endpoints.
Articulating strips are films that leave deposits of marking substance on contacting surfaces. The films include carbon paper, cloth, or Mylar plastic and the marking substances include soot, oils, waxes, modifying additives, pigments and solvents.3 It is widely thought that a broad contact is perceived to mean a forceful contact, but the inverse is often the case. Broad contacts dissipate force over a large area resulting in low pressure concentrations, whereas, a small contact will dissipate the total occlusal force over a small area.4
Marking materials only provide occlusal contact location and surface contact area information. It is not possible to know force content from the size, color, depth of color, and/or the shape, of a paper marking, which explains why such a small percentage of casts undergoing Method 1 reached a near perfect endpoint. This study’s finding concurs with both of the recent Subjective Interpretation studies6,7 that indicate the ability of an operator to accurately determine which contacts to correct, when based solely upon what the contacts “look like,” is highly imprecise.
The use of a single operator was intended to reduce variability in the data. An interesting observation resultant from the Method 2 procedures was that for the last 25 casts adjusted by Method 2, the operator required only three to four T-Scan recordings to achieve the optimal result, while during the first 15 casts, more recordings were needed. This reduction in needed recordings in the later casts suggests that some sequential learning by the operator sped up the processes of the later adjustments (Figure 15).
In this study Method 2 was the “fine-tuning” method, and did not evaluate Method 2 being performed first, followed by Method 1, or Method 2 alone. However, the results suggest that Method 2 alone may be far more effective at achieving a more precise, occlusal adjustment endpoints, whether or not the computer-guided adjustments were preceded by Method 1. This is because no matter how large or small was the discrepancy per cast after Method 1, Method 2 reduced the mean discrepancy to less than 1%. It is very likely that although Method 1 preceded Method 2, Method 2 could have been applied alone, and would have reduced the imbalanced forces far more effectively than Method 1 did. Further study using Method 2 alone compared to Method 1 alone would be needed to confirm this.
The attempt to equalize the half-arch forces was accomplished within an average of 0.74% of perfect 50 % left – right equalization. Adjustment methods with this technique usually take place in a series of patient appointments.1 It is appropriate to stop short of perfect balance in the first appointment because of diminishing returns, where preserving tooth structure and time are important. Also, the patient can evaluate whether the result is within their tolerance level, within the physiologic levels of the Stomatognathic system and rest prior to any further adjustments being performed.1,13
Without measuring occlusal forces and contact pressures with computerized occlusal analysis, it is unlikely that the operator knows whether they have reached equal left – right forces. Traditional Equilibration is unmeasured and its endpoints are not determined by any calculations or precise measurements, but by feel, sounds, paper mark appearance interpretation, patient subjectivity, bimanual manipulation, and operator dependence on at least some of these variables.1,13 It is the subjectivity that limits its capability.
In order to provide adequate occlusal therapy, the dentist must make an accurate analysis, preferably based on evidence and objective data. Research has now clearly shown that Subjective Interpretation of paper marks is not accurate or objective.6,7 Alternatively, the T-Scan system can be seen as an occlusal microscope that can guide the operator to high precision endpoints. It can supply the operator with objective force and timing data that reveals occlusal details that would otherwise be overlooked, given human tactile and visual limitations.
LIMITATIONS
There was some variability in the baseline graph measurements, despite attempts to standardize the casts, the mountings, and the applied force level. The utilization of an interocclusal mounting index to standardize all of the initial mountings may have resulted in less variability within the baseline occlusal force percentage measurements.
SUMMARY
In a laboratory setting, 40 maxillary casts with a known force percentage arch half discrepancy were adjusted by two different methods in succession. The first with articulating paper and shim stock only. The second method, employed computerized occlusal analysis to guide the corrective occlusal adjustments with known occlusal contact force percentages. The arch-half percentage of force difference reductions from using Method 2 with T-Scan computer guidance was significantly greater than by using Articulating paper with shim stock alone (Method 1).
Conclusion
Significantly improved arch-half occlusal force equalization was obtained with computerized occlusal analysis than was obtained by the method only using marking paper, shim stock, and operator subjective assessments of the articulating paper marks.
Potential conflicts: The corresponding author is a clinical consultant to the company, Tekscan, Inc., South Boston, MA, USA and has received an annual stipend from Tekscan. However, he receives no compensation from the sales of any Tekscan products. The three additional authors claim no potential conflicts of interest.
ACKOWLEDGEMENTS
The authors would like to thank Dennis Weir, DDS, MA Certificate in Prosthodontics, for his invaluable assistance with this project.