INTRODUCTION
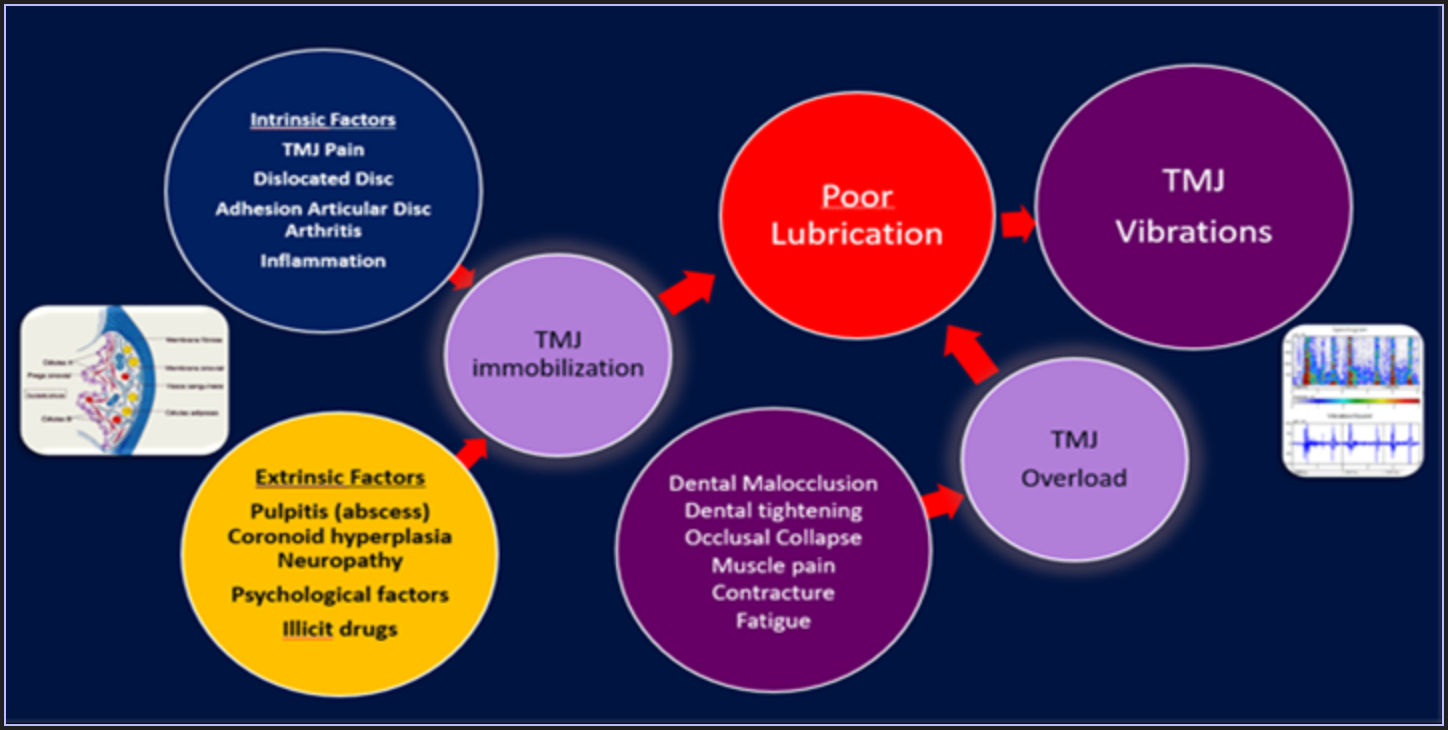
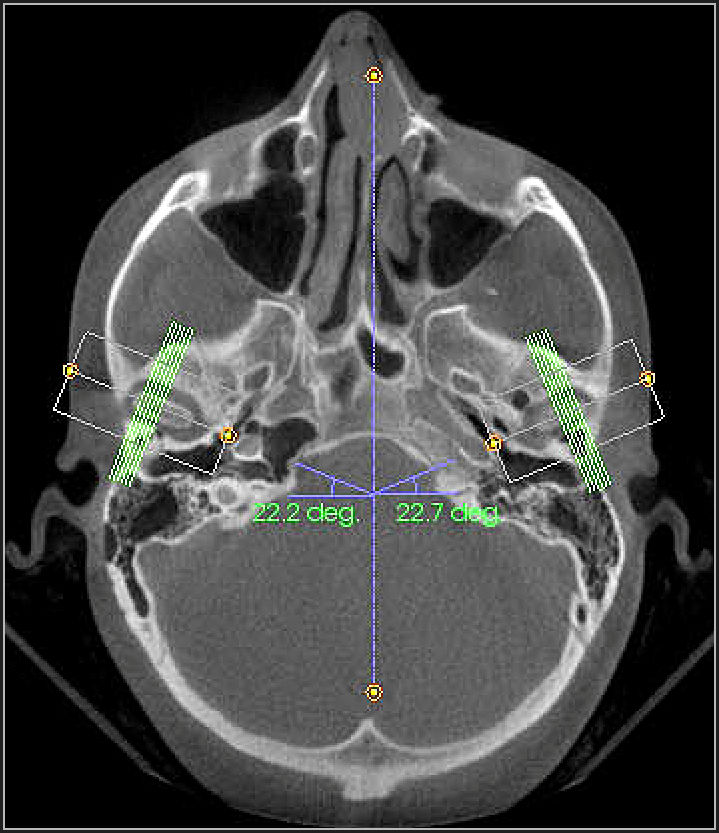
For many patients suffering from orofacial pain (OFP) and temporomandibular disorders (TMD), temporomandibular joints are involved, but not in all cases.1 TMD patients constitute a large category of diverse conditions that need to be individually evaluated in an organized manner and comprehensively diagnosed before any treatment can be planned. Figure 1. graphically describes the complexity of TMD. While the TMJ disk position is best revealed by MRI, the precise relationship of the condyle to the glenoid fossa is clearer in CBCT images. See Figure 2.


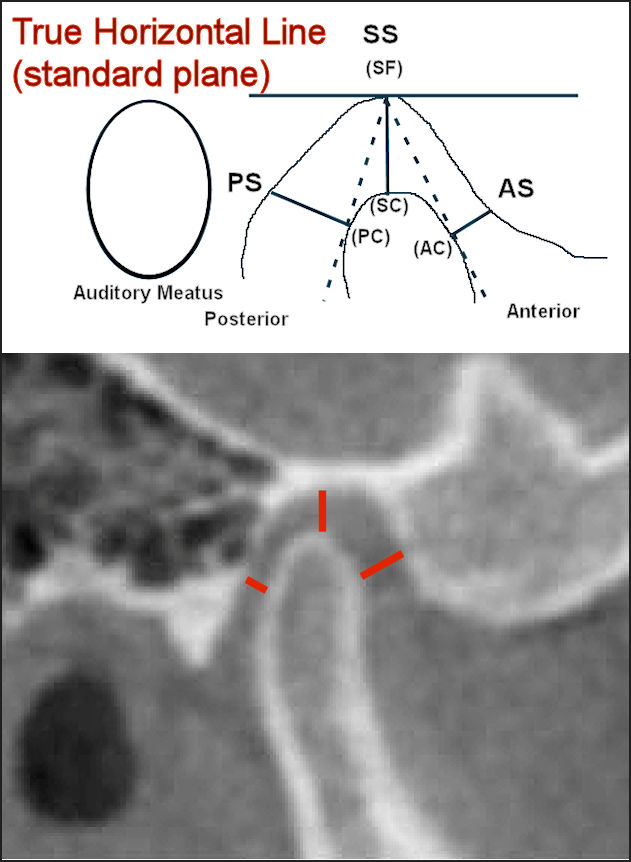
Disturbed TMJ anatomy can affect the occlusion and the distribution of forces upon individual teeth, especially the molars. Ikeda and Kawamura1 published their normal condyle spacing data from a group of 22 very normal young subjects (12 F) in 2009 documenting; 1) the anterior space (AS) between the condyle and the eminence, 2) the superior space (SS) between the condyle and the height of the glenoid fossa and 3) the posterior space (PS) behind the condyle. See Figure 3. The authors recommended using their mean values as normal examples for comparison to a dysfunctional patient.

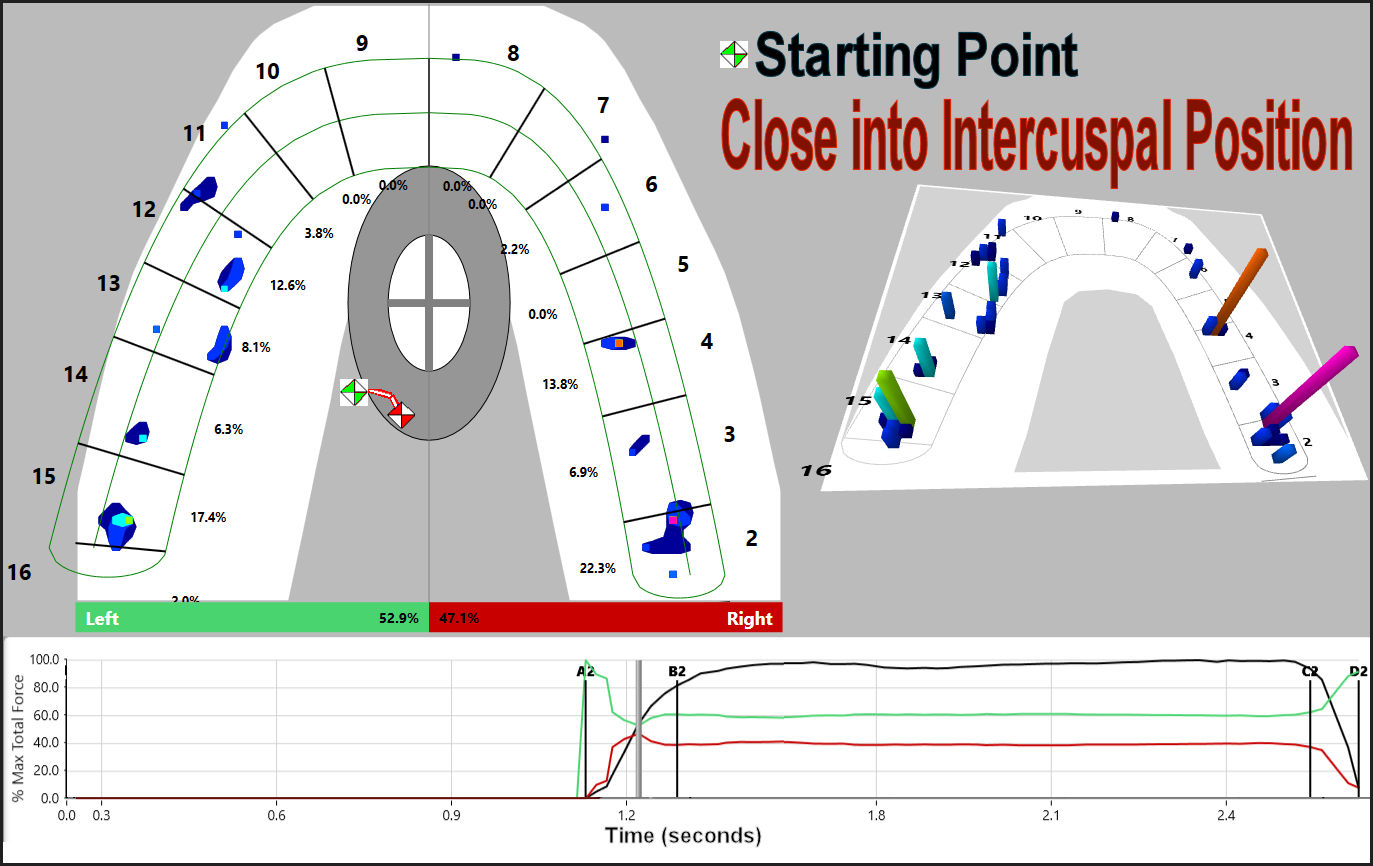
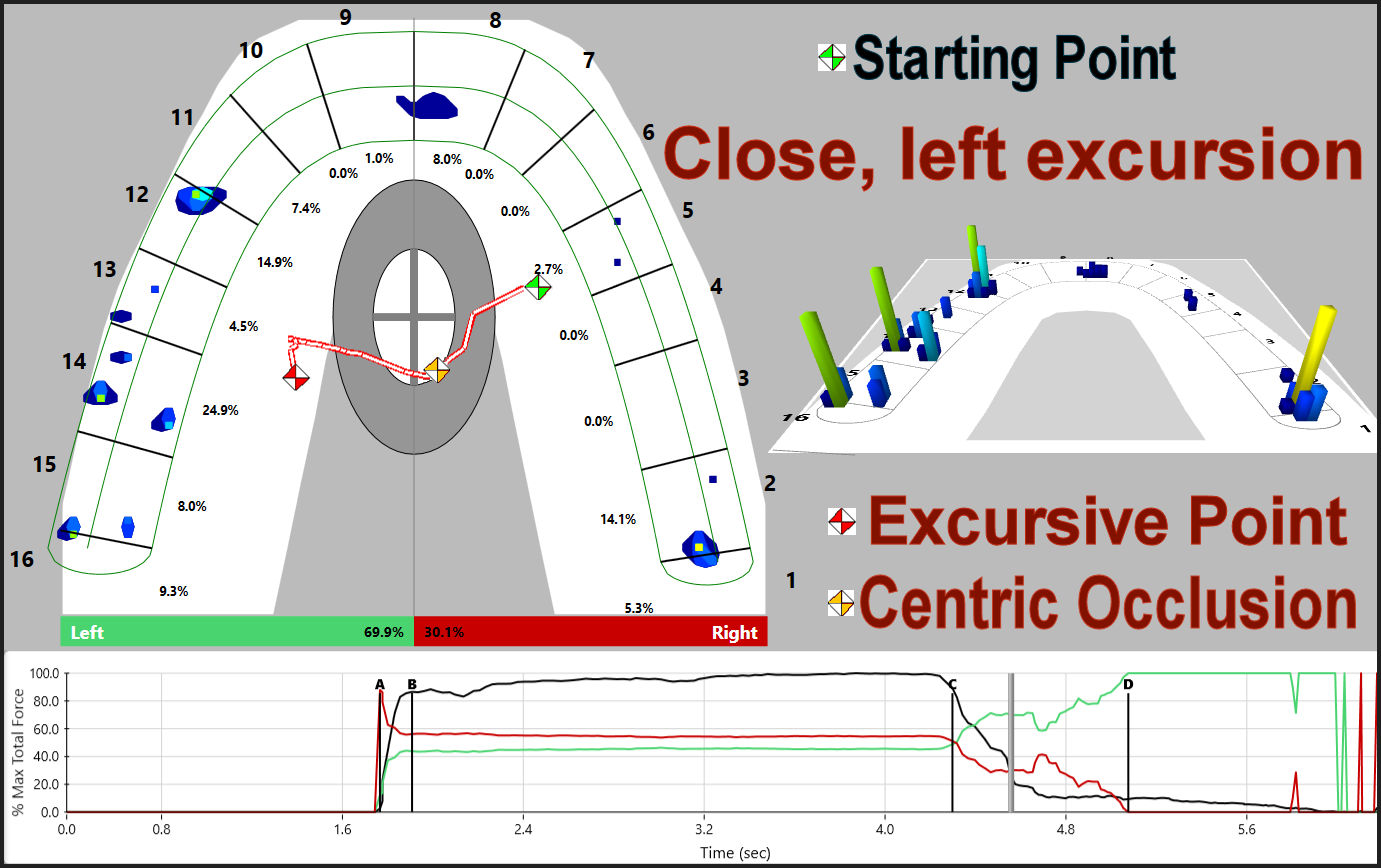
In certain cases of TMD or OFP, the etiology is at least partially related to occlusion in the form of excessive forces on individual teeth (high spots) or interferences to function.2 These conditions can be readily detected by the T-Scan,3 but not by just analyzing marks on the teeth.4–6 The ongoing deterioration of the TMJs continuously alters the occlusion and can create a malocclusion. However, when the TMJs are stable it is often possible to make minimal occlusal corrections and reduce the patient’s symptoms to within an acceptable level.7 Since the T-Scan measures both the relative force on each tooth and timing of the contacts, the practitioner can pinpoint any occlusal problem without guessing. See Figure 4.

Joint Vibration Analysis (JVA) reveals various TMJ conditions by analyzing the intensity and the frequency content and of emitted vibrations. At the minimum, it can reveal the presence and extent of TMJ damage, inasmuch as temporo-mandibular joints that are functioning normally are quiet, well lubricated and have unrestricted motion.
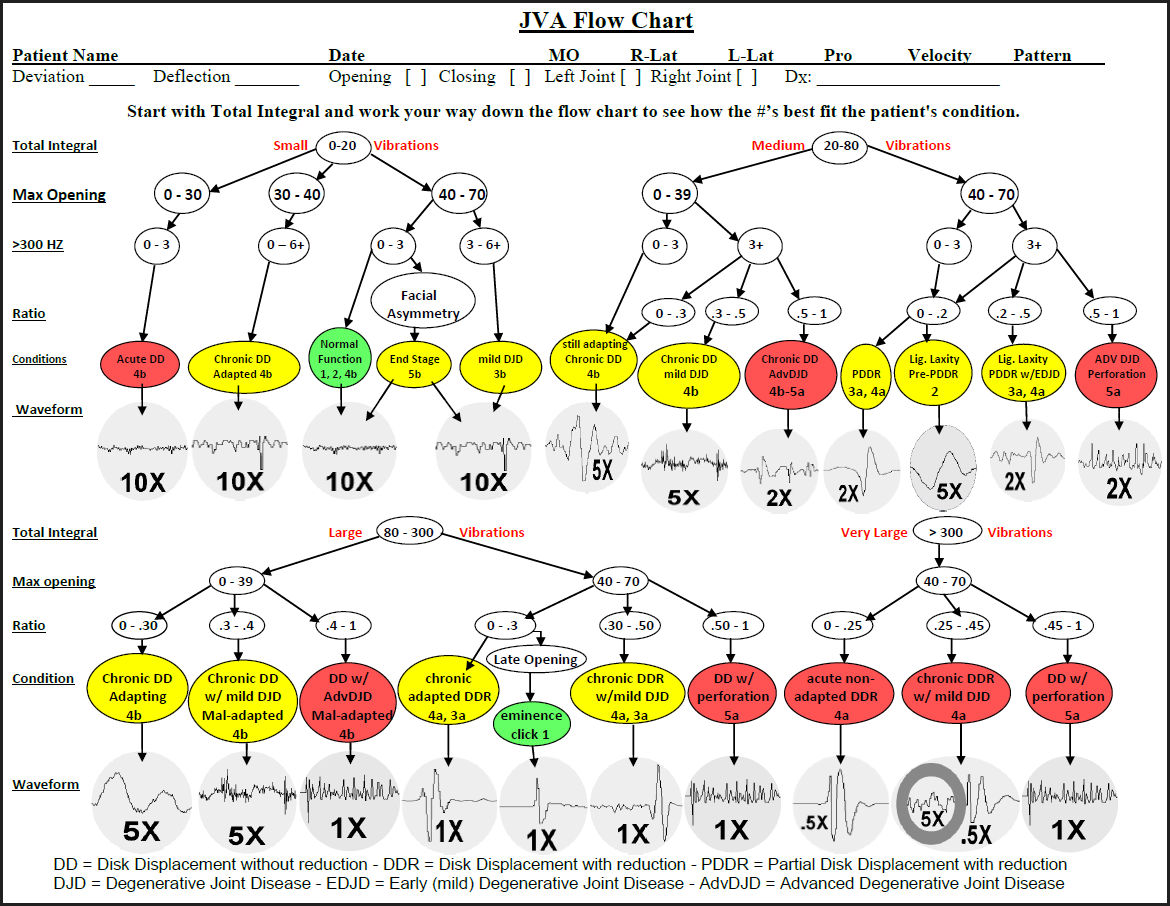
Four sub-categories of conditions can be established in terms of vibration intensity; 1) low intensities (below a Total Integral* of 20 KPaHz), 2) medium intensities (Total Integrals of between 20 and 80 KPaHz), 3) high intensities (Total Integrals between 80 and 300 KPaHz) and very high intensities (Total Integrals > 300 KPaHz). See Figure 5. Combining the intensity with frequency content very often makes it possible to differentiate between several TMJ conditions within each sub-category.8 JVA does not replace the need for imaging, which reveals the actual morphology of the TMJ. Instead, JVA complements imaging by revealing the dynamic function of the TMJ.

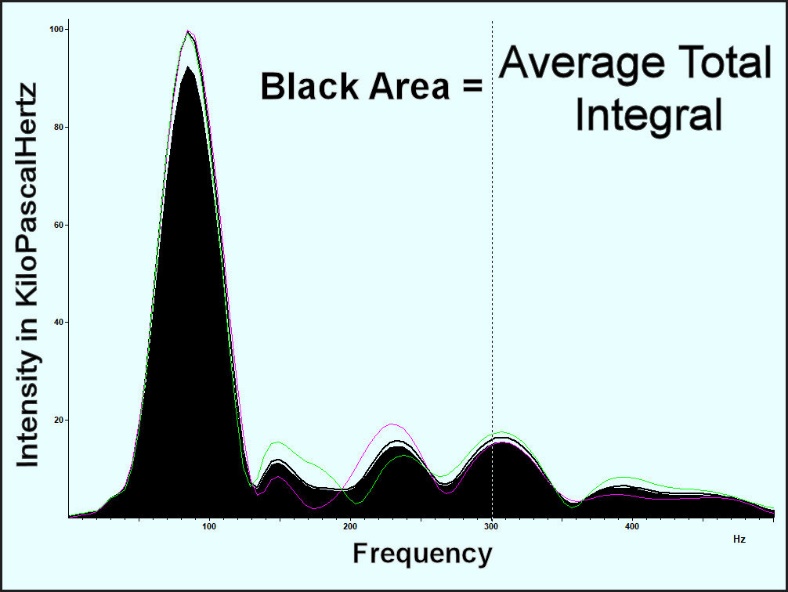
* NOTE: The quantity, KPaHz, represents the intensity of the vibrations as measured in Pascals multiplied by each frequency in Hertz and summed. It quantifies the amount of energy present by integrating the area under the frequency distribution curve. See Figure 6.

Even though it has been repeatedly demonstrated that many TMD patients are depressed, no attempt was made to evaluate the emotional conditions of each patient in this clinic because the depression in TMD patients is most often secondary to painful physical conditions. Removing the painful physical conditions that aggravate the patient has been shown to reduce depression when present.9 The current dental literature evidence suggests that it is not possible to accurately diagnose or effectively treat a TMD patient’s depression with cognitive behavioral therapy while physical pains are present.10 With respect to evaluating somatization, currently renamed as Somatic Symptom Disorder (SSD), the symptoms of SSD are generally the same as for painful physical conditions. Thus, all painful physical conditions must be thoroughly ruled out or successfully treated before it is possible to determine the presence of SSD. This is the reason that the term biopsychosocial begins with BIO.11
OBJECTIVES
The first objective of this study was to compare the condylar spacings of a TMJ dysfunction group to the normative data of Ikeda and Kawamura.
A second objective was to compare CMI scores between subjects with different TMJ conditions. An additional objective was to characterize three of the four general categories of TMJ vibration intensities (excluding normal/well-adapted TMJ function) based upon the combination of intensity and frequency parameters as recorded by Joint Vibration Analysis (BioResearch Associates, Inc. Milwaukee, WI USA). Incisor-point movement patterns such as the range of motion (ROM) and freeway space were also recorded objectively using a magnet-based incisor-point recorder (electrognathograph, EGN) model JT-3D (BioResearch Associates, Inc. Milwaukee, WI USA).
METHODS
Sixty-seven TMD patients were selected and retrospectively reviewed from the Centro de Diagnóstico e Tratamento da ATM (CDTATM, a private clinic) database, comprising 47 women and 21 men, with a mean age of 43 (+/- 12.2) years. At the first consultation the patients were surveyed anamnestically, a clinical examination was completed and complementary computerized tests, including biometric measurements.
Using the DC/TMD,12 all of these patients were classified with one or more Temporomandibular Disorders and Orofacial Pains, even though the reliability and validity of that approach remains unproven.13 The Muscle Palpation Index14 is based upon 36 areas of palpation in the muscles (bilaterally): The deep masseter, the body of the masseter, the origin and insertion, the anterior, medial and posterior portions of the temporalis, the medial pterygoid insertion and body, the lateral pterygoids through functional tests, the bodies and insertions of the sternocleidomastoids, the splenius at its insertion, etc. Although none of these patients were previously diagnosed with myopathy or neuropathy, muscle pain was the most common secondary complaint encountered.
Additionally, the data collected by the clinical examination allowed the formation of several indices including the Dysfunction Index, the Muscle Palpation Index and Temporomandibular Index,14,15 making it possible to calculate the Craniomandibular Index, which has been shown to reveal overall severity of temporomandibular disorders. However, certain aspects of jaw mobility and joint sounds are measured with poor reliability and the inter-rater agreement is only marginal at best.16 Thus, JVA and jaw tracking were used to objectively improve on these subjective estimates.17,18
Each patient was scanned with an iCAT CBCT (KaVo Kerr, Berlin, Germany) with their teeth in the intercuspal position. The condylar position within the fossa was measured in terms of the Anterior Space (AS), Superior Space (SS) and Posterior Space (PS). Figure 3 shows how and where those measurements were made.
Objective measurements of the characteristics of vibrations emanating from the patients’ TMJs were made by using Joint Vibration Analysis running under the Windows® operating system. Joint Vibration Analysis and mandibular incisor-point movements were recorded while each subject opened maximally and closed into maximum intercuspation following a metronome for timing. The JVA records were divided into four categories; 1.) subjects with bilaterally normal functioning TMJs (n = 14), 2.) low to moderate intensity vibrations with no internal derangement (n = 18), 3.) subjects with non-reducing disk displacements (n = 18) and 4.) subjects with reducing disk displacements (n = 14). The records of three patients were not available (total n = 55). See Table 1.
Each patient was also recorded biting into centric occlusion with T-Scan (Tekscan, Inc. South Boston, MA USA) to determine the distribution pattern of occlusal relative forces. The Mann-Whitney U test and Student’s t-test were applied as appropriate to each type of subjective or objective data and the Jarque-Bera test was used to determine the normality of the data when relevant. An Alpha = 0.05 was selected.
During the clinical examination bilateral palpation of the TMJs was done to the posterior, lateral and superior regions. Chronic conditions (e.g. internal derangements) of the TMJ are not usually painful unless inflammation (e.g. synovitis) and effusion are present. To verify the suspected presence of effusion T2 weighted MRIs were obtained.19
Lastly, a measurement of freeway space was made using the JT-3D incisor-point tracker by simply having the patient close from rest into the intercuspal position. The purpose was to determine how often the freeway space was excessive as has been claimed in some previous studies.20,21
RESULTS
The craniomandibular index (CMI) was calculated for each patient resulting in a mean score of 0.64 (+/- 0.11). Means were then calculated for each of the four sub-groups as shown in Table 1. No significant differences in mean CMI scores were found between the four groups.
After testing the data for normality, Student’s t-test and the Mann-Whitney U test were used selectively to compare the present group’s mean condylar spacings to the mean normal condyle spacings from Ikeda and Kawamura. See Table 2. Significantly larger means were found in each of the 3 dimensions (AS, SS & PS) for this group of patients (p < 0.05).
Significant differences were found in the vibration intensities and frequency contents of the three dysfunctional groups when compared to the normal group (p < 0.05 for all). No significant differences were found either in mandibular deflection at maximum opening or in the distance to centric occlusion at the onset of vibration when compared to the normal functioning group (p > 0.05). Only the ROM of the DD patient group was significantly less than the ROM of the group with normal function (p = 0.00001). See Table 3.
The T-scan was used to record the left-right imbalance of posterior occlusal forces for each subject clenching in centric occlusion. These data were analyzed by comparing the mean group with normal functioning TMJs to each of the other three groups using the Mann-Whitney U test. No significant differences were found between them (p > 0.05 for all comparisons). See Table 4.
Of the 67 TMD patients measured with the jaw tracker, only 5 of these patients exhibited a vertical freeway space greater than 3 millimeters, the commonly accepted maximum normal range of one to three millimeters. However, there were 16 patients with lateral deflection values greater than or equal to 0.5 millimeters, including 4 of the 5 patients with excessive vertical dimensions. See Table 5.
DISCUSSION
The range of CMI scores for the total group of 67 patients was 0.24 to 0.81. However, when the groups were divided by their TMJ conditions, the mean scores were not significantly different between any of the four groups. Thus, while the CMI is an indicator of overall TMD severity, it was not sensitive to any of the differences in this TMD patient group’s temporomandibular joint conditions, which agrees with previous studies.16
It should not be surprising that the condylar anterior spacing, AS, was significantly larger than the Ikeda and Kawamura’s normal value (p = 0.00001), since distalization of the mandible is a common finding in TMD patients. However, the superior (SS) and the posterior (PS) spacings were also significantly larger (p < 0.05) in this symptomatic group. This suggests that the condyles on average may not have been in a “close packed” position or not fully seated in centric occlusion (where the CBCT images were recorded). Another possible factor within this symptomatic group is that arthritic changes may have reduced the size of the condyle in relation to the fossa. This aspect was not proactively considered but could be the basis for further study.
Differences in vibration intensity and frequency content were originally discovered as reliable parameters through the training of an artificial neural network (ANN) on surgically verified internal derangement cases.17 The trained ANN revealed the relative importance of range of motion, intensity and frequency content, leading to the development of the JVA Flow Chart (Figure 5), which uses four sub-categories based upon Total Integral (intensity) values. Each sub-category is then mapped with the range of motion and frequency content to arrive at a high probability of the TMJ condition that is present.
TMD patients without full internal derangements often still have small to moderate amplitude TMJ vibrations present. These vibrations typically are due to partial disk displacements (reducing during opening), loose capsules (vibrating during closing) and/or early degenerative changes (presenting with higher frequency content). Unless the patient has other TMD complaints, these pre-clinical TMJ conditions typically go unnoticed. Just documenting the presence of these conditions can be beneficial in making the patient aware that any future increase in their TMJ symptoms could indicate a progression of disease.
The T-Scan was employed to evaluate the percentage of occlusal force distribution between the left and right sides of the posterior occlusion (molars and premolars). A measurable degree of imbalance was present in each of the four groups without any statistically significant differences. This suggests that malocclusion may be a factor in all of these cases even though the joint conditions are quite different, even including normally functioning TMJs. An alternative interpretation that has been offered in the past is that imbalance in occlusion must not be important if it is also present in asymptomatic subjects.22 However, it more likely reflects large differences in adaptability between subjects.
In addition to using the T-Scan to even out the left right balance in occlusion, it is also possible to improve masticatory function by removing posterior occlusal interferences in left and right lateral excursions.23 See Figure 7. This procedure is referred to as immediate complete anterior guidance development (ICAGD) and is similar to the original concept of cuspid guided occlusion. Its application is limited to cases of functional occlusal interferences when stable TMJs are also present. Unstable TMJs continuously alter the occlusion and make any form of adjustment temporary.

The vertical freeway space is usually considered normal when between one and three millimeters. In this group only five patients exhibited vertical dimension overclosures of three millimeters or more. However, sixteen of these TMD patients exhibited a deflection of 0.5 mm or greater. A lateral deflection can create a left-right imbalance that is less tolerable than overclosure.24 Although some patients can successfully adapt to a lateral shift, it may contribute to symptoms in those not as adaptable. See Figure
LIMITATIONS
The CMI comparisons of these four groups of subjects may have been affected by the limited number of cases in each group (11 to 17 subjects). Larger samples might have revealed some greater differences in their group mean values.
Even with high quality CBCT images it is difficult to measure precisely the spacings between the condyle and the eminence, fossa, etc. to a tenth of a millimeter. The fact that all three measurements were significantly larger than the Ikeda-Kawamura normal values suggests that the measurements in this study may have been more generous. This is more likely a factor with respect to the small (0.31 mm) difference in the mean Posterior Spacing than with the 1.83 difference in the Anterior Spacing. There also may have been some small difference in the two radiographic magnifications.
JVA is not intended to provide a final diagnosis, but to indicate a likely condition and detect the presence of damage to the TMJ. The sensitivity and specificity vary by condition, with normal having the highest values for both. When damage is detected it is recommended that TMJ imaging is sought to further define the condition, MRI when disk is involved and/or CBCT for degenerative conditions. To be more certain of those cases of complete disk displacement without reduction, MRI images would have been useful.
Without MRIs a risk of misinterpretation of certain TM joint conditions is possible, although even MRI requires interpretation by an expert in radiology for maximum reliability too. It is possible that the four groups in this study were not perfectly distinguished and that could have affected the inter-group comparisons to a degree. Larger groups may have also resulted in some differences in their analyses.
Funding Statement
No funding was received for this activity.
Potential Conflicts
No conflict of interest was reported by authors 1 through 5. Authors 6 & 7 are affiliated with BioResearch Associates, Inc. but receive no commissions from sales.