
INTRODUCTION
Surface electromyography (SEMG) has been the standard method used in dentistry for many decades to evaluate muscle activity under various conditions.1–3 Muscle activity from SEMG is easily obtained and a reliable measure of the relative contractibility of the masseter and anterior temporalis muscles.3–7 Arthrogenous Temporomandibular Disorder conditions are associated with internal derangements of the articular disc. The Learreta Decompression Test was published by Prof. Dr. Jorge Learreta in 2011 to test for the presence of compression within the TMJs.8 It is a five step process recording EMG; 1) at mandibular rest, 2) with clenching in maximum intercuspal position (MIP), 3) with one cotton roll placed over molars and premolars on one side, 4) with one cotton roll placed on opposite side, and 5) with two cotton rolls place bilaterally over all molars and premolars. Eight commonly used EMG Indexes were also tested in this study.
EMG Indexes defined
Masseter Percentage Overlapping Coefficient (POCM)9–11 Reveals symmetry of masseter EMG activity as a percentage.
POCM=[1−|LMm−RMm|(LMm+RMm)]x 100%
Temporalis Percentage Overlapping Coefficient (POCT)9–11 Reveals symmetry of anterior temporalis EMG activity as a percentage.
POCT=[1−(LTa−RTa)LTa+RTa ]x 100%
Torque Coefficient (TORS) Reveals lateral torquing of the muscle activity as a percentage.12–16
TORS=[∑Ni=1|(RTa+LMm)−(LTa+RMm)|∑Ni=1|(RTa+LMm)+(LTa+RMm)|]×100%
Asymmetry Index (AI) Reveals the asymmetry of muscle activities as a percentage.12–14,17
AI=[∑Ni=1|RTa−LTa|∑Ni=1(RTa+LTa)]×100%
Activity Index (ACT) Reveals any differential activity of masseter and temporalis muscles.13,15,17
ACT=(MmR+MmL)−(TaR+TaL)
Activation Index (ATTIV) Most prevalent pair of masticatory muscles or sum of the absolute differences between sides for the masseter and anterior temporalis muscles.16,18
ATTIV=|(TaR−TaL)|+|(MmR−MmL)|
Left Synergy The relationship as a percentage between the left-side masseter and anterior temporalis muscles.19–21
LS={|(LTa−LMm)|/(LTa+LMm)}×100%)
Right Synergy The relationship as a percentage between the right-side masseter and anterior temporalis muscles.19–21
RS={|(RTa−RMm)|/(RTa+RMm)}×100%)
OBJECTIVE
Analysis of the masseter and anterior temporalis muscle activities of arthrogenous subjects during the Learreta Decompression Test and eight popular EMG indexes when the subject group was compared to a control group of asymptomatic volunteers.
METHODS
The subject group included 49 arthrogenous subjects, (30 F, 61 %), with bilateral (24), left side only (18) or right side only (6) Magnetic Resonance Imaging-confirmed internal derangements. Subjects with < 6 months painful symptoms (21) were considered as relatively acute while those with > 6 months painful symptoms (28) were labelled as chronic for the sake of a comparison. As also indicated by the MRIs, effusion was present in 32 subjects and osteoarthritis in 18 subjects. All subjects gave informed consent for participation and this study was conducted in accordance with the seventh revision of the World Medical Association Declaration of Helsinki (2013), which emphasizes the importance of the publication of studies that describe negative findings. No treatment or experimental procedures were provided during this study.
A volunteer control group was assembled with 34 youthful subjects (21 F, 62 %), in good general health with zero TMJ signs or symptoms (no reported pain, deviation or deflection on mouth opening, no tenderness of the TM joint lateral pole, no muscular tenderness, no report of headaches, etc.). The majority were in Class I occlusion with no skeletal malocclusions, all had normal ranges of motion (> 40 mm) and lateral excursions. For ethical reasons the control subjects were not subjected to ionizing radiation to assess TMJ status. Although gender matching was obtained, a possible limitation was that the control group’s mean age of 26.1 + 6.5 years was significantly younger than the experimental group’s mean age of 32.2 + 14.1 years (p < 0.05).
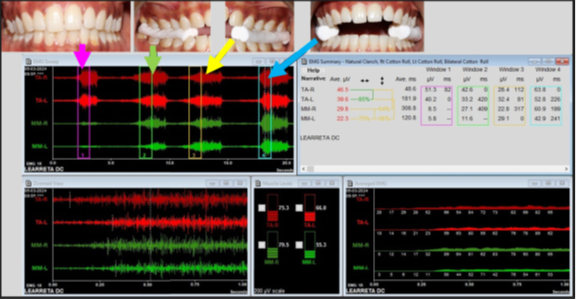
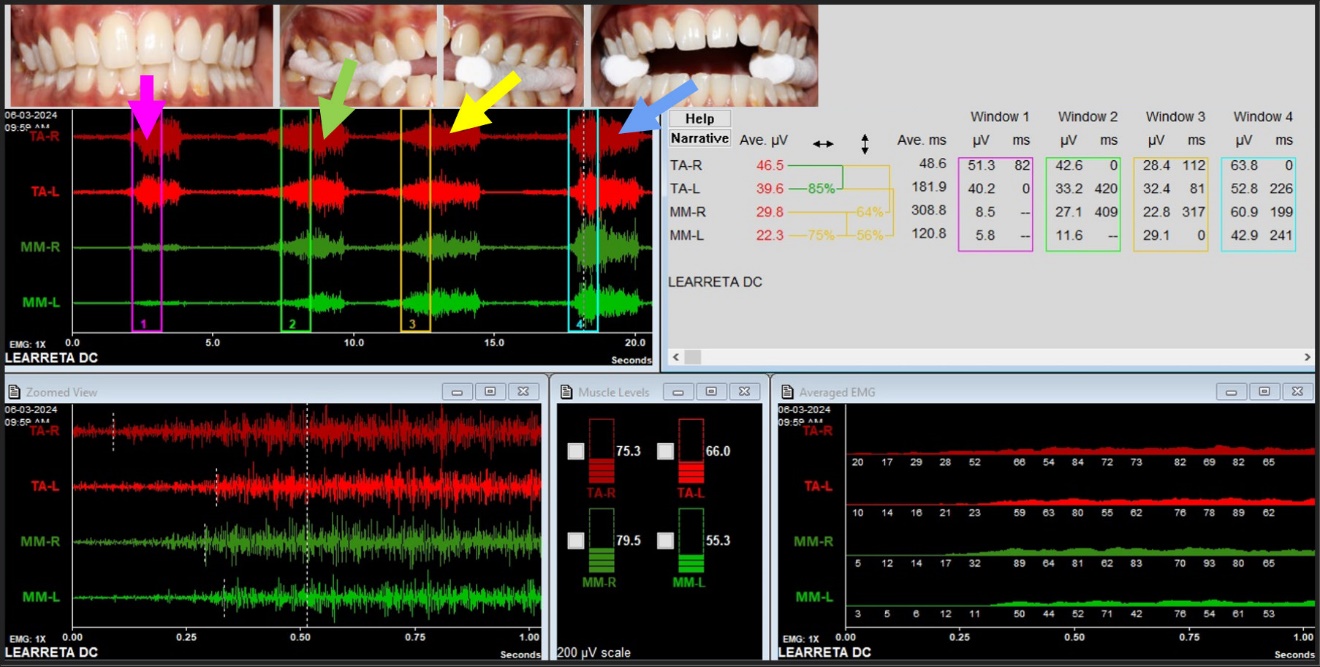
The superficial masseter and anterior temporalis muscles were recorded bilaterally from both groups using a surface electromyograph, BioEMG III and the BioPAK computer program (Bioresearch Associates, Inc. Milwaukee, WI USA), The Learreta Decompression Test includes recording: a) the resting muscle activity, b) clenching in the maximal intercuspal position (MIP), c) clenching hard on one cotton roll placed between all the right posterior teeth, d) clenching hard on one cotton roll placed between all the left posterior teeth and e) clenching hard on 2 cotton rolls placed bilaterally between all posterior teeth. See Figure 1.
_of_arthrogenous_subject._in_the_upp.png)


Filtered EMG data were used to calculate mean values, standard deviations and the coefficients of variation for each muscle under each of the five conditions. Eight previously described EMG indexes were also tested using the same data recorded under each of the five conditions (Resting muscle activity, Clench in MIP, Clench on Right Cotton Roll, Clench on Left Cotton Roll, and Clench on Bilateral Cotton Rolls.).
RESULTS
For the three indexes ATTIV, Left Synergy and Right Synergy, no significant differences were found in their means or their variability for any of the five conditions tested. Thus, only the five remaining indexes are described here.
Resting activity
The resting activity means of the arthrogenous subject group were significantly higher compared to the control group for all four muscles (p < 0.002) after applying the Mann-Whitney U Test. See Table 1. After calculating the coefficients of variation for the resting activity of the four muscles of both groups, the mean coefficient of variation of the arthrogenous group was found to be significantly larger than the control group mean according to the Sign Test (p < 0.01268).
Clench in MIP
With respect to clenching in the maximum intercuspal position (MIP), the control group means for each muscle were significantly larger than the comparable means from the arthrogenous group (p < 0.0111). See Table 2. Among the 5 indexes tested only the Asymmetry Index (AI) results were found to be significantly different between groups (p < 0.0287) by the Mann-Whitney U test. Using the Sign Test, the coefficients of variation were found to be significantly greater within the arthrogenous group than in the control group (p < 0.026), suggestive of significantly greater variability.
Cotton Roll Right Posterior
With respect to clenching on one cotton roll in the right posterior area the control means were significantly greater than those of the arthrogenous group (p < 0.0025 for all four muscles). See Table 3. For this condition again, only the Asymmetry Index was found to reveal a significant difference between the larger control means and the smaller means of the arthrogenous group. The ACT means exhibited a possible trend towards significance (p = 0.0668). After comparing the coefficients of variation using the Sign Test, the arthrogenous group means were significantly more variable than the control group means (p < 0.013).
Cotton Roll Left Posterior
With respect to clenching on one cotton roll the left posterior the control means were significantly greater than those of the arthrogenous group (p < 0.0019 for all four muscles). See Table 4. For this condition again, the Asymmetry Index was found to reveal a significant difference between the larger control means and the significantly smaller means of the arthrogenous group (p < 0.0038). The control means in the ACT were also significantly larger (p < 0.0287). In addition, the TORS means exhibited a trend towards a significant difference (p = 0.0901). After comparing the coefficients of variation using the Sign Test, the arthrogenous group means were significantly more variable than the control group means (p < 0.026).
Bilateral Cotton Rolls Posterior
With respect to clenching on bilateral posterior cotton rolls, the control means were significantly greater than those of the arthrogenous group (p < 0.0016 for all four muscles). See Table 5. For this condition again, the Asymmetry Index was found to reveal a significant difference between the larger control means and the smaller means of the arthrogenous group (p < 0.0027). The control means in the ACT were also significantly larger (p < 0.0222). The larger mean of the arthrogenous group using the TORS Index also exhibited a trend towards a significant difference between groups (p = 0.0968). After comparing the coefficients of variation using the Sign Test, the arthrogenous group means were significantly more variable than the control group means (p < 0.0128).
Acute Vs Chronic
The Arthrogenous group was further subdivided into 2 groups, those with relatively acute symptoms and those with more chronic symptoms for 6 months or longer. Comparing the means of the muscle activities between the relatively acute subjects (n = 21) and the more chronic subjects (n = 28) at rest did not reveal any significant differences (p > 0.05 for all). There was no significant difference between the mean coefficients of variation of these 2 groups (p = 0.6547). However, the right temporalis muscle consistently exhibited a trend towards significance during each of the four clench conditions (p < 0.10). The results for the eight Indexes revealed no significant differences under any of the four conditions tested between the relatively acute subjects, but the Asymmetry Index exhibited a trend towards significance in three of the four clench conditions (p < 0 10). The mean coefficient of variation of the chronic group was significantly larger than the corresponding mean of the acute group (p < 0.013).
DISCUSSION
In a previous study correlating EMG with MRI, arthrogenous subjects were successfully identified using EMG activity.22 They concluded that “The recording of the masticatory muscle function through surface EMG can be a first diagnostic approach to patients with TMDs, reserving MRI assessment to selected cases.” Another study comparing 5 subjects with 2 – 4 mm overjet to five subjects with more than 4 mm of overjet, found no significant differences in the activity, synergy and symmetry of the temporalis and masseter muscles.20 However, the extremely limited samples may have compromised those results.
The mean clenching values for the masseter and anterior temporalis muscles of the control group were consistently and reliably significantly larger than those of the arthrogenous subject group consistent with previous work,23 for all four conditions of the Learreta Decompression Test. The means of the arthrogenous group were also significantly more variable than those of the control group. The purpose of the Learreta Decompression Test is to detect a compressed TMJ that produces a painful response as a diagnostic procedure, but also to aid in selecting an appropriate oral appliance that will effectively decompress the TMJ.8 From these results EMG is strongly supported as an effective diagnostic aid and treatment planning tool for patients that have arthrogenous internal derangements.
The eight indexes calculated with the data from these groups are usually predicated only upon clenching in MIP, on appliances or on bilateral posterior cotton rolls. Only two of them, the ACT and the AI, exhibited significant differences between the arthrogenous group and the control group during any of the four clench conditions, which is also in agreement with previous work.23–25 The TORS index did show a trend towards significance (p < 0.10) for both the left posterior and the bilateral posterior cotton roll clenches. Although the other five indexes have previously been attributed to producing significant differences between patients and controls,9–11,16–21 none of the five differentiated arthrogenous internal derangement subjects from controls under any of these four clenching conditions. In agreement with this study a previous study found no significant differences in TORS or POCM between arthrogenous and myogenous TMD subjects.14
Other authors have failed to find significant differences using some of these indexes, (POCM, POCT, AI, ACT, TORS), especially when testing only asymptomatic subjects that may be well adapted to any structural differences present.26,27 The developers of these indexes fully understand that in the absence of dysfunction these indexes should indicate no significant differences between clenching with or without the cotton rolls. However, when dysfunction is present, the MIP clenches are distorted either by malocclusion or due to a maxillo-mandibular mal-relationship (e.g. Class II or Class III). The original purpose of incorporating the Cotton Roll clenches into these indexes was to a) reduce the extent of maxillo-mandibular distortion, b) disengage the occlusion and b) to temporarily create a more normalized muscular response.28–31 The use the cotton rolls allowed the test to be intra-patient only, eliminating any need to compare to an elusive standard of normality.
The elevated resting activity of many TMD patients has been used by clinicians for decades to indicate structural malformations and/or malocclusions.25,32 As a minimum, control subjects must absolutely be verified with normal TMJ function and Range of Motion. Some previous publications have found no significant difference in resting EMG activity between painful TMD subjects and pain-free controls.33,34 This has resulted from the exclusive use of pain as the discerning criterion. Pain only distinguishes the poorly adapted from the well adapted, not good structure from distorted structure, which should be the purpose of the EMG testing. Selecting a control group only based upon so-called “healthy” subjects with a lack of pain allows subjects with adapted structural distortions and malocclusions to be included as controls, weakening any comparison to symptomatic subjects. In dentistry as in medicine it is only as a last resort that a diagnosis must be based solely upon subjective pain reports and only when zero objective data are available. Accepting pain as the only useful criterion for all TMD has been revealed to be very limiting diagnostically.35 This is one of the weaknesses of the RDC/TMD, renamed as the DC/TMD.36,37
LIMITATIONS
Surface EMG is not extremely precise in the sense that subjects never produce the same precise contraction twice. Consequently, the relative distribution of activity is routinely more important for analysis than the absolute values. This is the reason that multiple indexes have been pursued very extensively for decades. Each index pursues different aspects of dysfunction, and none are usually considered as “TMD diagnostic indexes” by clinician users. The fact that only the Asymmetry Index consistently revealed significant differences between the arthrogenous group, and the control group does not negate the value of the other seven indexes for the targeted factors that they are intended to reveal. These EMG indexes are all designed to detect structural distortions, malocclusions, and/or muscle weaknesses that affect function rather than to diagnose any disease. Historically, masticatory function has not been awarded its true importance with respect to overall bodily health and wellbeing but has gained some prominence in recent years.
The presence of trends in two of the Indexes (TORS & ACT) suggests that larger sample sizes might have produced more significant results. However, the other 5 indexes did not suggest any likelihood that any significant differences might be found between or within these groups by increasing the sample size.
The quality of the EMG data recorded was very high with extremely low electromagnetic noise interference present. Other less precise EMG systems with lower common mode rejection ratios (< 130 dB) may not produce comparable results, especially with respect to the resting activity. Electromagnetic noise is less of a factor during clenching, but can still interfere with recording precise levels, especially when TMD patients have weakened muscles.
CONCLUSIONS
When testing for TMJ compression using the Learreta Decompression Test the mean EMG values of the masseter and anterior temporalis muscles, the Activity Index and the Asymmetry Index can be useful in evaluating arthrogenous subjects and identifying patients that may benefit from custom oral appliances.
DISCLOSURES
Dr Noureen Nahar, (MDS), Post Graduate Student, Department of Oral Medicine and Radiology, SDM College of Dental Sciences and Hospital, Sattur, Dharwad, Karnataka, India.
Dr. Atul P. Sattur, MDS, Professor, Department of Oral Medicine and Radiology, SDM College of Dental Sciences and Hospital, Sattur, Dharwad, Karnataka, India.
John Radke, BM, MBA, Chairman of the Board of BioResearch Associates, Inc., Milwaukee, WI USA.
Dr. Kirty R. Nandimath, MDS, Professor and Head, Department of Oral Medicine and Radiology, SDM College of Dental Sciences and Hospital, Sattur, Dharwad, Karnataka, India
FUNDING
No funding was provided from any source.
Advanced Dental Technologies & Techniques {4 year Impact Factor = 5.11}