


Introduction
An internal derangement (ID) of the temporomandibular joint is one of the more common findings when examining patients exhibiting various symptoms associated with temporomandibular disorders (TMD),1–3 especially when examining elderly patients.4,5 However, there does not appear to be a very strong correlation between the wide range of clinical TMD symptoms and ID.6,7 This is also evident by the rather poor sensitivities and specificities of the Research Diagnostic Criteria for TMD (RDC/TMD) axis I as compared to technical methods with respect to the diagnosis of ID.8–11 It is reasonable to expect that an ID may have a deleterious effect upon joint function, although the full effects of ID upon masticatory function have not been thoroughly elucidated. Recently, a study identified three general effects on masticatory function in a sampled population of ID subjects; 1) a slowed chewing rate, 2) a reduced vertical dimension of the Average Chewing Pattern (ACP) and 3) an increase in variability.12,13 Kuwahara et al had previously revealed some differences in the shape of the ACP between a group of normal subjects and patients with specific stages of ID.14–16 Previous studies utilizing artificial intelligence and wavelet transforms also detected differences in the movement ACPs between normal and disk displacement patients, with or without reduction.17,18
There are several models that theoretically describe human movement including; 1) the minimum torque change model, which postulates that movement dynamics should minimize the time derivative of joint torque,19 2) the minimum variance model that assumes the shape of a trajectory is selected to minimize the variance of the final position20 and 3) the minimum jerk model, a kinematic model, theoretically independent of the musculoskeletal system, hypothesizes that the objective of function should be to minimize the time integral of the square of the magnitude of jerk.20 The mathematical formula for minimum jerk is shown in equation 1. Despite its apparent complexity, this equation just sums up the intensity over a time period and then squares it, making it nonlinear.
Cj=12∫tf0((d3xdt3)2+(d3ydt3)2) dt
While all three models likely reflect the quality of function, they do tend to be less predictive of rapid movements.20 Of the three, the calculation of the third model during chewing, to evaluate the smoothness of function, is generally simpler since jerk is the third derivative of position. However, for analyzing masticatory function the second model has merit also, since it has been previously demonstrated that control subjects chew into a precise terminal chewing position with larger, but significantly less variable ACP.12,13
Yashiro et al compared the theoretical minimum-jerk (maximum smoothness) model to actual vertical jaw opening and closing movements during chewing using a time integral of squared jerk (jerk-cost).21 Jerk, defined as the third derivative of position with respect to time in calculus, is the rate of change of acceleration/deceleration.
Jerk=d3xdt3
They found that the jerk-costs and the peak velocities of control subjects during chewing were significantly correlated with those predicted by the model. However, the predictions of the closing movements of mastication were more accurate than the opening movements. This may be because the closing movements are when the work is done during mastication and may be a more precisely controlled movement. Several additional studies by this same group have subsequently demonstrated the effects of several different dental treatments on improving the smoothness of the chewing function.22–24 Studies have also introduced acute occlusal interferences to subjects and documented the subsequent increase in jerk-cost,25 compared the higher jerk-cost of prognathic subjects to a control group,26,27 and evaluated the less smooth closing chewing movements of cross-bite subjects.28
Although the mean velocity of chewing has been shown previously to be significantly reduced in dysfunctional groups when compared to a control group,12,16,29–32 that is not true in every case at the individual level. The mean cycle times, when measured in control groups tend to fall around 700 (+/- 100 ms) milliseconds. For recordings from dysfunctional groups the mean cycle times average closer to 950 milliseconds (+/- 200 ms), and with greater variability.12,31–34 However, some “dysfunctional” ID individuals clearly function with a cycle time that is not significantly different from that of a control group mean. The question, “Are they truly dysfunctional?” could be asked about these individuals. Thus, other indications of masticatory function/dysfunction, such as jerkiness, may potentially be helpful to identify the level of successful adaptation of apparently better adapted ID individuals.
Objective
The objective of this study was to evaluate the degree of jerkiness during gum chewing by calculating the Cumulative Absolute Jerk function (CAJ) present in exactly 10 cycles of each subject’s mandibular movement (cycles 2 – 11 inclusive) during both right-sided and left-sided gum chewing. The numbers of inflection points were also considered as possible alternative indicators.
The null hypothesis: No difference in the CAJ of gum chewing between bilateral imaging verified TMJ internal derangement (ID) patients and control subjects with normal TMJ anatomical relationships.
Methods and Materials
It was decided to avoid squaring the Jerk values because by squaring the Jerk values, a non-linear function is created, thereby exaggerating the amount of any change.

The mathematical formula for CAJ is given below (3).
CAJ=n∑x=0|d3xdt3|
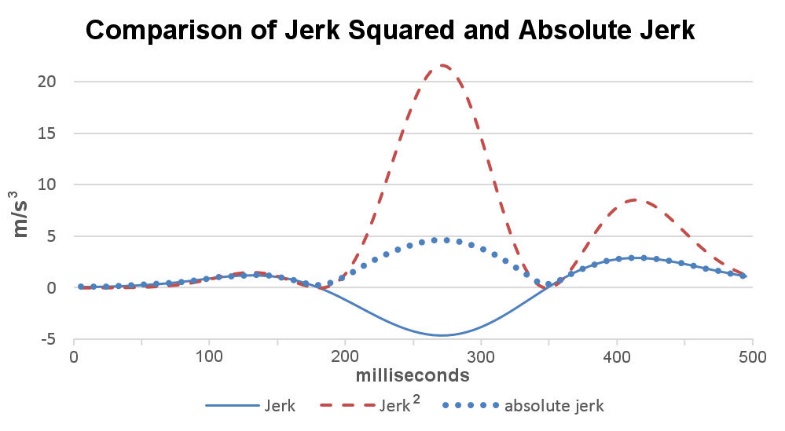
The Mandibular Jerk function is the third derivative of the position of the mandible. Jerk represents the rate of change of acceleration and deceleration, which can be understood literally as a quantification of jerkiness. See the control subject sample in Figure 2 and the dysfunctional patient sample in Figure 3. Jerk is a bipolar function (+ & -) because masticatory motion includes both acceleration and deceleration. Consequently, before integrating the jerk to calculate a cumulative value, it is necessary first to either square (x2) or rectify (take the absolute value of) | x | the data to make all values positive. Otherwise the integral will approach zero because the positive values will cancel the negative values.

Squaring values greater than one dramatically increases the amplitude of each data-point and in a highly non-linear way, but rectification maintains any linearity that is present in the original data. See Figure 1. When integrating a bipolar waveform, the duration of the cycle (time) is also a factor affecting the amplitude of CAJ. Thus, a long, slow dysfunctional cycle (Figure 3) has more sampled points to be integrated than a shorter cycle, partially offsetting the higher absolute amplitude values of jerk associated with faster, shorter more normal cycles.

Gum-chewing records from a previously recorded database of JT-3D jaw tracker incisor-point motions (BioResearch Associates, Inc. Milwaukee, WI USA) were reviewed as previously described,12 including 112 subjects (56 F & 56 M) documented with internal derangement (ID) of at least one TMJ with MRI and JVA. An age (p > 0.37) and gender matched control group (21 F & 21 M) was extracted from a database of normal control subjects chewing gum using the identical protocol. Since the first cycle of a gum-chewing sequence is often distorted by bolus manipulation, cycles 2 through 11 were isolated from each dysfunctional and control subject to be analyzed. See Figure 4.
_and_1_from.jpeg)
The three dimensions of vertical movement, A/P movement and lateral movement were first combined into a three-dimensional speed (velocity without considering direction) that included all three dimensions by using the Pythagorean geometric method. Following that, the acceleration and the jerk functions were calculated from the velocity.
The ten cycles of 3-dimensional movements from each chewing sequence were also averaged to produce 40-point movement profiles, averaged chewing patterns (ACP), with 20 opening and 20 closing points. The ID subjects were divided into two equal groups. Group I.) the 56 ID subjects with the fastest average cycle times (mean cycle time = 719 milliseconds), their group mean was not significantly different from the control group (p > 0.90). Group II.) the 56 gum chewing ID subjects with the slowest mean cycle times (mean cycle time = 962 milli-seconds) such that their mean cycle time was significantly longer than the mean cycle time (715 milliseconds) of the control group (p < 0.000).
From each subject’s isolated ten chewing cycles a mean Cumulative Absolute Jerk Function (CAJF) was calculated (Equation 3). The mean CAJF represented the total amount of Jerk present within each gum chewing sequence. The CAJF was then used to calculate a mean value for each group. The mean CAJF group values were compared statistically between the two ID groups and to the control group using a two-tailed Student’s t test (alpha = 0.05) after verifying data normalcy with Jarque-Bera.
Jerkiness is produced by alternating acceleration and deceleration. An alternate and simple method of evaluating the Jerk function is by counting the number of inflection points within each cycle. One inflection point occurs with each transition, acceleration to deceleration or vice versa. Thus, the number of jerk inflection points coincides with the number of peaks in the acceleration or deceleration, but the jerk function amplifies small changes, making it more sensitive. See Figure 3. The more inflection points within a cycle, the jerkier the cycle, but not necessarily in intensity. The minimum number of inflection points possible is two during opening (one acceleration and one deceleration) and two during closing for a total of four. See figures 2 and 3. Two advantages of this approach are that closing jerkiness can easily be evaluated separately from opening jerkiness and that jerkiness is independent of intensity. However, since the number of inflection points varied from cycle to cycle, mean values were calculated separately for opening and closing within each 10-cycle sequence. See Table 1.
Note: Gum was chosen as the test bolus for several reasons; 1) gum is a soft bolus without any propensity to fracture that would artificially add to the jerkiness, 2) it is also conveniently very consistent in both size and texture for all subjects, 3) it is not consumed at different rates by different subjects, 4) a fresh stick of gum is flavorful enough to encourage vigorous chewing and 5) even patients with poorly adapted ID are able to chew gum. Effective testing of the performance of the masticatory system requires using a tough bolus because it more effectively challenges the system and increases the evidence of dysfunction in cases where it is marginal. This was not an objective of this study. Rather, it was our purpose to minimize the influence of the bolus on the measurement of the smoothness of function. An IRB exemption was requested and obtained for this retrospective study BIRB/96Z/2020.
Results
The ID group with the shorter mean cycle time of 719 +/- 154 milliseconds, which was not significantly different from the mean cycle time of the control group (p = 0.904), did have a significantly larger mean CAJ at 454 + 98 (p = 0.0000). In contrast, the ID group with the significantly longer mean cycle time of 962 +/- 226 milliseconds (p = 0.0000) had a significantly smaller mean CAJ at 223 + 55 (p = 0.0000) compared to the Control Group mean CAJ of 355 + 55 and mean cycle time of 715 +/- 85 milliseconds.
Discussion
One difficulty in evaluating the significance of jerk with respect to ID is the fact that some ID patients have higher values of CAJ, some have lower values of CAJ and some have very similar values to a control group. The reason for this is the fact that faster movements produce higher values of acceleration and consequently higher values of jerk. Slower movements produce lower values of acceleration and jerk. The well adapted ID patient chewing at a normal cycle rate produces much higher accelerations than the more dysfunctional slow chewing rate ID patient. Thus, it is not possible to simply use jerk (in a vacuum) as a reliable indicator for the presence of ID. Several previous studies have concluded that improving the dental condition can improve the smoothness of mastication,21–23,26,29 while introducing an occlusal interference24 or the presence of an aberrant or developmental condition (e.g. prognathism, crossbite, etc.) can have a negative effect on the smoothness of masticatory function. That should be sufficient to infer that smoothness is itself a positive indication. The apparent value of measuring the jerk function is more a matter of determining the smoothness of the patient’s function, independent of the reason(s) for any dysfunction. Rather than being a diagnostic aid, jerkiness is more a qualitative indicator of good masticatory function, better suited as an outcome measure than a diagnostic indicator.
Once it has been recognized that other factors besides ID may be at play when a patient exhibits jerky dysfunctional mastication, this limitation can be acknowledged. Also, when present, the ID may not be the only factor influencing the ability of a given patient to function normally. If a chronic-adapted ID is the only factor affecting the patient’s ability to chew, it may not be that significant. Whereas, another patient with ID, DJD, and several other negative occlusal factors, may find it far more difficult to masticate and consequently slow down. Some patients with ID will develop degenerative joint disease (DJD) over time, which can contribute to their inability to function smoothly.
It would be preferable if one parameter could be found that would identify all ID conditions, whether well adapted or not. In evaluating jerk graphically, it was noted that in both cases the ID patients typically produced more distinct changes from acceleration to deceleration and vice versa than control subjects; more peaks and more valleys in the jerk waveform.
At the beginning of acceleration and at the beginning of deceleration there is an inflection point, which can be easily detected by software. For a maximum smoothness chewing cycle there can be no fewer than two inflection points in opening and two in closing, at least one acceleration and one deceleration in each half cycle. However, in cases of severe dysfunction there can be many more. This is also true with respect to the number of peaks in a jerk waveform. See Figure 4.
It is a common axiom that two measures are better than one. The old saw, “Measure twice, cut once,” has a long history. In medicine, it is commonly acknowledged that the use of multiple diagnostic indicators can improve the accuracy of a given diagnosis.35 How is it that dentistry is so focused upon finding that one perfect indicator, rather than accepting the truth that no single indicator can possibly identify all the 40 + conditions under the category TMD.
Limitations
Although the control group was carefully matched by age and gender to the subject group, the controls did not have MRIs taken to support the normal status of their TMJs. In previous experiences, some control subjects had very well adapted internal derangements that were currently without pain or other symptoms except a reduced ROM. In fact, some of the ID patients in this Group I did not complain of any specific TMJ pain or movement restrictions as they were apparently very well adapted and only offered some limited muscular or occlusal complaints. Without MRIs some IDs in Group may not have been detected clinically. Individuals with well adapted ID do not complain of joint pain and often do not require any joint treatment. Thus, failure to detect a well-adapted ID is not problematic for those patients. However, promoting the false assumption that all ID patients will eventually reach a stage of good adaptation and therefore none require any treatment, does not concur with actual data.36
Conclusions
The normal cycle time ID group had a significantly higher CAJ than the control group because they used jerkier movements while chewing at a normal rate. However, the long cycle time ID group had a significantly lower CAJ as they chewed very hesitantly. The ID group with faster and jerkier movements appeared to be better adapted to their conditions.
Inasmuch as the range of CAJ for all ID patients clearly overlaps above and below with that for control groups, it is necessary to invoke some additional indicators. There are a many other indications available to evaluate the efficacy of masticatory function; cycle times, variability, restricted chewing motion and an increased presence of inflection points in the Jerk waveform. Further study of additional masticatory factors should be pursued.
Statement of possible conflicts of interest
John Radke is the chairman of the board of BioResearch Associates, Inc. and Parvathi Kadamati is a biomedical engineer there. Neither receives any monetary income from the sale of product.
Statement of funding sources
No funding was received from any source for this study.