INTRODUCTION
In a private practice it may not be practical to obtain CBCT or MR imaging on every new patient, but it is important to have a reliable indication of any present damage in any new patient’s TMJs. The patient’s medical history report and clinical examination results, while necessary and valuable, are often insufficient to provide an accurate indication of TMJ status.1–10 And situations do arise where it is necessary for economic reasons to limit imaging to either CBCT or MR, choosing the one that is likely to contribute the most information to the diagnostic process and can be justified.
Joint Vibration Analysis (JVA) is a computerized process of recording vibrations bilaterally from the TMJs and processing the vibrations in software to arrive at a reliable indication of whether the TMJs are normal or damaged. The recording step involves first measuring the range of motion (ROM) and denoting any deflection at maximum opening of 3 mm or more. Deflections of less than 3 mm have commonly been measured within normal control subjects,11 or 2 mm in children.12 Then, a pair of accelerometers are placed directly over the TMJs and the patient is instructed to open maximally and close to a light tooth contact 6 or more times. The patient follows an on-screen metronome to control the speed of the motion. This simple movement requires both condyles to translate to their full extent, revealing any limitation in the range of motion, deviations, any deflection and/or joint noises. The light tooth contact serves as a marker and verifies that the full ROM has been included within the recording. It is critical that the patient follows these instructions, opening to maximum, closing all the way to light tooth contact and following the pacing of the metronome to produce a useable JVA record.
A concise history of TMJ sound analysis
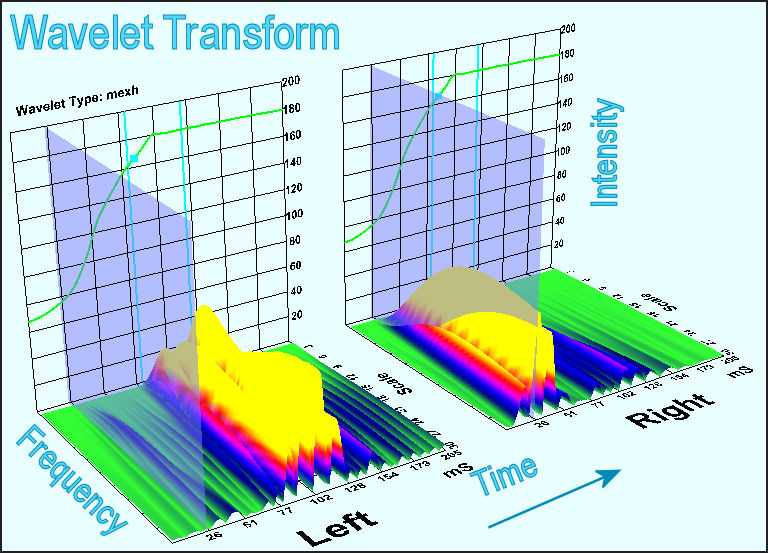
The process of listening to “TMJ noises” has a long history and has developed differing opinions as to its usefulness in the published literature. Pöllmann auscultated large groups of “healthy” individuals and found that 20% reported an awareness of TMJ noises, while 10 % could be detected by examination.13 Thus “healthy,” which may be indicative of no report of complaints, does not exclude the TMJ noises that are associated with internal derangements. Oster et al correlated TMJ sounds with arthographic images and provided an early indication that; “Sound patterns may provide a noninvasive tool for diagnosis and treatment.”14 Hashimoto et al pointed out that it is not easy to determine the originating side of a TMJ clicking sound.15 See Figure 1. They recognized the critical requirement of recording both TMJs simultaneously and relying on the timing to determine which is the originating side. Subsequently, they measured the time delay between the originating side and the contralateral side and found it within a range of 0.32 to 3.22 milliseconds.16 This is a very short time period that is impossible to detect by palpation or auscultation. Widmalm et al more recently confirmed this relationship as well.17

Creagh et al used the Fast Fourier Transform (FFT) to begin to evaluate different frequencies associated with different sound producing events.18 They documented that some sounds were dominated by lower frequencies (disk mobility) and others by higher frequencies (degenerative changes). Likewise, Freesmeyer et al also used spectral analysis to conclude that; “The frequency spectrum of normal movements is clearly different from those observed for clicking.”19 Yashiro et al reported that repetitively recording the same sound on different days from 30 subjects produced a very consistent result in terms of the characteristics of each sound such as the peak frequency and the power spectrum.20
There have been a number of clinical studies that have produced poor results when TMJ external palpation, auditory canal palpation and stethoscope auscultation have been tested. Hardison & Okeson compared these three methods and they found that each method produced many false positive and/or false negative results.21 Ishigaki et al found that both the patient’s perception of TMJ sounds and a doctor’s interpretation of TMJ sounds were unacceptably low in sensitivity.22 Dworkin et al also found auscultation and palpation to be inadequate for accurately analyzing TMJ sounds and concluded that the results are too variable to be a reliable indication of TMJ condition.23 In spite of that conclusion, Dworkin et al proposed the Research Diagnostic Criteria for Temporomandibular Disorders (RDC/TMD) with a physical Axis I that relied solely on those same clinical techniques in their attempt to diagnose TMJ Internal derangements.24 After nearly 2 decades of testing, the final published conclusion with respect to the validity of the Axis I of the RDC/TMD was; “Target sensitivity and specificity were not observed for any of the eight RDC/TMD diagnoses.”25
The Alternative of Joint Vibration Analysis
Joint Vibration Analysis of dysfunctional subjects’ TMJ vibrations (whether audible or inaudible) requires the objective measurement of emitted TMJ vibrations with precisely calibrated accelerometers that are referenced to a group of control subjects. Ishigaki et al published a series of studies comparing JVA measurements to MRIs and Arthrograms.26–29 They established the sensitivities and specificities for just the analysis of the vibrations in a vacuum (no other data). In an actual practice situation, the sensitivities are much higher when JVA is combined with the patient’s history, ROM and clinical examination results, which is what is done in a clinical practice.
In certain situations, such as when both TMJs are producing vibrations, the application of a Wavelet Transform provides a superior indication of which vibration is originating from which TMJ and the amount of transfer.30 See Figure 1.
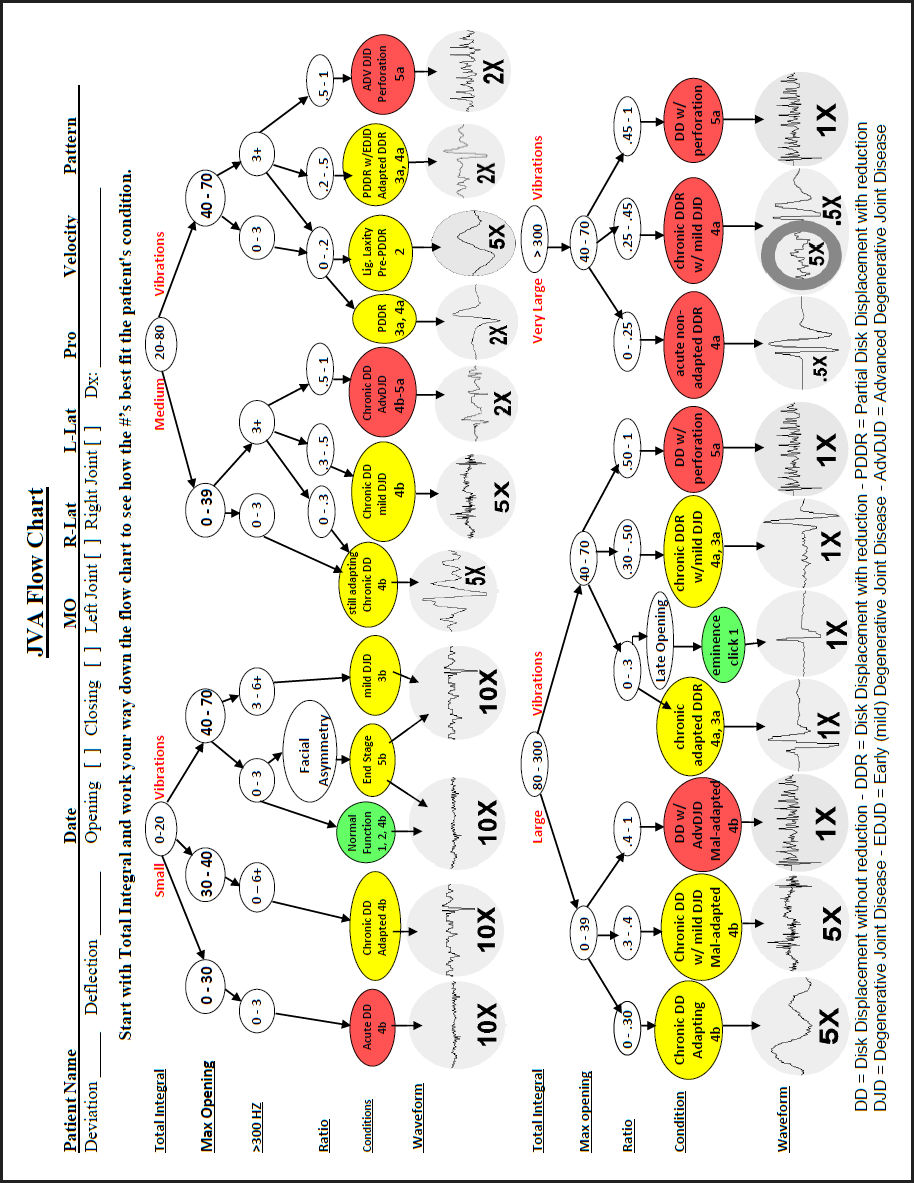
In an apparently futile application of computer technology, an Artificial Neural Network was trained to recognize internal derangements directly from MRI validated JVA data recorded simultaneously with incisor-point motion.31 This application was initially futile because the FDA ruled in 1998 that the Artificial Neural Network could never be commercialized as part of the BioPAK Software Program (BioResearch Associates, Inc. Milwaukee, WI USA). However, from that experience new information was provided as to which specific parameters are the most important for recognizing each specific TMJ condition. This eventually led to the development of the JVA Flow Chart, an aid to understanding the significance of specific vibration parameters. JVA Flow Chart is in Appendix.
The Main Vibration Parameters
-
Total Integral: The area under the mean FFT frequency distribution; the total of the pressure waves over time in KiloPascalHertz (KPaHz)
-
Range of Motion: The incisal distance from centric occlusion to the maximum open position (mm)
-
Integral > 300 Hz: The portion of the Total Integral due to frequencies above 300 Hz, mainly due to roughened surfaces (KPaHz)
-
Ratio >300Hz/<300Hz: A ratio of the 2 integrals of the two separate ranges of frequencies (no units)
Secondary Parameters (for subtle differences)
-
Integral < 300 Hz: The portion of the Total Integral due to frequencies below 300 Hz, mainly due to disk movements (KPaHz)
-
Peak Amplitude : The mean peak amplitude in Pascals (Newtons/meter2) of the frequency with the most intensity (Pa); The mean intensity of the Peak Frequency.
-
Peak Frequency: The frequency with highest amplitude of all of the measured frequencies (Hz)
-
Median Frequency: The frequency at the mid-point of the entire range of frequencies such that half of the total energy is above and half is below it (Hz)
-
Velocity: The speed of the incisor-point recorded with a jaw tracker (or metronome w/o jaw tracker) at the onset of the vibration (mm/second)
-
Distance to CO: The 3D distance from the position at the onset of vibration to Centric Occlusion (mm)
-
Lateral Deflection: The distance from the incisors to the mid-sagittal plane at the maximum open position (mm)
Total Integral
The total Integral is calculated as the area under the mean FFT distribution of all marked vibrations (1 to 6 vibrations). It is the mean summation of all of the intensities at every frequency recorded and can be understood as a loudness parameter. This parameter is used to divide the spectrum of TMJ vibrations into four subsets of small, medium, large and very large intensity vibrations. See JVA Flow Chart in the Appendix. Acute Disk Displacement with Reduction (DDR) produces the very largest vibrations. As the DDR becomes more chronic the Total Integral decreases from very large to large so the value of the Total Integral is a good indication of the relative chronicity and degree of adaptation of a Piper 4a disk displacement with reduction condition. Piper 4b conditions fall in the small category when acute or well adapted, but into the medium category when adapting. In total there are more than twenty distinct possible categories related to the status of the TMJ. Those conditions where an intervention is usually advised to improve the function are indicated in red in the JVA Flow Chart. Those indicated as yellow may or may not need any intervention depending on the adaptation, signs and other data available. Only the Green conditions are totally secure.
Range of Motion
The Range of Motion to the maximum open position (ROM) is very important to detect non-reducing displaced disks. With an acute closed-lock (disk displacement without reduction) the TMJ is very tight and produces very little vibration, just like a perfectly normal TMJ. However, the ROM is typically limited to something less than 30 mm. Over time the ROM gradually increases as the disk is pushed further forward and eventually reaches 35 to 40 mm in females and a few millimeters more in some males. Thus, after the selection of the subgroup, (small to very large), the ROM is the next consideration. Although elevator muscle trismus can also be a ROM limiting etiology, it can usually be differentiated from the history and from clinical data.
> 300 Hz Integral
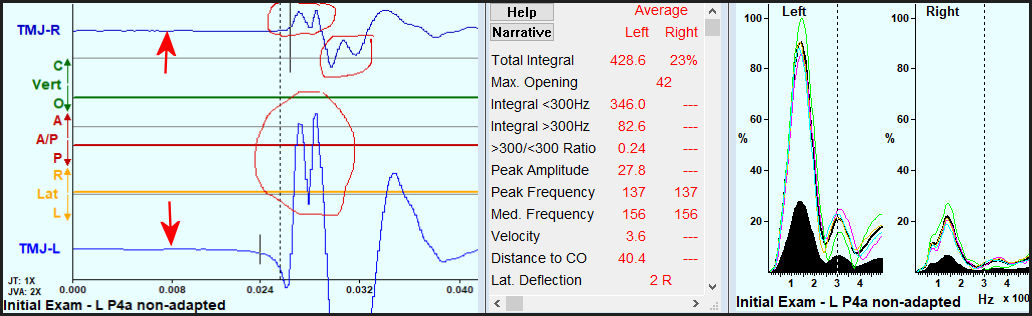
The Integral of the frequencies above 300 Hz is primarily related to the relative roughness of the sliding surfaces within the TMJ. However, it is used with small and medium intensity vibrations only because large and very large vibrations also include harmonic content above 300 Hz. Harmonics are created by a sharp impact, such as the disk snapping back onto the condyle when the undistorted shape of the disk still fits it well. Over time a chronic DDR usually distorts the disk to the point where it no longer fits the shape of the condyle and the reduction vibration becomes a dull thud without substantial harmonic content. Figure 2 is an example of a long-term chronic Piper 4a condition when the reduction is “soft,” where the Total Integral is only 81 and the > 300 Hz Integral is only 2.0. In contrast Figure 5 is from a relatively acute disk displacement with reduction with the left TMJ emitting a vibration with a Total Integral of 428.6 and a > 300 Hz Integral of 82.6, but without degeneration.

Ratio > 300 Hz / < 300 Hz
By using the Ratio instead of the > 300 Hz Integral, a natural compensation for the increasing harmonic content occurs. As the intensity of the vibration increases (with acuteness) the harmonic content also increases, but both the > 300 Hz and the < 300 Hz contributions increase together keeping the Ratio relatively constant. This avoids overestimating any degenerative changes with large and very large vibrations. In the acute DDR of Figure 5, the Ratio is only 0.24 even though the > 300 Hz Integral is very high at 82.6. However, the Ratio is not considered with small vibrations because background electrical noise can increase the Ratio as an artifact.
Secondary parameters
Integral < 300 Hz
The Integral < 300 Hz represents the vibrations caused by abnormal disk motion. It is most useful as the denominator in the Ratio rather than by itself. When it is close to the Total Integral, it means that the vibration is caused just by abnormal movements of the disk and not by any other degenerative changes within the TMJ. Medium amplitude vibrations in closing where most of the energy is < 300 Hz are due to a loose capsule that allows the disk to wobble as the condyle returns into the fossa. This condition is a Piper 2 and is often the precursor stage to a Piper 3a. This stage is usually not observable in an MR Image or CBCT image.
Peak Amplitude
Values greater the 6.0 or so are usually audible to the patient with normal hearing. When patients report hearing noise in their TMJs and the peak amplitude is well below 6.0, it is most likely a crepitus, because higher frequencies above 300 Hz are more audible than those below 300 Hz.
Peak Frequency
When analyzing mostly < 300 Hz frequency distributions of disk movement vibrations, a lower Peak Frequency is indicative of a longer-term chronicity. As a general rule, the longer the condition of DDR, the lower the peak frequency.
Median Frequency
The median frequency can suggest the chronicity of the condition by its lowness. However, if the median frequency is far above the peak frequency, it is likely that some type of active degenerative condition exists.
Velocity
This parameter is only measured when an incisor-point tracker is used in conjunction with JVA. The velocity of opening and closing has an effect upon the overall intensity of any existing vibrations. The metronome is used to establish a standardized velocity as the patient follows it for reference. If the patient deviates dramatically from the pacing velocity, the intensity of the recorded vibration can be either higher or lower than it should be. This is only a problem when a patient is so dysfunctional that he/she is unable to follow the metronome. If the opening or closing movements are very slow the vibration intensity will be underestimated, if the movements are substantially too fast the intensity will be overestimated.
Distance to C. O.
The distance to C. O. (MIP) is recorded only with the incisor-point tracking. Primarily, it provides an indication of an early reduction, mid-opening reduction or a late-opening reduction of a displaced disk and whether the position is consistent. One example of the value of this distance measurement is that a consistent early reduction in a relatively acute case is more likely recapturable than an inconsistent late reduction. While recapture of a reducing displaced disk is never assured, it is a goal that many practitioners appreciate and attempt to accomplish.
Lateral Deflection at max opening
A lateral deflection is caused by the contralateral condyle translating further than the limited ipsilateral condyle. This can occur dramatically with a unilateral DD or less dramatically in bilateral DD with one TMJ better adapted. A small contralateral deflection can be present if a Piper 2 ipsilateral capsule is just loosened due to some partially stretched ligaments. This condition coincides with low frequency vibrations at medium intensity recorded by the < 300 Hz Integral (disk movement) during closing because the disk-condyle tension is less during closing.
How does JVA exceed auscultation and palpation of the TMJ?
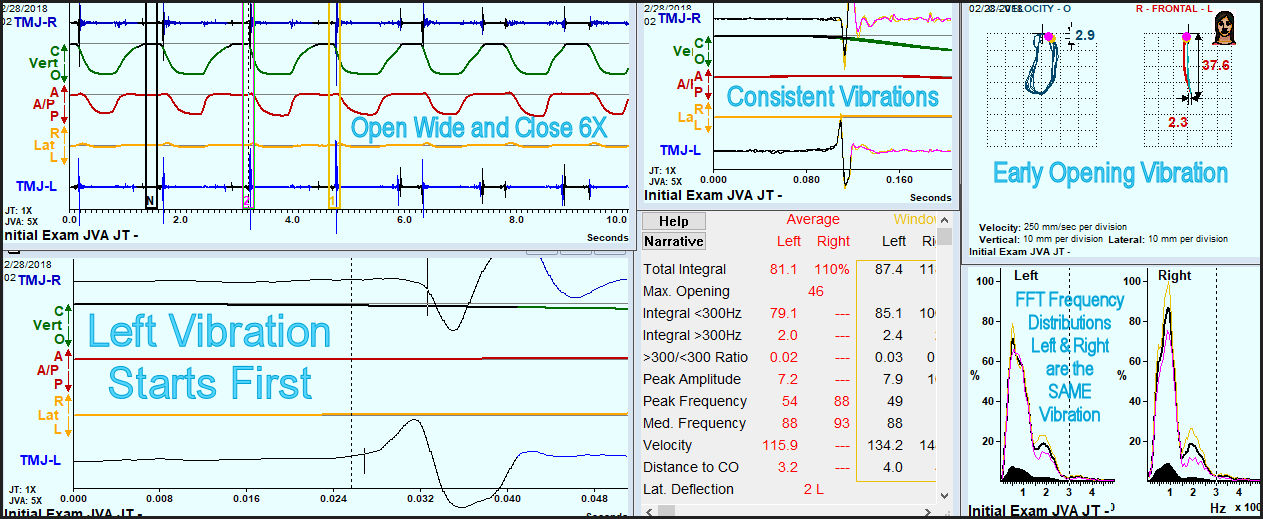
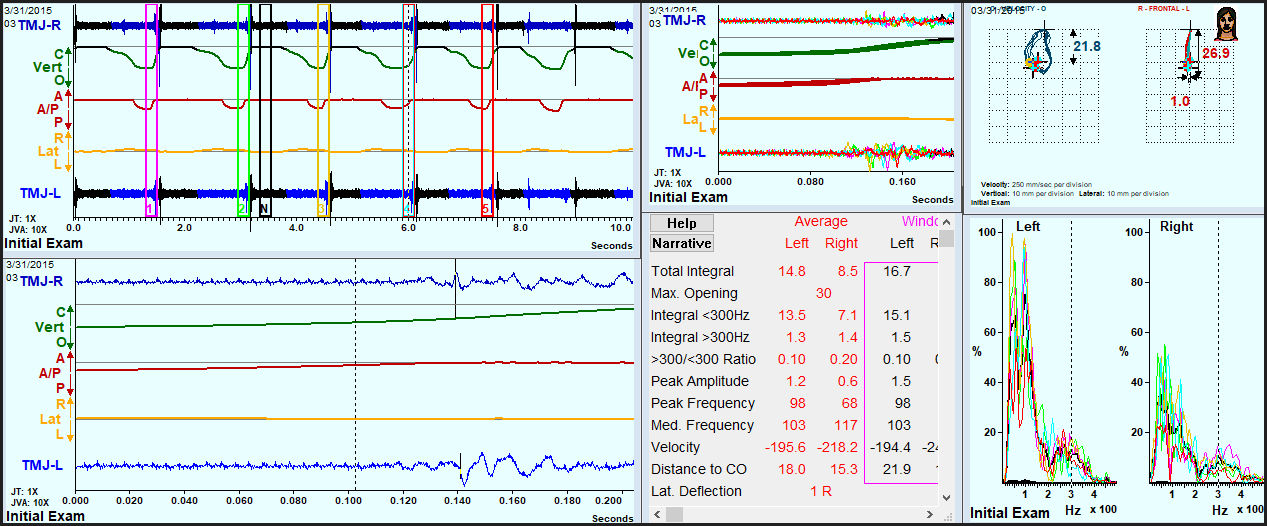
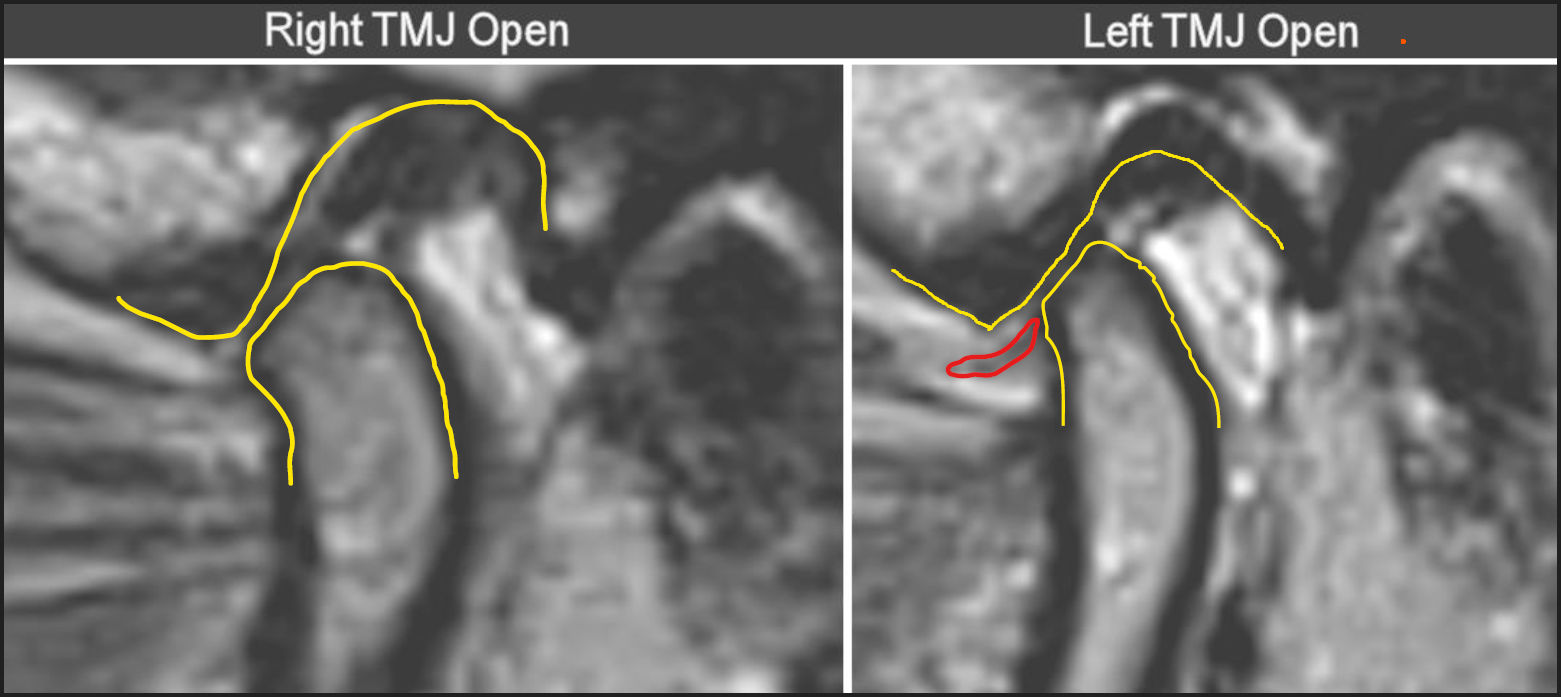
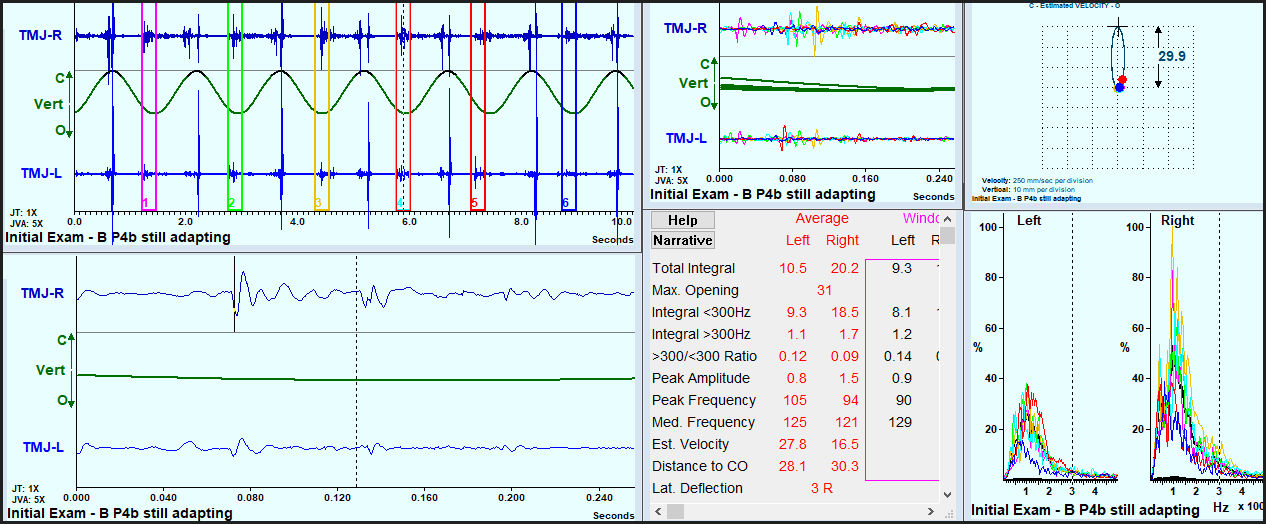
Figure 2 is a JVA example from a patient with a chronic left TMJ displaced disk that is reducing (DDR). Both TMJs show large vibrations at a Total Integral of 81.1 KPaHz. Palpation detected bilateral “clicking,” suggestive of Piper 4a disk displacements with reduction in both TMJs.
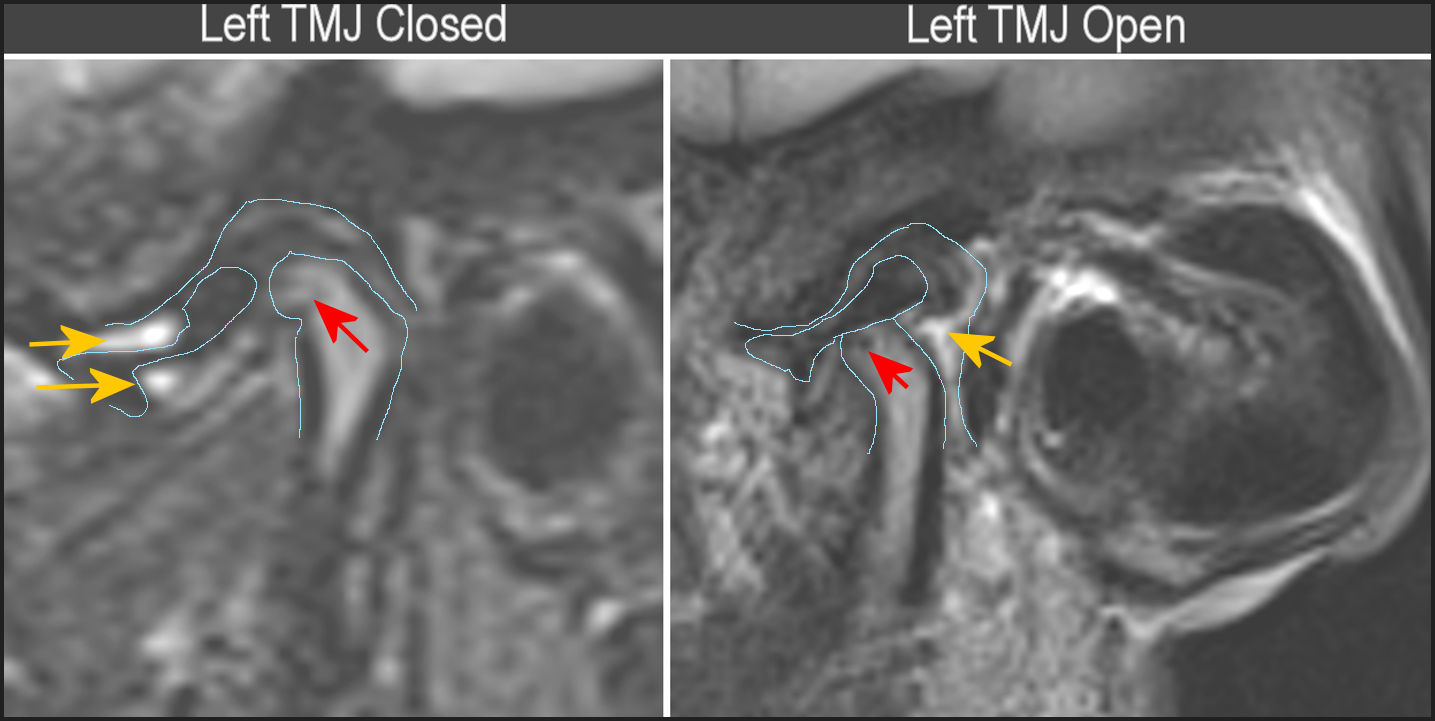
Figure 3 shows central section MRIs of left TMJ of patient in Figure 1 in closed position and open position. The disk appears to be anteriorly displaced and distorted in the closed view and reduced in the open view. The red arrows point to a possible subchondral cyst, the yellow arrows to effusion. A coronal view might have revealed the medial component to the displacement also present (not available).
_in_closed_position_and_o.jpg)
But the intensities of the vibrations, the timing of the vibrations and the mirror image relationship between sides in the JVA ZOOM view, indicated a left reducing chronic medial disk displacement, but a normal right TMJ. Why is that?
-
The left vibration starts 6 milliseconds before the right vibration. The originating side always starts first and a transferred vibration is delayed.
-
The contralateral equal intensity, mirror image vibration means that it has been transferred from the opposite side.
-
The large early opening vibration with only 1 cycle and 81.1 KPaHz intensity is very typical of chronic DDR conditions.
-
The patterns of the frequency distributions (FFT Window) are the same from both joints (meaning both are the same left TMJ vibration).
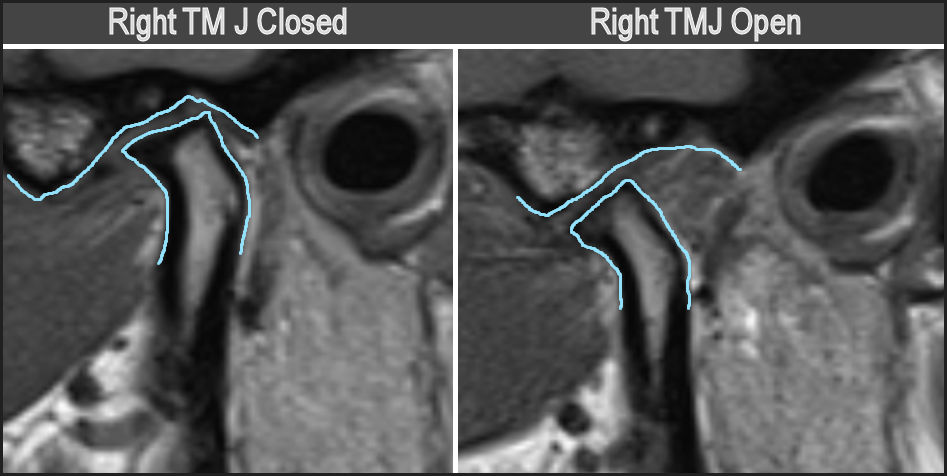
When palpating the TMJ and finding an indication of a disk internal derangement it is often considered necessary to obtain an MRI as the so-called “Gold Standard.” Figure 3. In this case, the MRI confirms the status of the left TMJ disk as being displaced, but it is not as clear whether it fully reduces or not. However, both the MRI and the JVA detected that the left TMJ is damaged (not normal), but the right TMJ is not damaged. Note that the condyle is distal in the closed position, sometimes considered an indication of DD or DDR, but not always a very reliable one.32 It is very convenient and cost effective to have the JVA right in the practice for a quick indication of TM joint function. A normal range of motion (40 to 60 mm for females, 45 to 65 mm for males) and bilaterally quiet TMJs = normal function. A normal range of motion with noise or a limited ROM with or without noise = damaged TMJ.
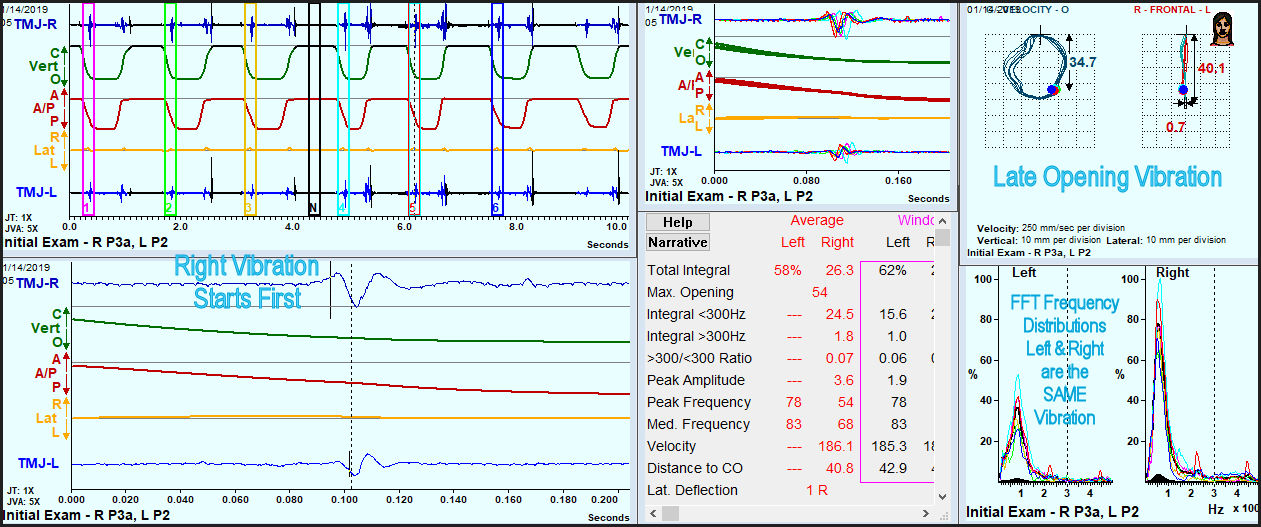
A partial disk displacement with reduction (Piper 3a)
Figure 4 is a minimal internal derangement referred to as a partial disk displacement with reduction (PDDR, Piper 3a). As is typical, the disk slips off of the lateral pole during closure and the reduces during opening. This produces a single vibration in the ipsilateral TMJ with a nominal 50 percent transfer to the contralateral side because the disk rotates antero-medially when it displaces, postero-laterally when it reduces.33 This small partial disk displacement may or may not be palpated or interpreted successfully and can be easily missed within MR images, depending on how thoroughly the images are reviewed. But, if the reviewer is already aware of a JVA record that indicates the presence of a 3a condition, he/she can look for it and usually find it.
_condition_in_the_right_tmj._as_is_typi.jpg)
Acute disk displacements with reduction (Piper 4a) produces the huge very audible vibration in Figure 5
Figure 5 is a record of a Total Integral on the left at 428.6 KPaHz. This is single “click” is audible across the room and typical of a relatively acute condition. A careful look at the waveforms indicates that both TMJs are vibrating and passing energy to the opposite side. The portion circled in red shows change of direction (+ & -) without crossing the zero level. This is only possible with transfer from the opposite side. While the Right vibration is much smaller than the left one, it is still large enough to be a reduction, just a more chronic one. The FFT distributions in this patient are not the same, which also indicates that both TMJs are vibrating.
__a_very_loud__click__aud.jpg)
In Figure 6 the disk displacement with reduction in the left TMJ is very clear. Although not as obvious, the right TMJ also appears to have a reducing disk displacement. JVA is a complementary technology to MRI, not a competing one. It can give a heads-up to the reviewer of MR images as to what to look for. This can be especially helpful to medical radiologists that are not usually as well trained to read TMJ images as for other joint images. Of course, there are many other indications that can also be obtained from MR images such as effusion, inflammation and growth deformities. JVA’s value is to detect damages that benefit from MRIs.
_above._left_condyle_is_more_distal_in_c.jpg)
Long-term chronic disk displacement without reduction (Piper 4b)
In the case of the long-term chronic internal derangement, the disks are often permanently displaced bilaterally (DD). Clinically, the TMJs may be quiet if the condition is acute or if both TMJs have successfully adapted, but the range of motion (ROM) will be restricted. When JVA is used to record the TMJ vibrations, a measured ROM in the 20 – 30 mm range is indicative of a relatively acute Piper 4b or closed lock condition. See Figure 7. An acute DD is usually very quiet and initially painful. Over time the disk is pushed further forward and the intensity of vibrations increases, but the pain usually subsides due to denervation of the vascular posterior attachment tissue that is caught in between the condyle and the eminence.

It is a case by case decision as to whether MR imaging is warranted for the patient with an acute closed lock. The immediate objective is to unlock the TMJ, by reducing the disk and maintaining it non-displaced. The key factors in acute DD are the limited ROM and returning the patient to a normal range of motion. The alternative condition that can limit the ROM is muscle trismus, seen after 3rd molar extractions or other jaw traumas and associated with pain and effusion of the elevator muscles. Muscle trismus may be differentiated from acute closed lock by the history and clinical examination. Trismus can be differentially relieved when ULF-TENS is applied directly to the 5th cranial nerve.
Chronic adapted or adapting Piper 4b
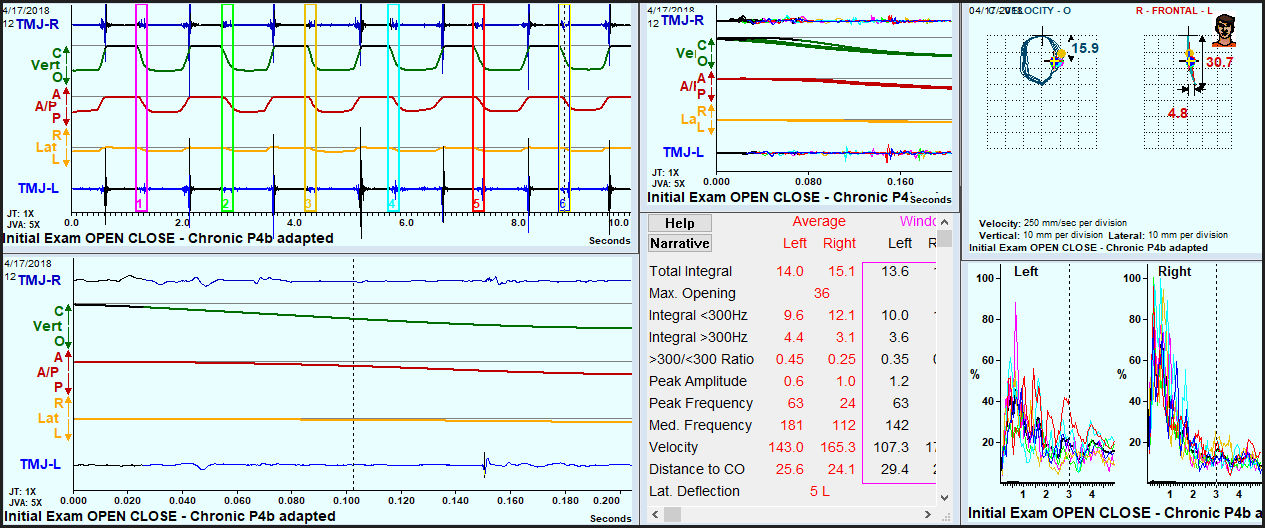
Chronic adapted or adapting Piper 4b conditions usually exhibit a ROM between 30 – 40 mm, produce disk movement vibrations until fully adapted and are usually painless. Any significant vibrations present can be assessed by the range of the frequency distribution. A high Integral of frequencies > 300 Hz, high values of the peak frequency and/or a high median frequency generally indicate a degenerative process. The higher the values of these parameters, the more likely that a degenerative process is occurring and the worse the prognosis.34 See Figure 8.

NOTE: All data presented here has been retrieved from existing diagnostic records of patients within Medica Odontologica Craneo Mandibular A. C., Guadalajara, JAL, Mexico and presented here anonymously. Although every patient is a unique entity, these examples are typical of what is routinely seen every day in this clinic.
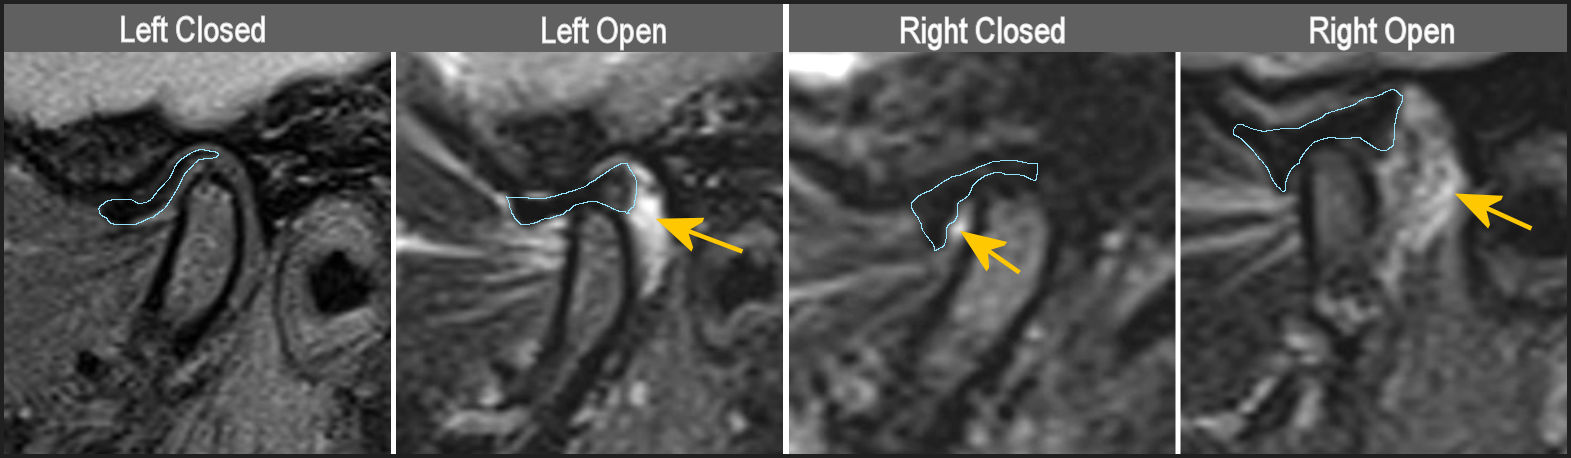
The MRIs on the same patient reveal that there is still some soft tissue between the condyle and the eminence, which also implies successful adaptation, but does not reveal anything about dynamic function. Figure 9. The JVA indicates a ROM of 36 mm and both TMJs are relatively quiet, an indication of successful adaptation. The MRIs do confirm that both of the disks are permanently displaced and it appears that the right condyle is translating somewhat more than the left condyle. Figure 9. This condition is quantified by the JVA record revealing that the mandible deflects toward the left 5 mm at the widest opening. Both condyle shapes appear to have flattened surfaces facing towards the eminence. It usually takes years for a closed lock condition to fully adapt, even whenever the adaptation is ultimately successful. A ROM of 36 mm with a low intensity that includes minimal high frequencies is indicative of a condition that is well adapted and has not commenced a severe degenerative process. The MRI and JVA both suggest that successful adaptation has occurred.
__with_open_tmjs_showing_.jpg)
Adapted Piper 4b TMJs approaching end point
A 31 mm ROM and bilaterally quiet joints indicate the adaptation is either progressing well or has reached its end point in Figure 10. These vibrations are most likely only due to small movements of the capsule remnant as the condyle pushes it forward, but no indication is present here of significant roughening of the interface surfaces. Quiet TMJs with a stable ROM between 30 and 40 mm are usually good signs. Either there is a lack of degeneration or the degenerative process has reached a stable point. Both cases, with or without degenerative changes can represent positive indications of joint adaptation.

MRIs reveal changes in the morphology of the TMJs as permanent disk displacements progress, but cannot indicate the quality of the dynamic interface of the remaining tissues. In this case the condyle shape is very flattened with a “bird beak” appearance, which is often associated with advanced degenerative changes. See Figure 11. However, the relatively quiet JVA record with minimal high frequency content (normal values) indicates that the soft tissue interface is adapting rather well to the current situation and function has not been substantially reduced. Figure 10.

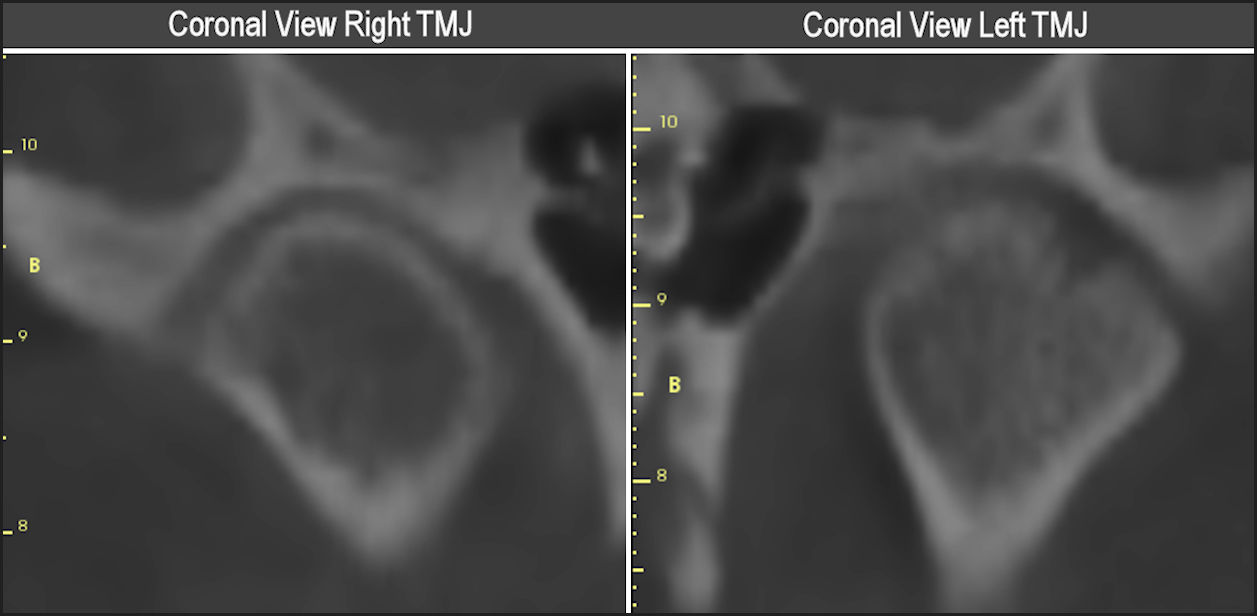
When the JVA record in Figure 12 indicates that some degenerative changes are present in the left TMJ based upon the increased value of the > 300 Hz Integral (6.6) compared to a normal value < 3.0, it may be preferable to obtain a CBCT image set rather than an MRI. In Figure 13 the loss of cortical bone may be damaging to the integrity of the TMJ long-term. The lateral condylar shift may have resulted in the degeneration visible. When there is an elevated > 300 Hz value or the Ratio is greater than 0.3, one can expect degenerative changes and/or joint instability.


Adaptation can be very good even though the Internal derangement does distort the structures. In some cases, the joint adapts to the displaced disk condition, adjusts to it perhaps by sclerosis and maintains a stable relationship.
The 34 mm ROM in the female patient record of Figure 14 represents a sixty-eight percent recovery of a mean normal ROM. The elevated > 300 Hz Integral values (6.6 left, 5.5 right) and ratios approaching 0.3 suggest an incomplete adaptation. Although active osteoarthritis must have been previously present (active inflammation), the current status looks more like an osteoarthrosis (damaged, but stable, not continuing to degrade). Figure 15.


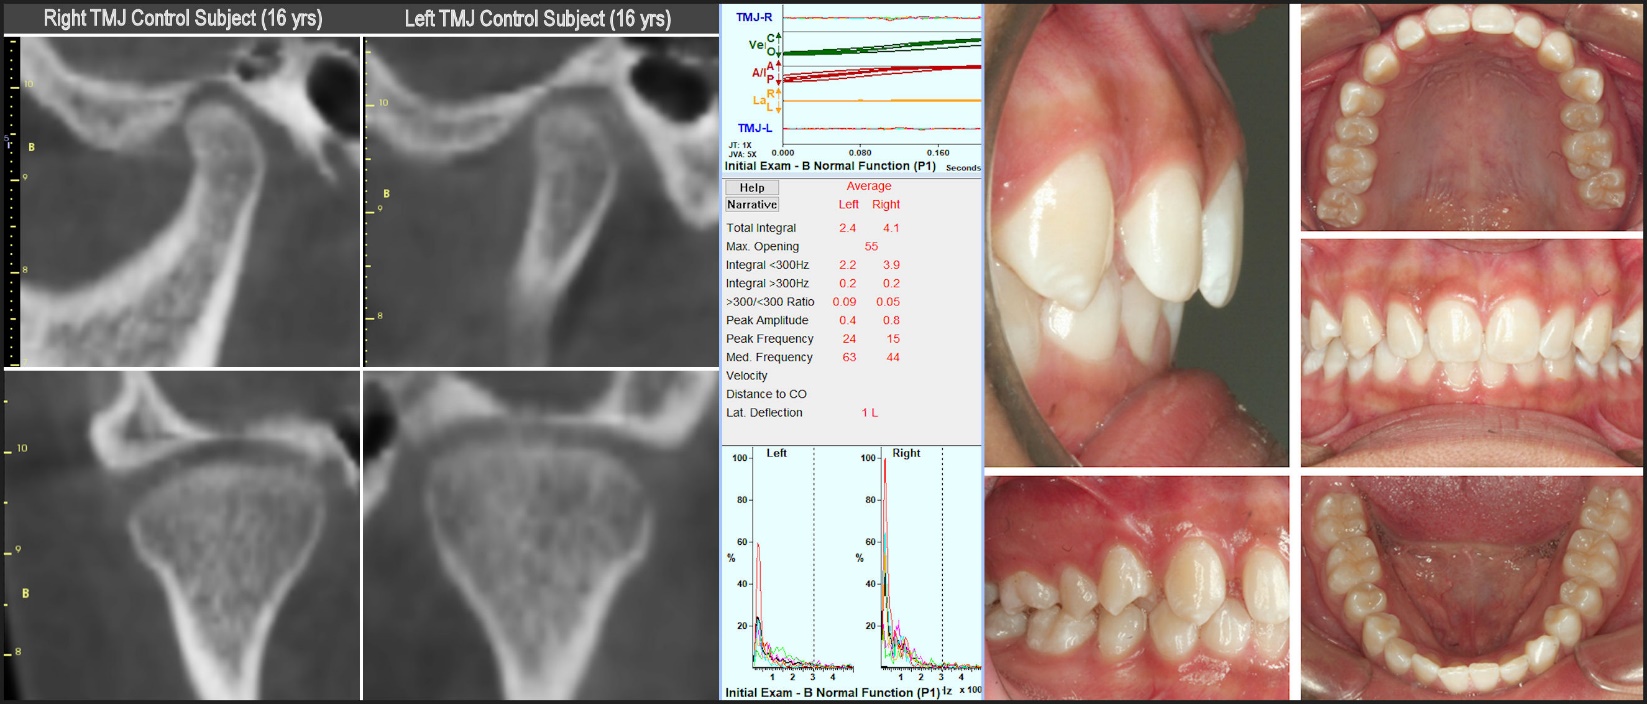
JVA often complements the information available from imaging, but more importantly, it provides an in-office, quick and easy record of every new patient’s starting point with respect to their TMJs, asymptomatic or not. JVA is far more sensitive to slight early roughening of the soft tissues at the onset of degeneration than any other technology.
Just for refence the CBCTs, JVA and occlusal views of a healthy subject are depicted in Figure 16.
_with_quiet_tmjs__55_m.jpeg)
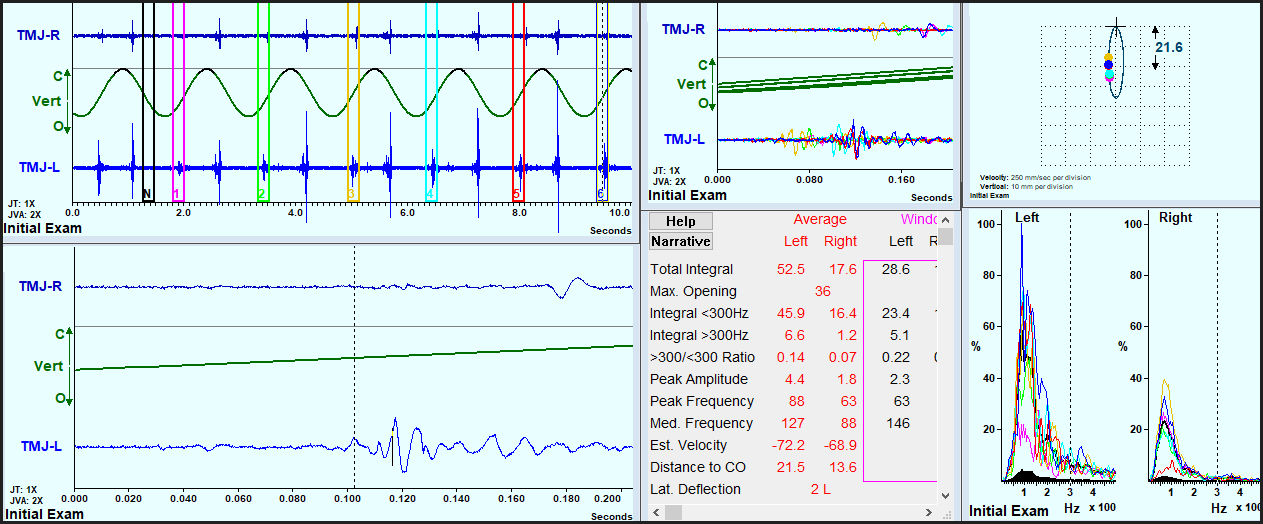
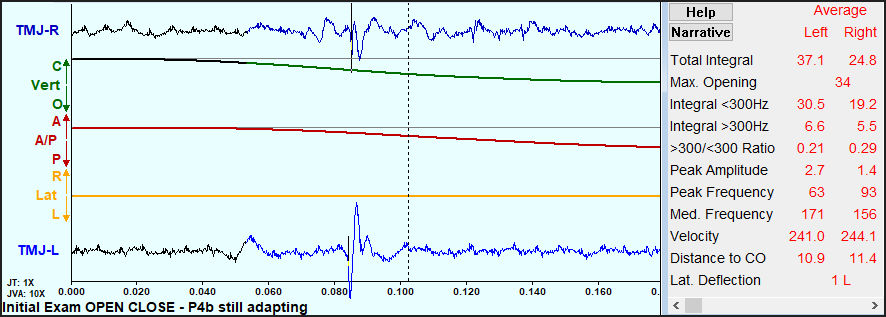
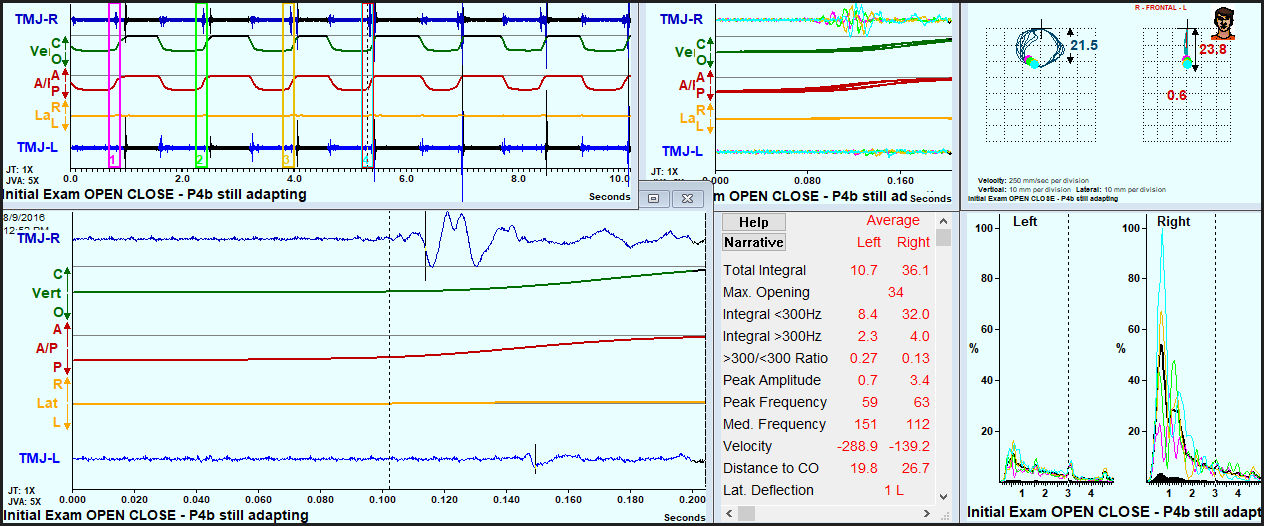
In Figure 17 a bilateral Piper 4b condition is recorded and documented as still adapting. Whenever a condition is still adapting it is subject to change over time. This can result in a long-term unstable condition such that any definitive dental treatment would be subject to change as well. The medium intensity vibration from the right TMJ indicates both disk movement (< 300 Hz Integral = 32.0) and low-level degenerative changes (> 300 Hz Integral = 4.0). In contrast the smaller vibration in the left TMJ appears more secure with less disk movement (< 300 Hz Integral = 8.4) and more of an arthrosis than an active arthritic condition (> 300 Hz Integral = 2.3). As the boney surfaces rub together over time sclerosis produces smooth eburnated bone as the TMJ approaches end-stage osteoarthrosis. In this bilateral Piper 4b the left TMJ has advanced further towards full adaptation, possibly because it was the first disk to displace. Stability can only be verified when there is no measured change over a period of time.

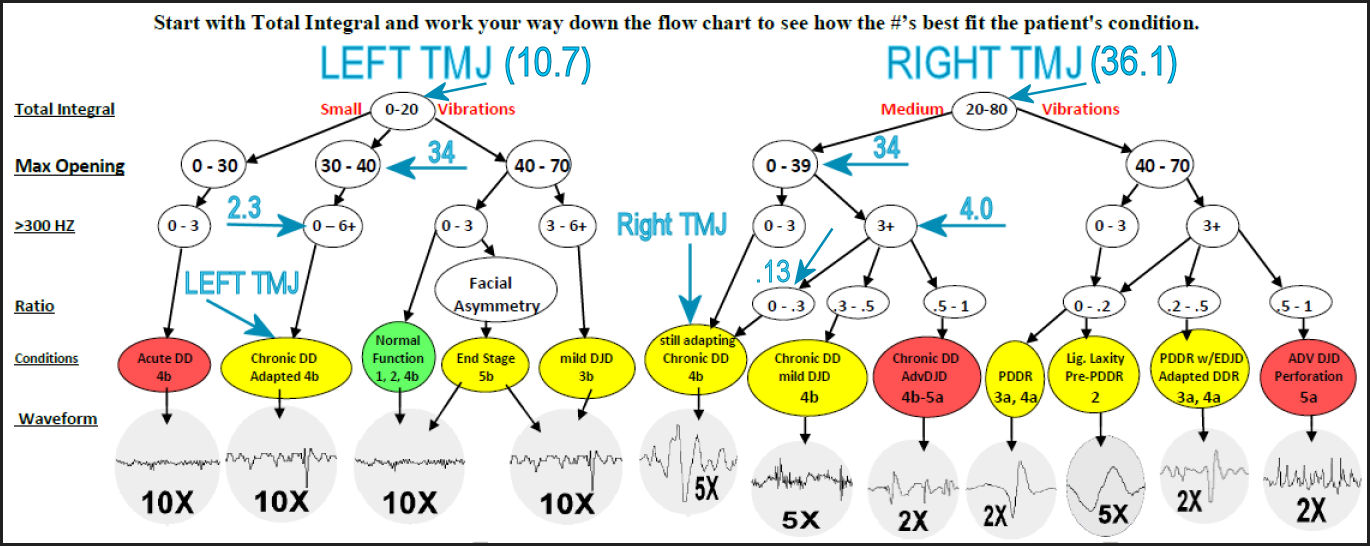
The values from the Summary Window of Figure 17 are plugged directly into the JVA Flow Chart in Figure 18.

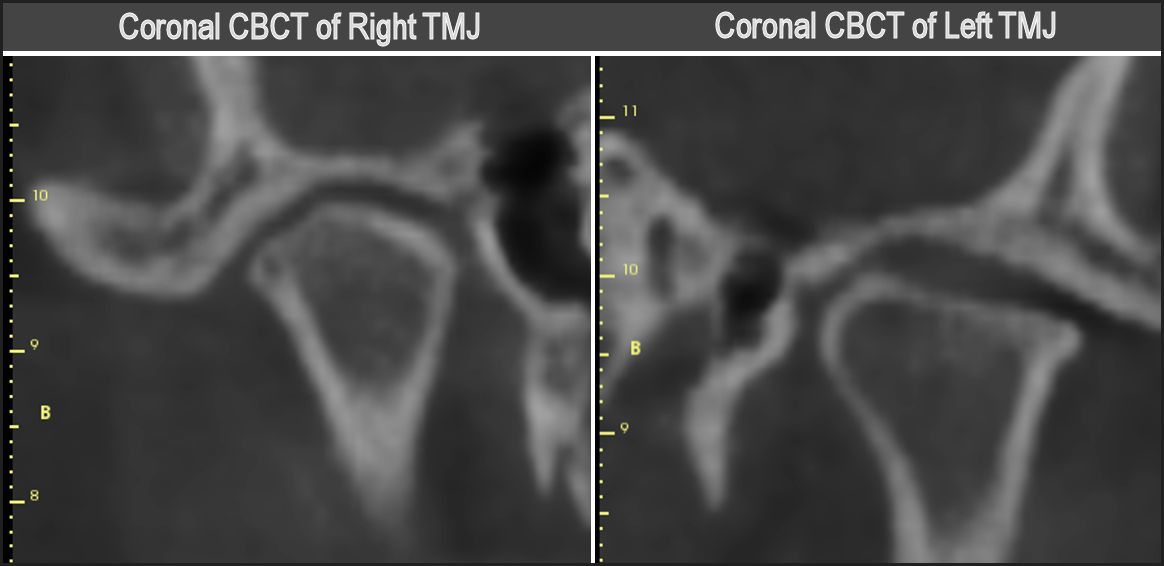
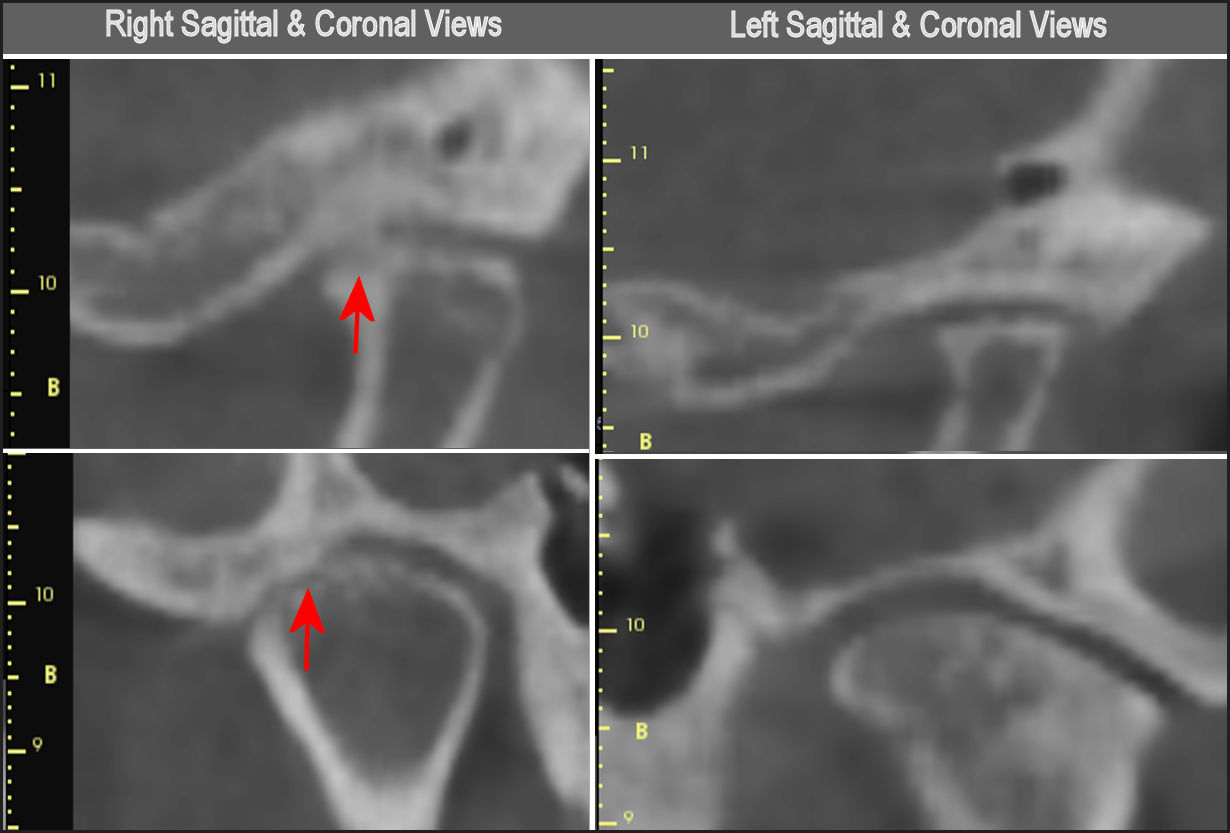
In Figure 19 chronic Piper 4b bilateral permanently displaced disks with evidence degenerative changes (58 yrs. F). Note the bilaterally elevated values for the > 300 Hz Integral (2.3 left, 4.0 right). These indications would suggest that a CBCT set of images could be valuable. In these images the left condyle appears to match the contour of its fossa hinting at the completion of adaptation, but the right condyle does not, suggesting it is still changing.

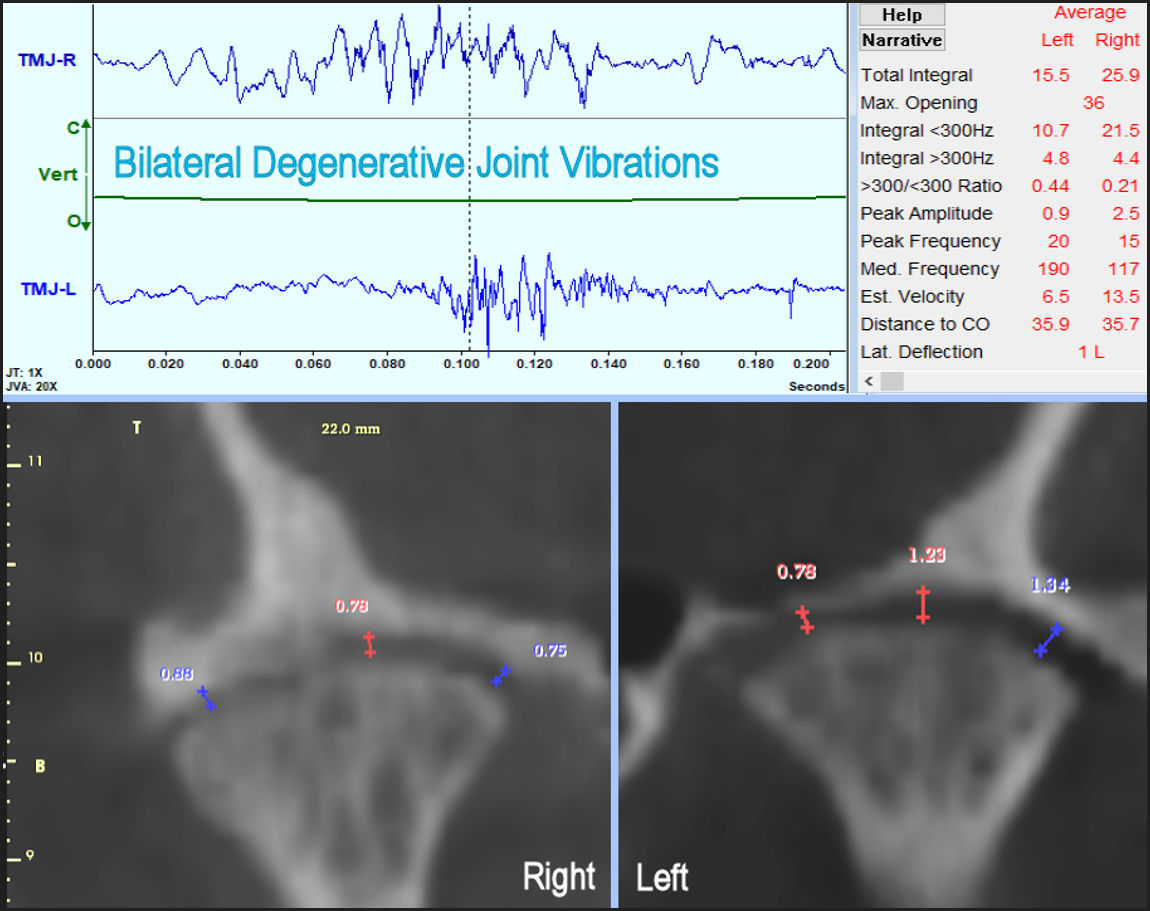
Degenerative joint disease (DJD) in the TMJ appears in the JVA record as long duration waveforms at relatively low intensity, but with an increase in the proportion of higher frequencies. DJD increases the value of the Integral > 300 Hz (above 3.0). DJD raises the ratio (above 0.3), depending on the amount of residual simultaneous disk movement. In Figure 20 the CBCT images appear to agree with the JVA assessment in Figure 19 of degenerative changes.

Limitations
Since every TMJ is unique, no two JVA records will ever be exactly the same. While certain parameters have general characteristics, there will always be a few exceptions. There is also some overlap between the four Intensity categories (small, medium, large and very large), which necessitates checking adjacent categories when the values appear near the defining numerical boundaries between categories. This can lead to two possible diagnoses, but typically they will tend to be very similar.
Summary
The advent of Magnetic Resonance Imaging (MRI) and Cone Beam Computed Tomography (CBCT) have made the evaluation of the temporomandibular joint (TMJ) far more definitive than the previous X-ray technologies. However, there is a still a large gap between what can be accomplished diagnostically in a clinical practice setting when compared to utilizing these sophisticated imaging technologies. While the history and clinical examination procedures reveal important information, too often they are inadequate to produce a definitive diagnosis of the TMJ status. On the other hand, it is not economically feasible to prescribe MRI and/or CBCT imaging for every new patient and there are no widely accepted “Indications for Imaging” currently in existence. Consequently, a need exists for a cost-effective bridge between the clinic procedures and MR imaging and/or CBCT.
Joint Vibration Analysis (JVA) is rapidly implemented, inexpensive to apply, can support a reliable tentative clinic diagnosis and point to the need (or not) for further inquiry with either CBCT or MRI. JVA has evolved over the past three decades using artificial intelligence and sophisticated mathematics into a reliable indicator of good TMJ function with a specificity of 98 % (a 2 % false positive rate). A false negative result only occurs when the TMJ is so well adapted that it is functioning like a normal TMJ and consequently, needs no therapy. These are the ideal characteristics of any screening tool, which may not be able to identify exactly the damage, but very rarely indicates a problem when none exists. In addition, JVA also provides timely information regarding the dynamic function of the TMJ that is not provided by any imaging technology.
Funding Statement
No funding was received from any source.
Conflict of Interest statement
John Radke is the Chairman of the Board of BioResearch Associates, Inc. He receives no commission based upon the sale of its products.
Acknowledgements
The authors wish to thank Oral and Maxillofacial Surgeon, Dr. Ed Zebovitz, of Bowie, MD for his teaching of MRI and CBCT interpretation at the Center for Neural Occlusion in Rogers, AR.
