


INTRODUCTION
Orthodontic treatment aims at improving both the aesthetic appearance of a patient, and the functional characteristics of the patient`s occlusion. There are several occlusal schemes which are considered ‘acceptable’ when studied in the general population: Canine-protected Occlusion, Group Function, and Balanced Occlusion. The latter is characterized by the presence of working and balancing interferences on both sides during lateral movements.1
Orthodontic treatment outcomes have been graded by two occlusal indexes. The Peer Assessment Rating (PAR)2 has eleven components, assessing buccal occlusion visually for the quality of the intercuspation. Introduced in 1998 by the American Board of Orthodontists, the Objective Grading System (OGS) has eight criteria,3 with one criterion assessing static occlusal contacts on hand-articulated casts. Efforts to classify and measure dynamic occlusion include Shimstock use to detect occlusal contacts at different distances from the intercuspal position out to the most lateral and protrusive positions.4 This method, along with visually observing articulating paper marks and wax bite records, depend upon an operator`s Subjective Interpretation.5–7
The concept of treating orthodontic patients to specific Gnathologic standards has been discussed in the literature and deemed unnecessary, alternatively suggesting that the Maximum Intercuspal Position (MIP) is the most appropriate musculo-skeletally balanced position for the patient.8 Some authors suggest that it is not valuable to prolong treatment time for the patient to attempt to create a shorter RCP-MIP slide.9 The same study suggested that Group Function was acceptable.9 Alternatively, a study by Haralur and coauthors suggested that an RCP-MIP slide of more than 2 mm had a significant association with TMD symptoms.10
The prevailing idea of finishing orthodontic treatment with the maximum number of contacts in static occlusion (MIP) raises the question, are the contacts marked with articulating paper considered ‘favorable’ and advantageous for the patient? A study conducted by Lepley has shown that higher forces tend to occur in the larger contact and near contact areas,11 and that higher forces are associated with fewer discrepancies in marginal ridge positions and interproximal contact positions, when assessed by the OGS criteria.3 But do these findings indicate that a better orthodontic alignment results in better masticatory performance? Or, do the higher forces ‘hide’ within the larger contact or near contact areas? Lepley and coauthors found the highest forces were responsible for supporting the Vertical Dimension of Occlusion (VDO), indicating that the orthodontically treated occlusion contains contact areas with differing occlusal force levels. T-Scan data measures 256 differing force levels as they change across time,12 clearly illustrating the sequence of rising forces, and which teeth experience more applied force over longer periods of time.
Modern articulating paper studies revealed that articulating paper markings are not reliable indicators of differing occlusal force levels.5,6,13,14 However, emerging evidence indicates that the T-Scan 10 Computerized Occlusal Analysis System (Tekscan, Inc. S. Boston, MA, USA) is a reliable alternative method of making an occlusal assessment.15 T-Scan timing data sets have been correlated to several occlusal index parameters.16 Lee and Lee showed a statistically significant correlation existed between the PAR and OGS indexes and the Occlusion Time (OT), which assesses the quality of the occlusal simultaneity. The better the index (lower PAR; higher OGS), the shorter duration was the OT, indicating the better the occlusion was at the end of orthodontic treatment, the shorter was the OT. Also determined was the larger the overjet (assessed by the PAR), the longer was the OT.16 Of note was that OGS had nearly twice as many measured parameters statistically correlated with the T-Scan III system measurements, than did the PAR index.16
Qadeer and Yang compared closure occlusal force parameters in non-orthodontic and in post-orthodontic patients. They found statistically significant differences in the distribution of forces existed between the non-orthodontic and post-orthodontic groups.17 Further, the orthodontically treated subject’s posterior quadrants had significantly more contact areas than did the anterior quadrants. And 2nd molars in both the non-orthodontic and post-orthodontic subjects received greater occlusal forces than all other teeth.17
In another study by Qadeer and Abbas,18 excursive occlusal force and timing parameters were measured in both non-orthodontic and post-orthodontic patients:
-
The Disclusion Time (DT, which assesses the duration of occlusal surface friction present in a lateral excursive movement)
-
The presence of working and non-working side interferences
-
The Occlusal Scheme (canine guidance, group function, balanced occlusion)
-
The presence of TMD signs and symptoms
Their Results found statistically significant differences in the DT between the 2 groups, with the post-orthodontic group having twice the duration of DT compared to the non-orthodontic group. But the presence of working side interferences was higher in the non-orthodontic group (72% on the working side; 27% on the balancing side), whereas in the post-orthodontic group, a more equal distribution of working to non-working side interferences was found (54% - 46%, respectively).
The percentage of differing Occlusal Schemes in the non-orthodontic group were:
-
4% anterior guidance
-
60% canine guidance
-
36% group function
In the post-orthodontic group, the percentage of differing Occlusal Schemes were:
-
4% anterior guidance
-
24% canine guidance
-
72% group function
Importantly, 72% of subjects in the post-orthodontic group presented with one or more TMD signs/symptoms, while only 32% of non-orthodontic subjects presented with one or more TMD signs/symptoms.18 The authors explained the higher DT in the post-orthodontic subjects resulted from orthodontic treatment creating a much better posterior interdigitation, which lead to more working and balancing posterior interferences in lateral movements.
These findings suggest that the orthodontic treatment created fewer working interferences, but increased the percentage of balancing interferences, and that the post-orthodontic group had a higher prevalence of TMD signs and symptoms. The inference can be made that group function and non-working contacts combined are associated with TMD signs/symptoms, as group function and non-working contacts are both known major components of prolonged Disclusion Time.7 These recent findings are contrary to the frequently advocated opinion that there lacks an association between occlusion and TMD. However, that flawed conclusion was made in studies where the occlusion was assessed with articulating paper markings alone.1,9,19
Studies by Cohen-Levy and Cohen determined that during the Retention Phase following lingual orthodontic treatment, repeated T-Scan measurements of the static occlusion made over a 2-year period of observation, reflected a general improvement in the right side-left side occlusal balance. However, some cases maintained a persistent, uneven distribution of the occlusal contacts between the right and left sides of the arch.20,21
Based upon existing, modern measured occlusion orthodontic evidence,17,18,20,21 the Specific Aims of this manuscript are to demonstrate the rationale for the use of T-Scan digital occlusion analysis at different stages of orthodontic treatment.
Suggested T-Scan Implementation Points During Orthodontic Treatment
Initial assessment - Collection of baseline occlusal force and timing data prior to orthodontic intervention.
Active Treatment Appointments - T-Scan data can be used to guide elastic application and wire adjustments in:
-
Non-extraction cases
-
Extraction cases
-
Distalization cases
Prior to Debonding of Fixed appliances - T-Scan data can be used to guide the:
-
Final adjustments to correct mandibular position
-
Final adjustments to improve teeth interdigitation and functional movements.
Retention Phase and Follow-up appointments - T-Scan data can be used to assess occlusal stability over multiple post treatment visits.
Stability and Relapse - T-Scan data can be used to guide the initiation of relapse intervention.
Use of Fixed Retainers on Both Arches - T-Scan data can be used to guide occlusal adjustments made to retainers.
\
- Initial Orthodontic Assessment
The prevalence of clinical signs of Temporomandibular Disorders (TMD) in non-patient populations have been reported in a few epidemiological studies,22,23 as being higher than the prevalence of symptoms reported by actual TMD patients. This indicates the importance of making an objective diagnosis of Temporomandibular Disorders (TMD) before the start of any dental intervention.
In one study, neither the type of malocclusion, nor the presence of occlusal interferences within the functional movements, were shown to have a clear association with the presence of TMD.19 Somewhat older studies that compared TMD prevalence in orthodontically treated to non-treated individuals, reported no TMJ signs/symptoms differences between treated and non-treated individuals.24–26 The above mentioned studies employed the Helkimo index,27 where the presence of jaw pain in both the static occlusal position and in lateral movements was one of the clinical signs of TMD. This group of studies suggest there is equal prevalence of TMD in orthodontically treated and non-treated subjects. One of these papers found that in non-orthodontic patient populations, the frequency and severity of Temporomandibular Disorders (TMD) signs and symptoms tended to increase, beginning in the second decade of life.25 Therefore, the awareness of whether there are TMD symptoms prior to initiating any orthodontic intervention is crucial.
T-Scan studies involving patients with TMD have repeatedly shown a significant correlation exists between both increased Occlusion Time28 and prolonged Disclusion Time, and the presence of TMD symptoms.29–32 The Occlusion Time (OT) is the elapsed time in seconds, measured from the 1st tooth contact until the last tooth contacts, as a patient closes all their teeth together from completely open (no tooth contact) to the beginning of static intercuspation.12 Static intercuspation always occurs before the patient achieves maximum intercuspation force levels (MIP). The Occlusion Time describes the degree of bilateral time-simultaneity present in a patient’s occlusion and is ideal when the OT < 0.2 seconds in duration.12
The Disclusion Time (DT) is the elapsed time in seconds of an excursive movement made in one direction (right, left, or forwards), beginning with all teeth in complete intercuspation through until only canines and/or incisors are in contact.33 The Disclusion Time describes the capability of a patient’s Anterior Guidance mechanism to functionally separate posterior teeth. Both the Occlusion Time and the Disclusion Time are occlusal function parameters that cannot be detected with articulating paper alone.
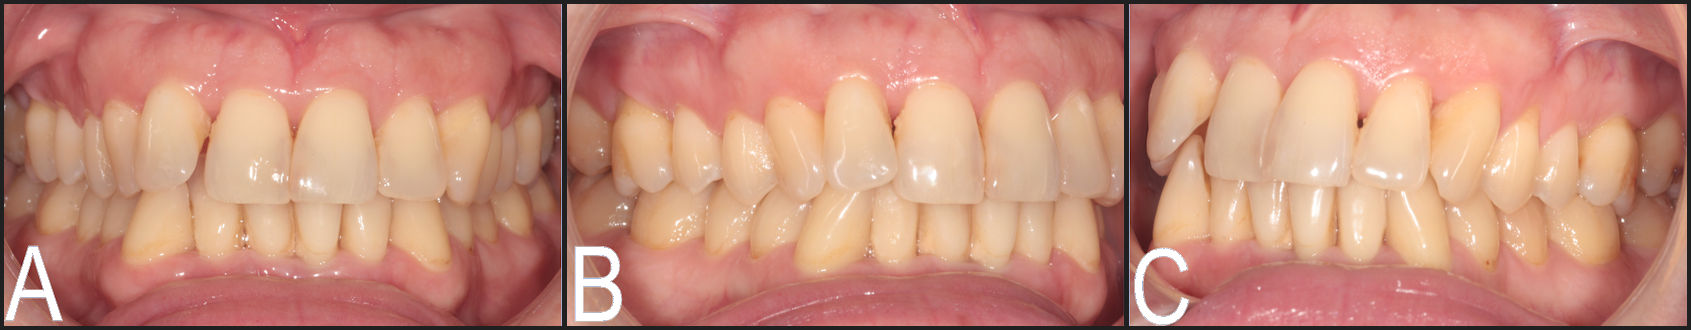
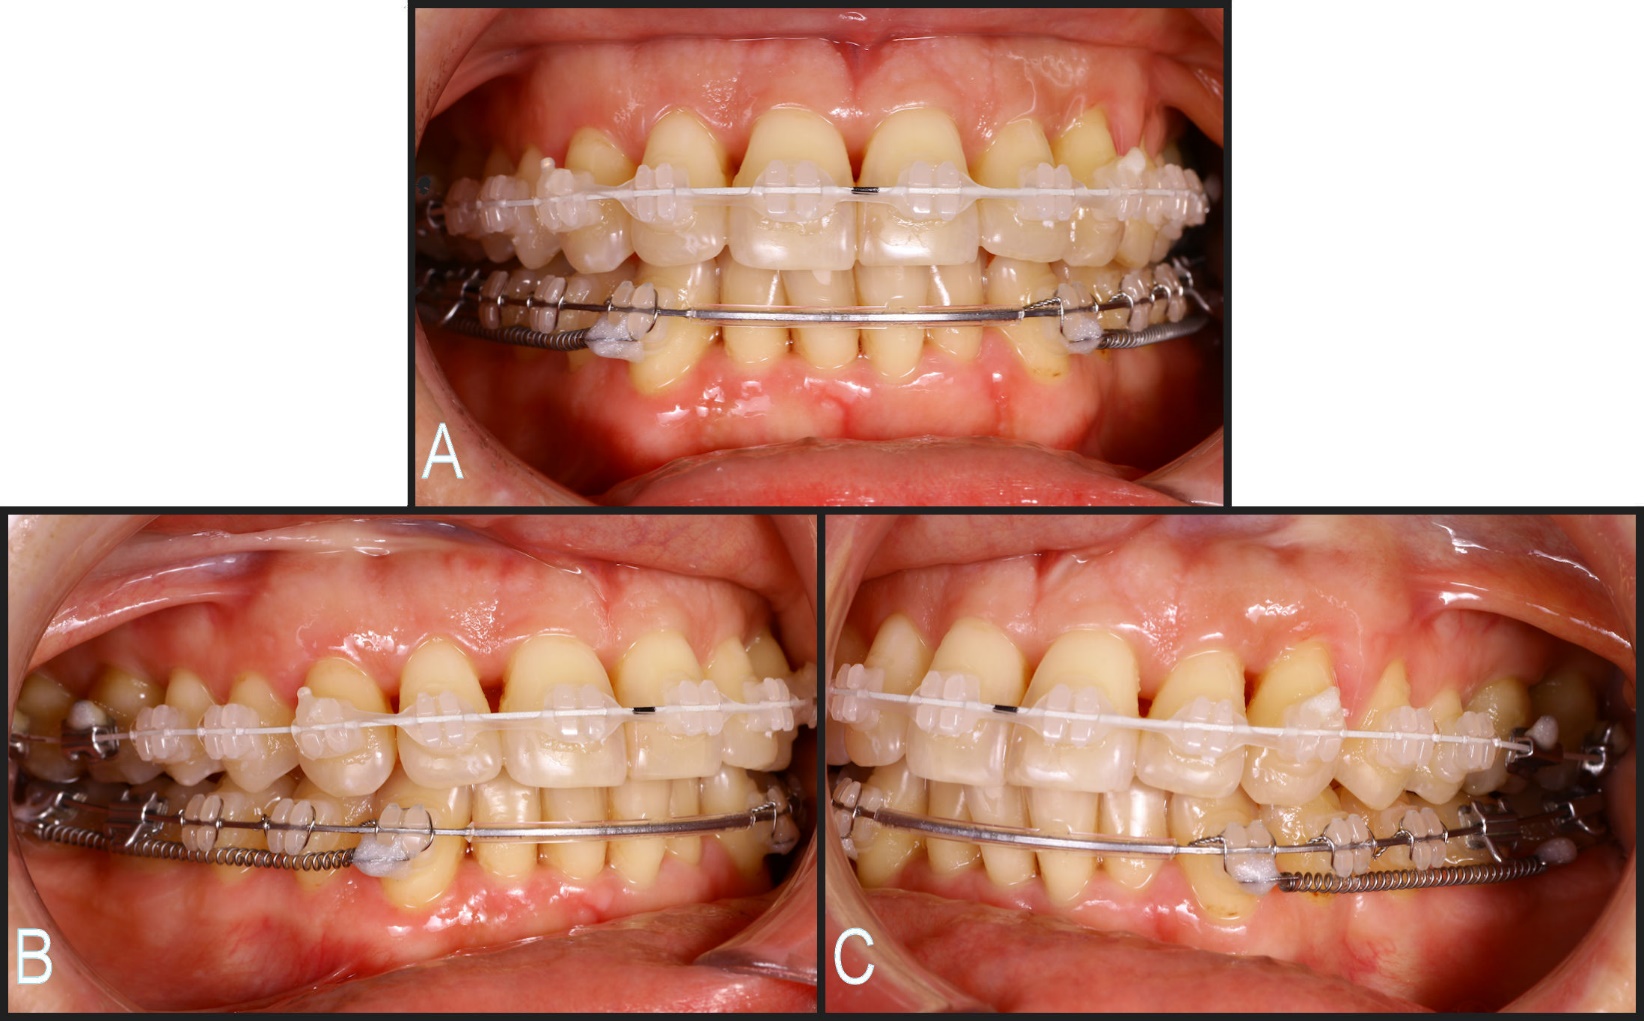
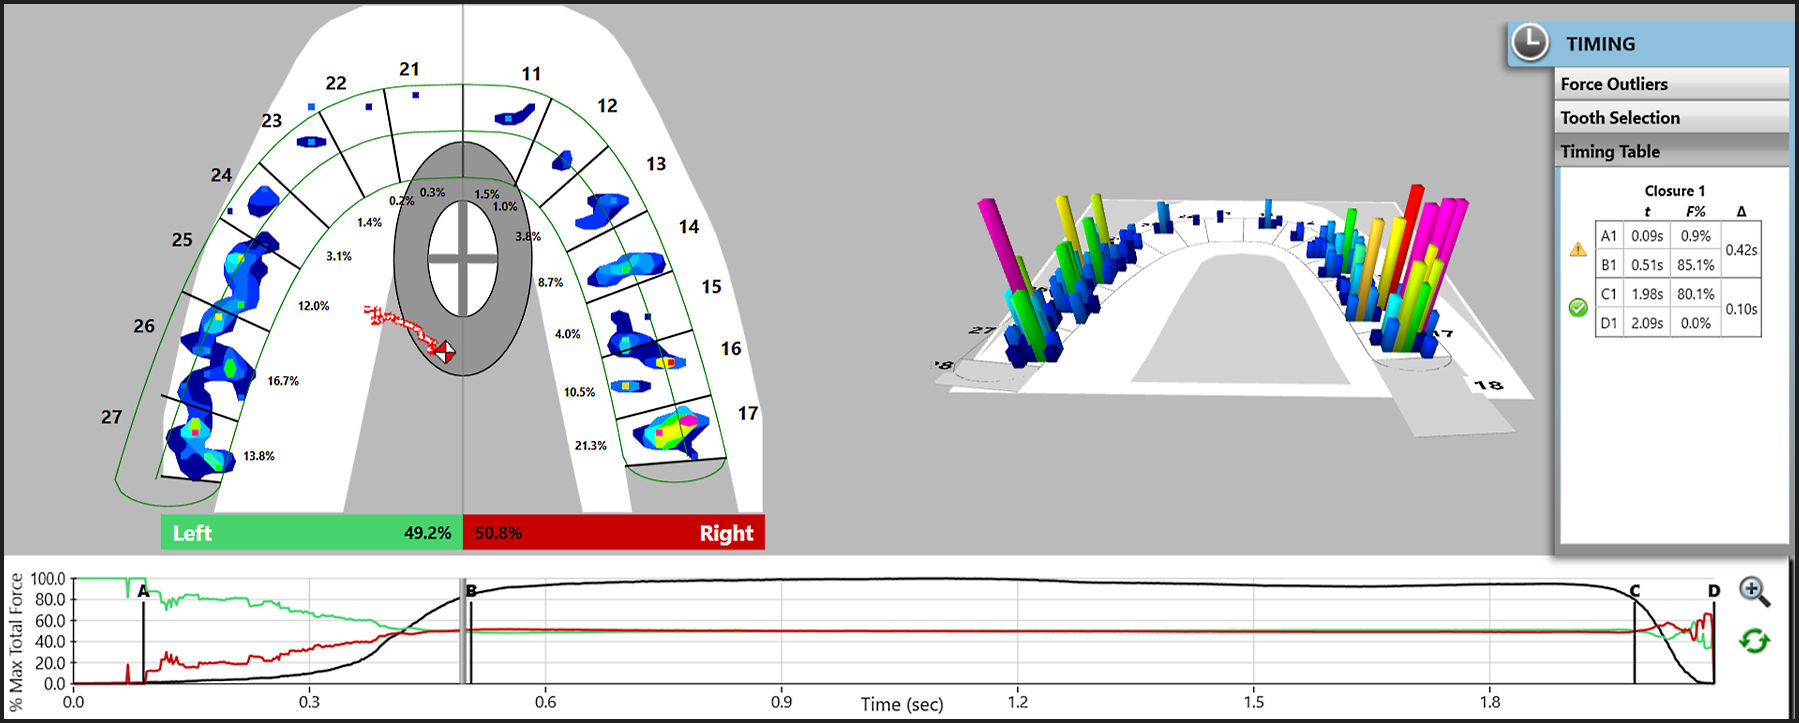
The previously mentioned 2013 Haralur study reported the T-Scan measured increased Occlusion Times in a TMD subject group, as well as longer left, right, and protrusive Disclusion Times in the TMD group.10 The association between pain emanating from static occlusion and lateral mandibular movements, has been shown in T-Scan studies where subjects presented with prolonged Disclusion Times.29–32 Therefore, an initial measured digital occlusal analysis with T-Scan is designed to establish an occlusal function force and timing baseline, before any intervention is performed on the patient. See Figure 1A-C.
_frontal_retracted_view_of_the_patient_in_mip__at_the_initial_data_collection_appoint.jpg)
The Goals of T-Scan Data Acquisition
It is important that each Multi-bite, MIP/CO, right, left and protrusive excursive movements should be recorded as separate, individual functional movements.
When Multi-bite and MIP/CO data sets are recorded (Figures 1D to 1G), special attention should be given to the Occlusion Time (the A-B period in the Force vs. Time Graph), when the earliest contacts appear in the 2-D Force View window, and the Vertical Opening time (VOT), which is when the patient opens out of MIP. The VOT is denoted in the C-D period within the Force vs. Time Graph) (Figure 1H).
_at_6.48__of_total_f.jpg)

_are_.jpg)
T -Scan data sets show the progression of changes in forces across time (Figures 1D to 1G). So, all the T-Scan Figures in this manuscript are series of T-Scan time-moments frames that illustrate changing forces as more and more teeth come in to contact towards MIP, or as teeth disengage in lateral excursions. Each data set grouping describes how different contacts in the course of orthodontic treatment, can influence the occlusal force profile at any given moment.
The A-B period (where the OT is recorded) should be analyzed for the presence and location of any Force Outlier occlusal contacts, which are very rapidly rising contact forces. More-often-than-not, the highest contact forces tend to exist on the molars.34 Teeth with Force Outlier contacts should be marked with articulating paper to locate these rapidly rising high force contacts, intraorally (Figures 1D to 1G).35
These contacts can be compared to those which disappear latest from the 2-D Force View window, when the patient opens out of MIP (Figure 1H).
Both Multi bite and MIP/CO recordings are made to analyze the left side - right side arch-half occlusal force % imbalance. Multi-bite recordings also verify the reproducibility of the Occlusion Time, the VOT, and the reproducibility of the mandibular position, assessed by the presence of stable interarch contacts or alternatively by the presence of a so-called “dual bite.” Alternatively, left and right laterotrusive recordings and Protrusive recordings, are made to capture the presence of excursive occlusal surface friction and measure the duration of each excursion’s corresponding Disclusion Times.29,36
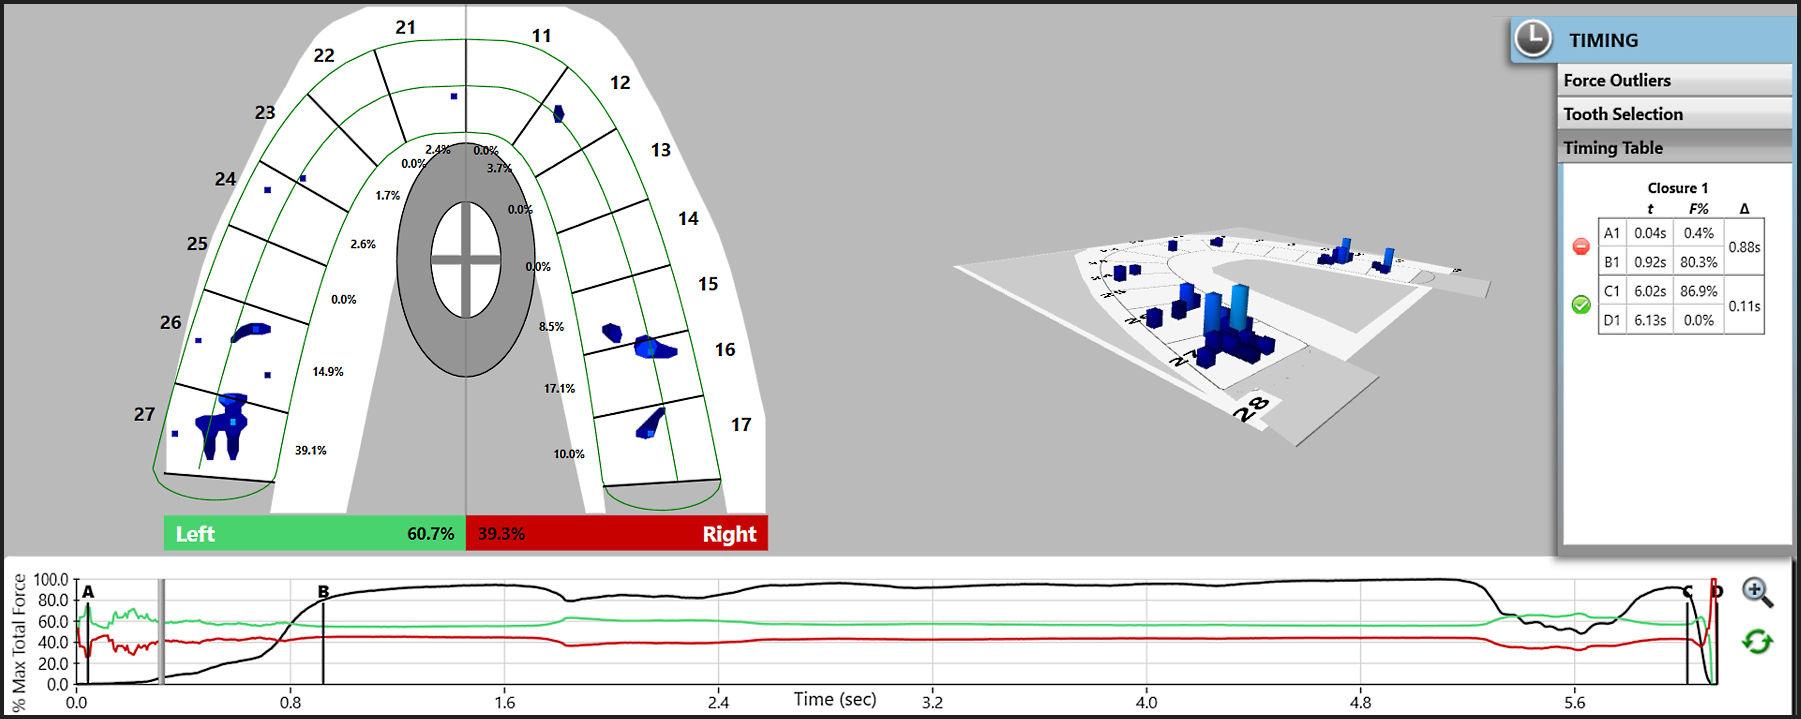
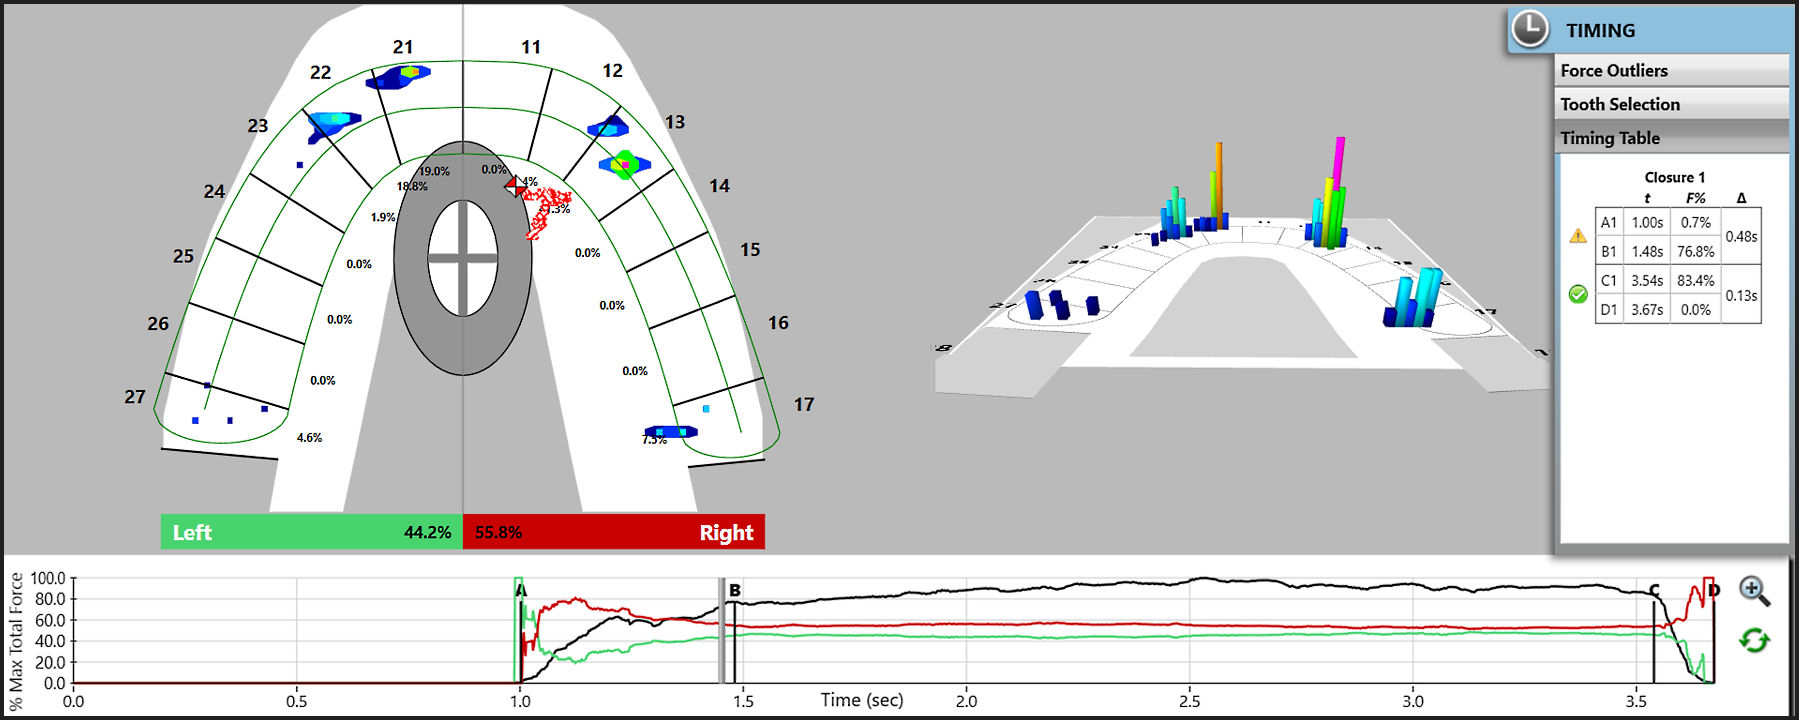
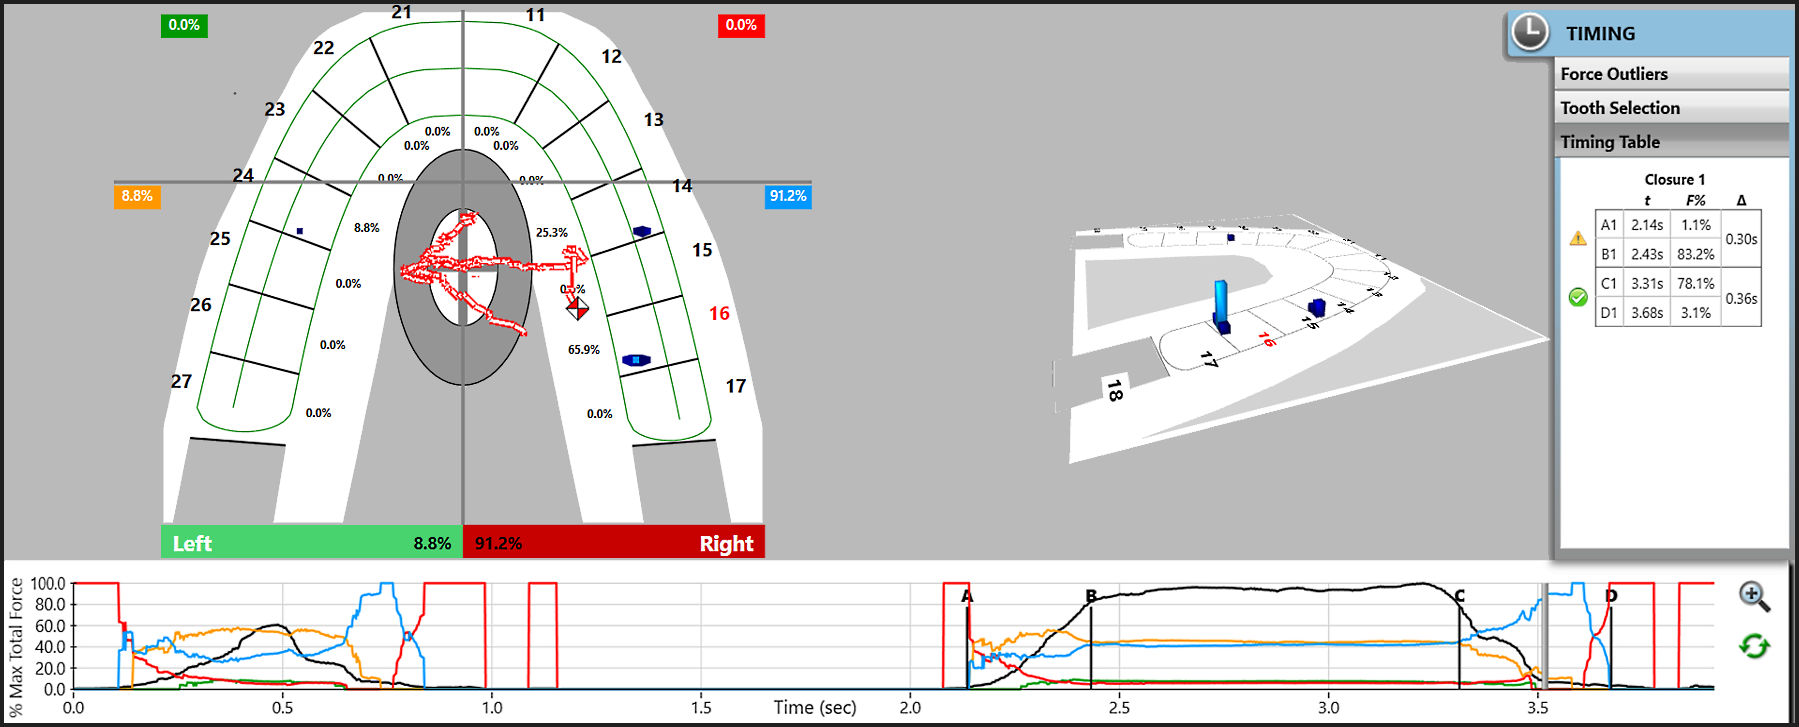
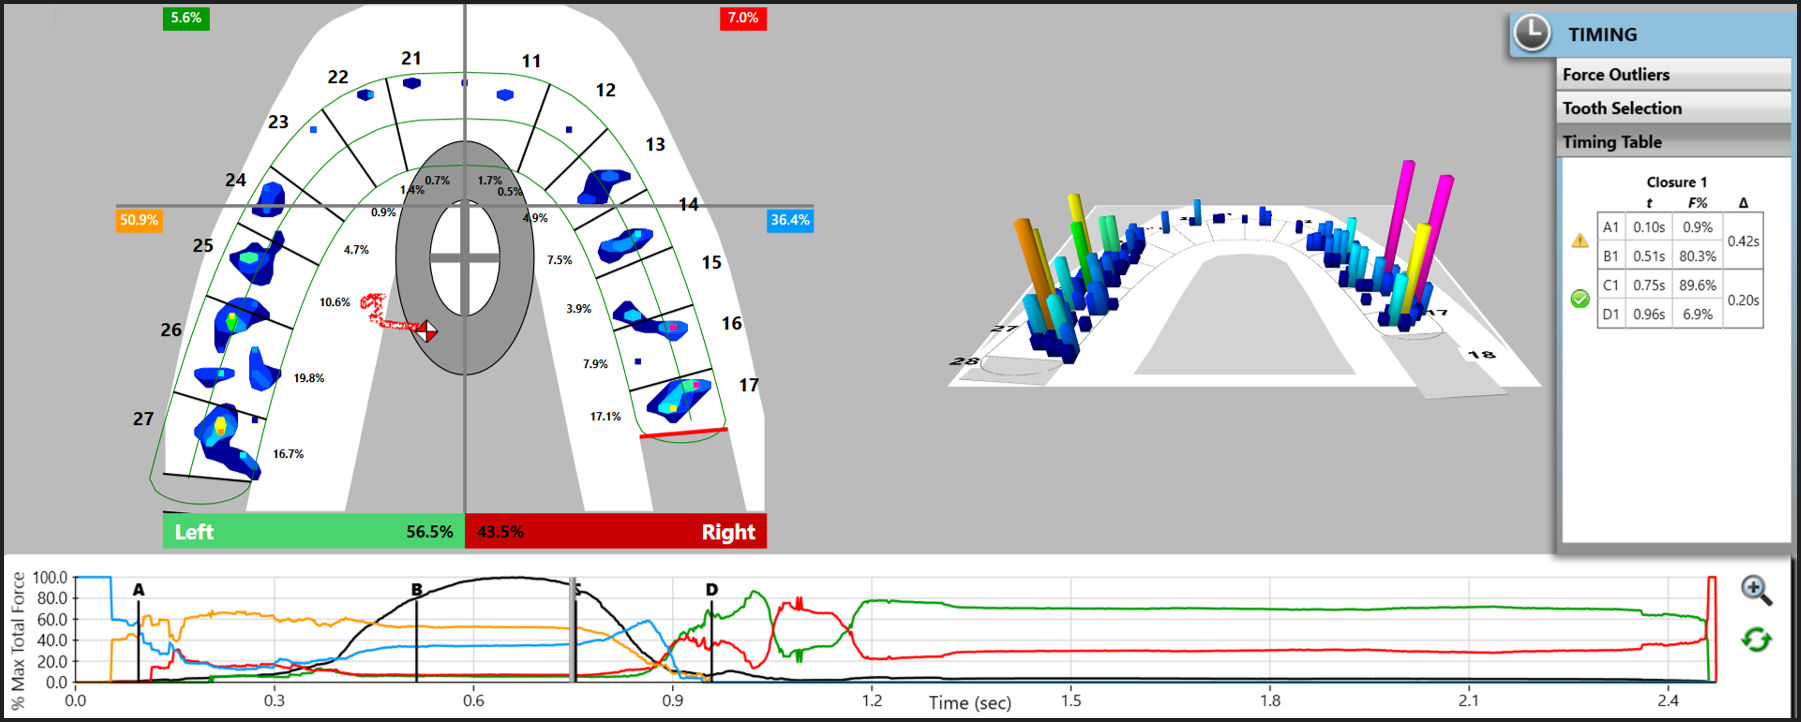
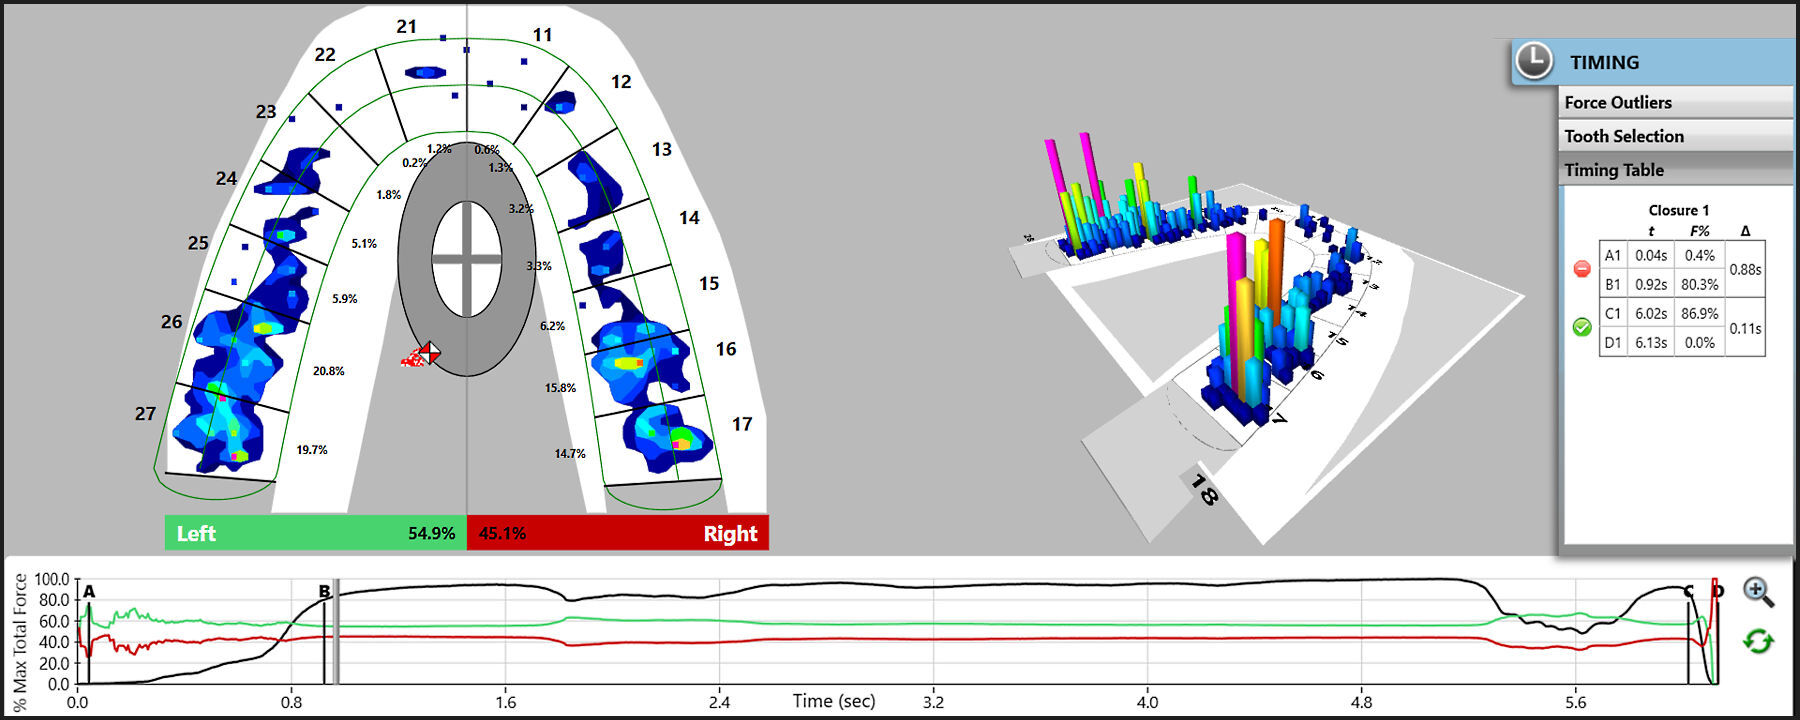
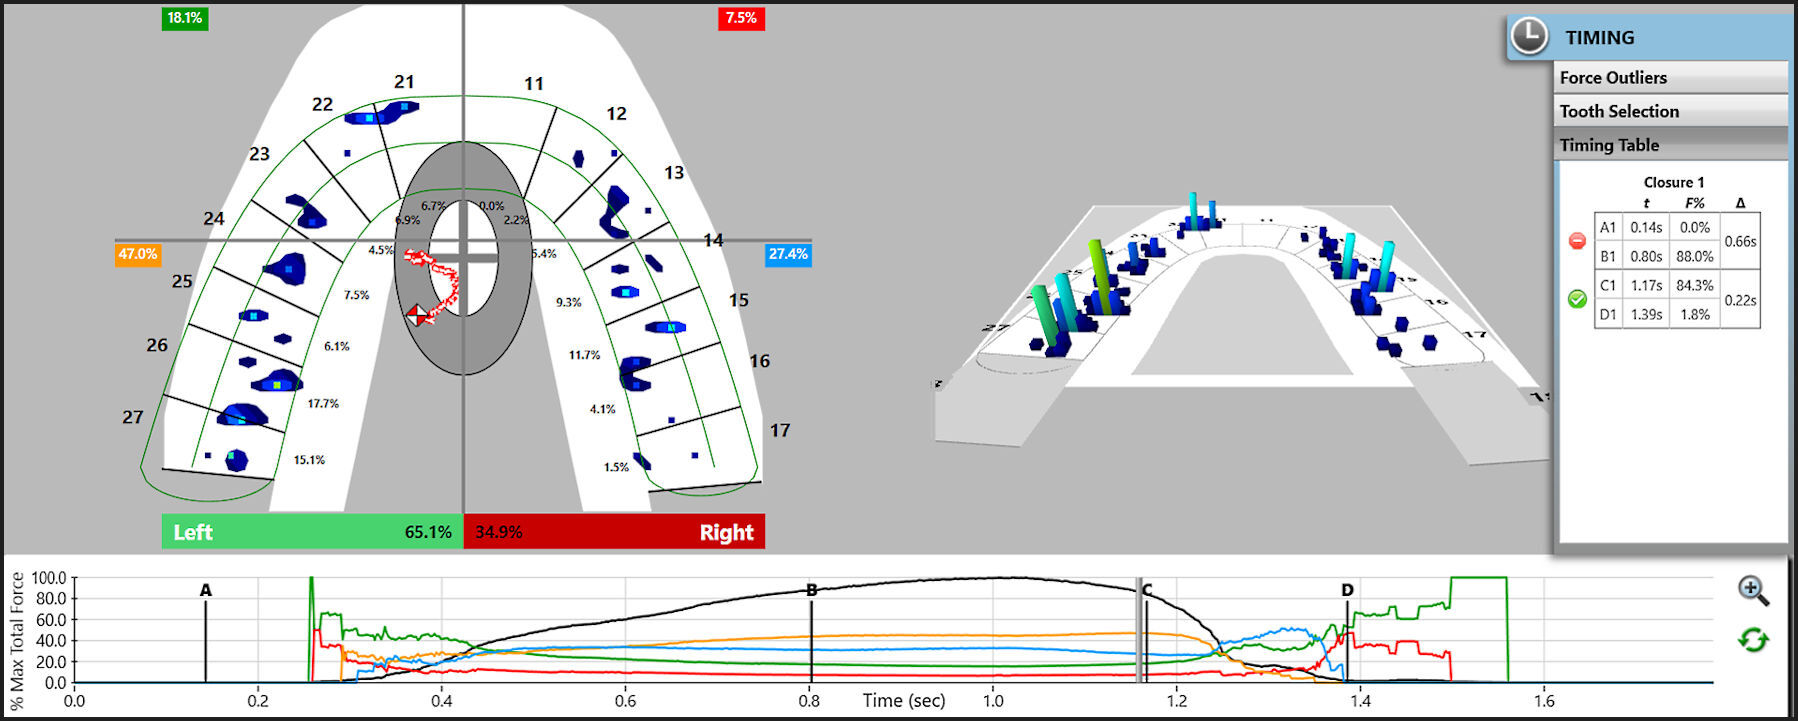
Figures 2D to 2F illustrate the MIP/CO closure contact sequence observed during fixed appliance orthodontic treatment, of the patient shown in Figures 2A to 2C. Visually there appears reasonable interdigitation, but the T-Scan analysis clearly detects that only 4-5 occlusal contact regions evolve around the arch, with some contacts exhibiting very high force concentrations (yellow, orange, and pink force zones). The closure OT is quite prolonged = 0.48 seconds (Timing Pane), indicating the patient cannot easily fit these few maxillary and mandibular contacts together.
_another_patient_s_maxillary_occlusal_view_with_the_patient_in_fixed_appliances_being.jpg)


Excursive movement recordings illustrate the presence or absence of, and the quality of the Canine guidance, is one aim of full-arch orthodontic treatment in young patients.37 Laterotrusive movement recordings illustrate which teeth contact during right and left excursive movements, detail the presence and duration of working and nonworking side contacts, quantify the Disclusion Time durations of any frictional contacts, and can determine if occluding 3rd molars should be extracted because they prolong the Disclusion Times. All these excursive functional elements can be isolated within the Force vs Time graph the C-D period).29
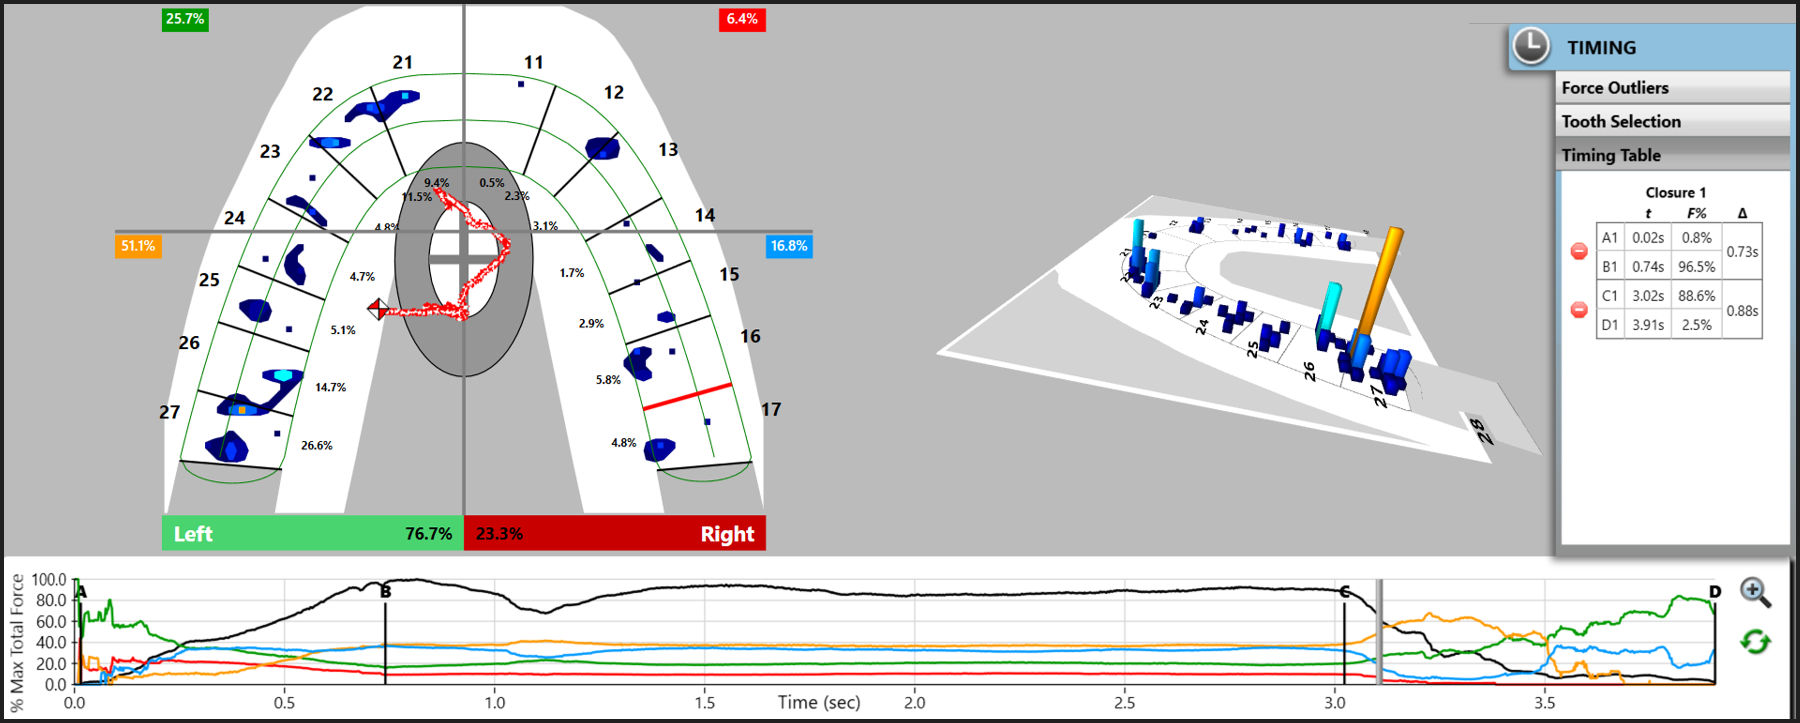
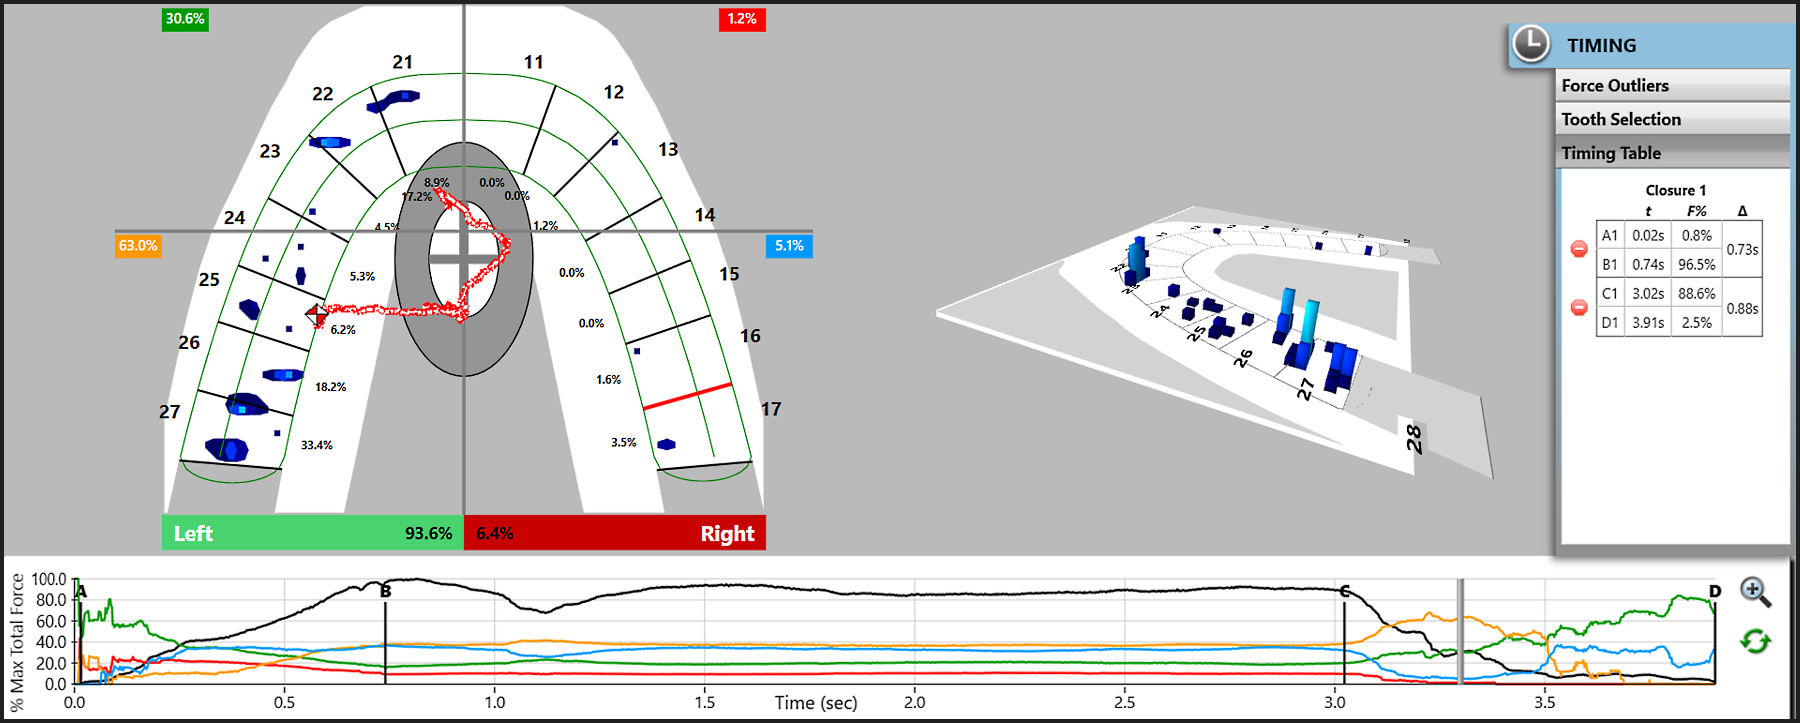
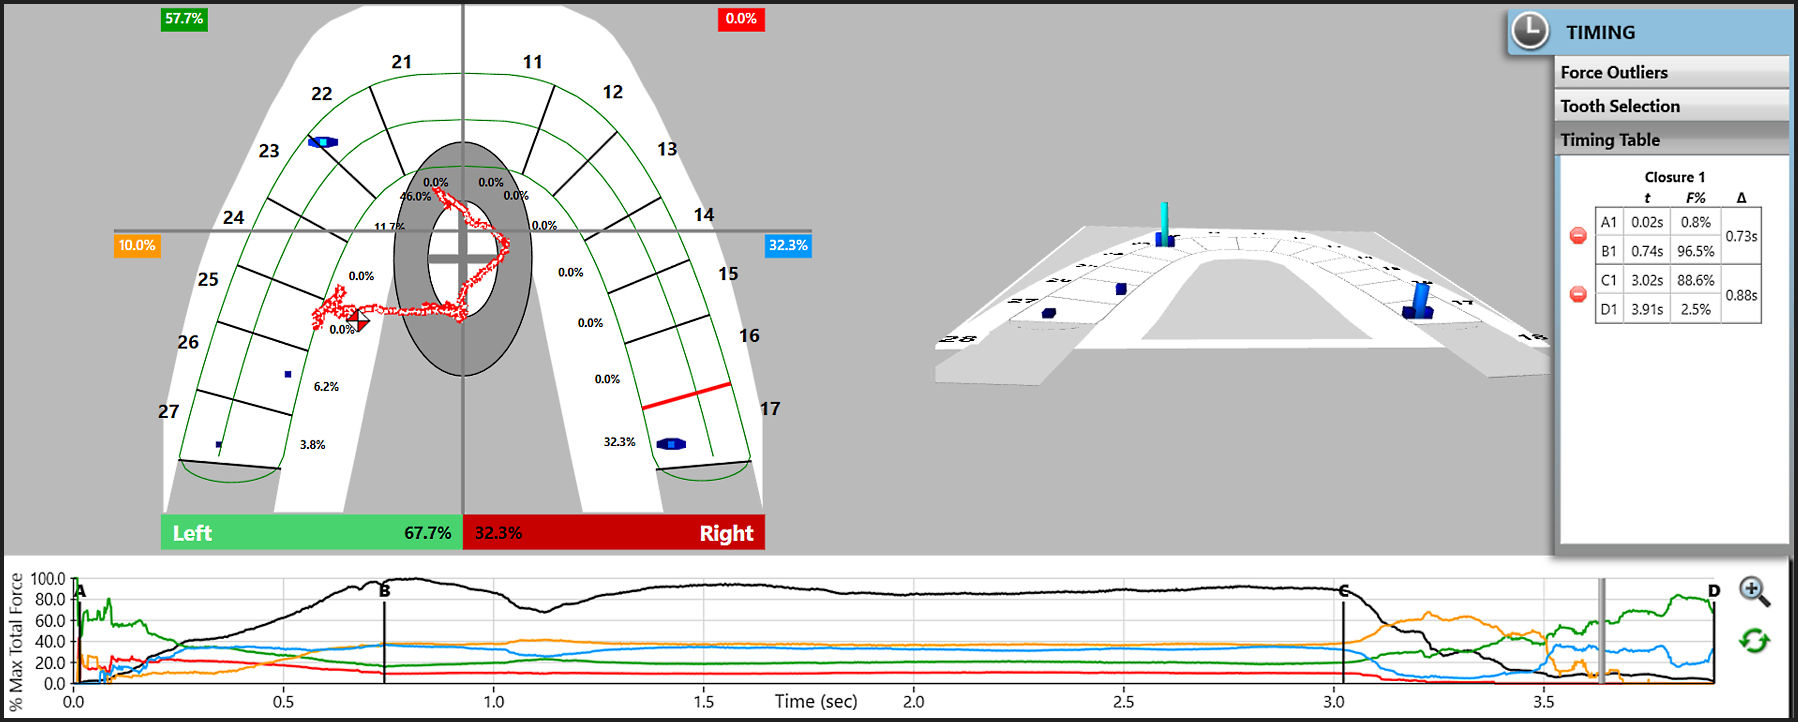
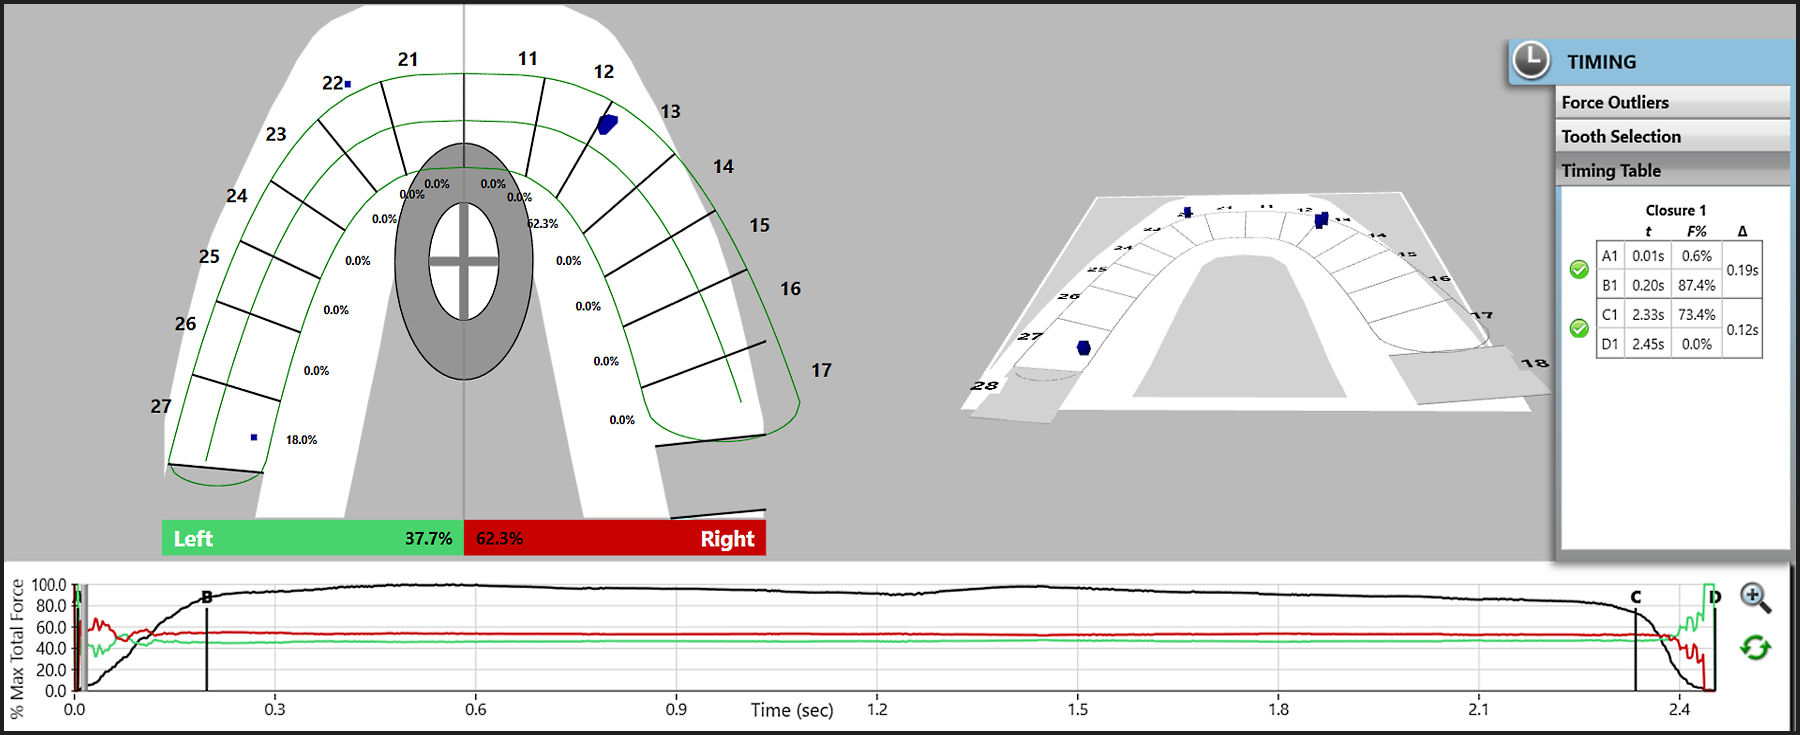
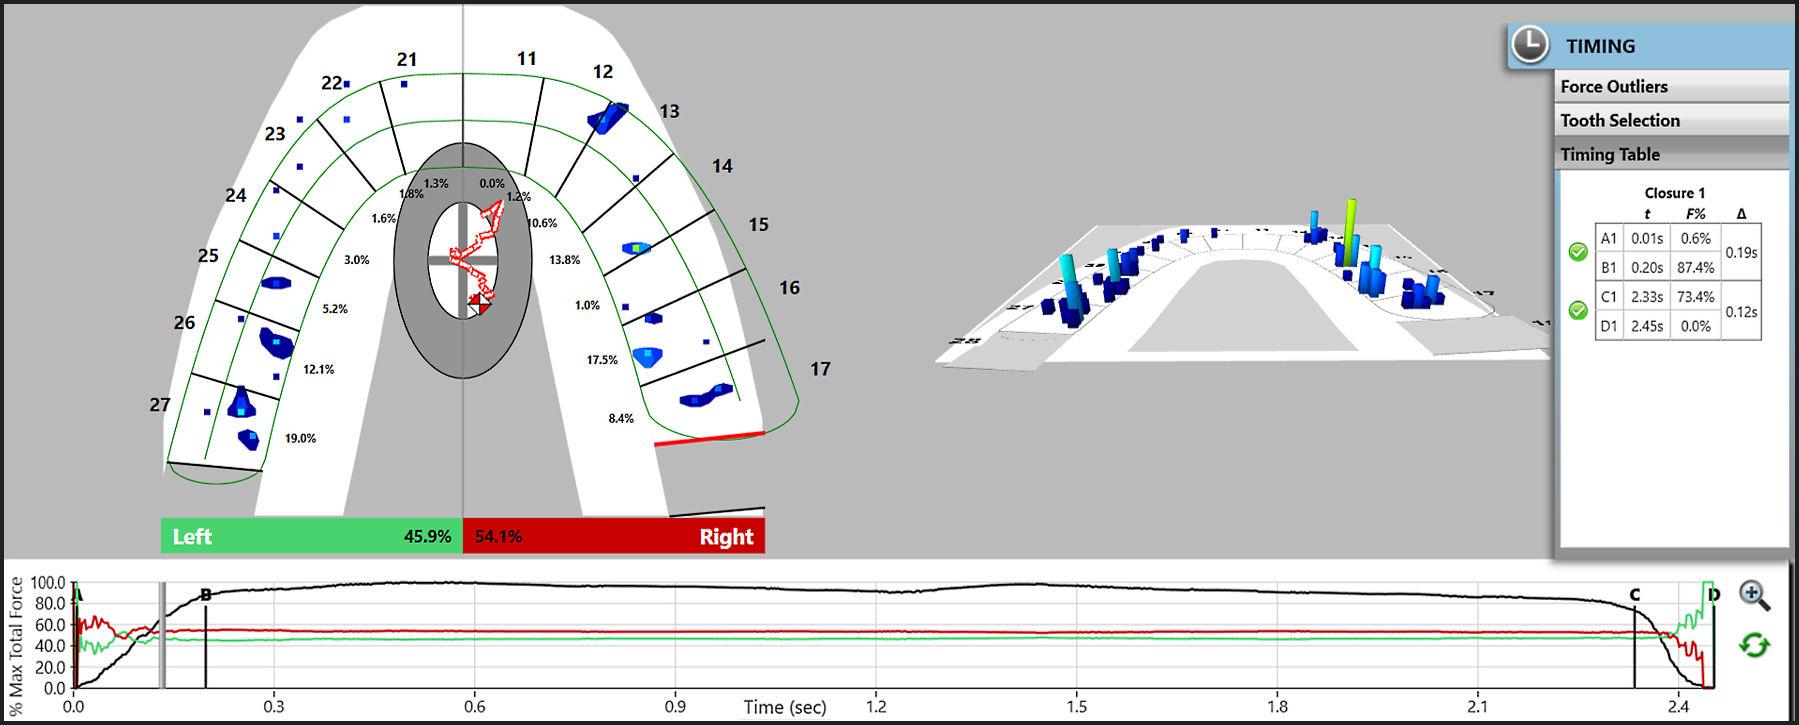
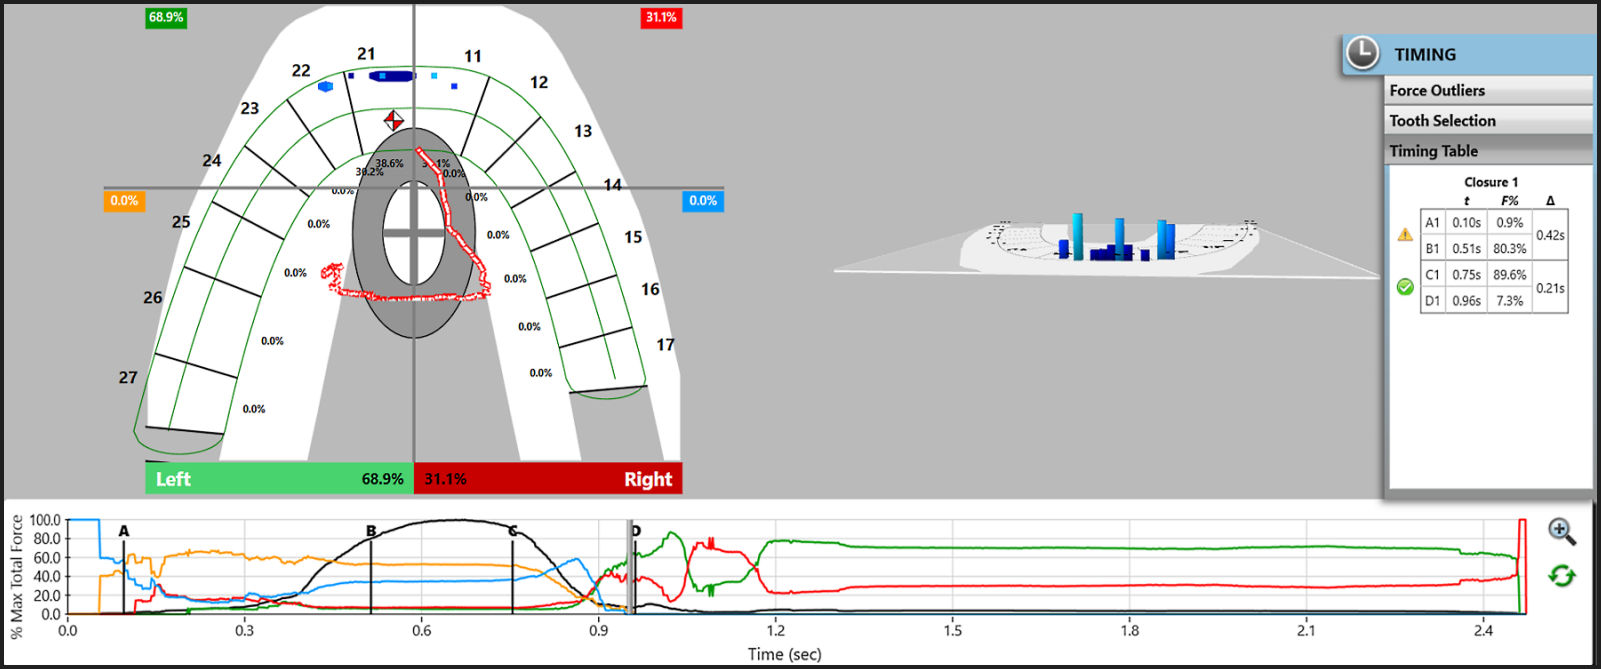
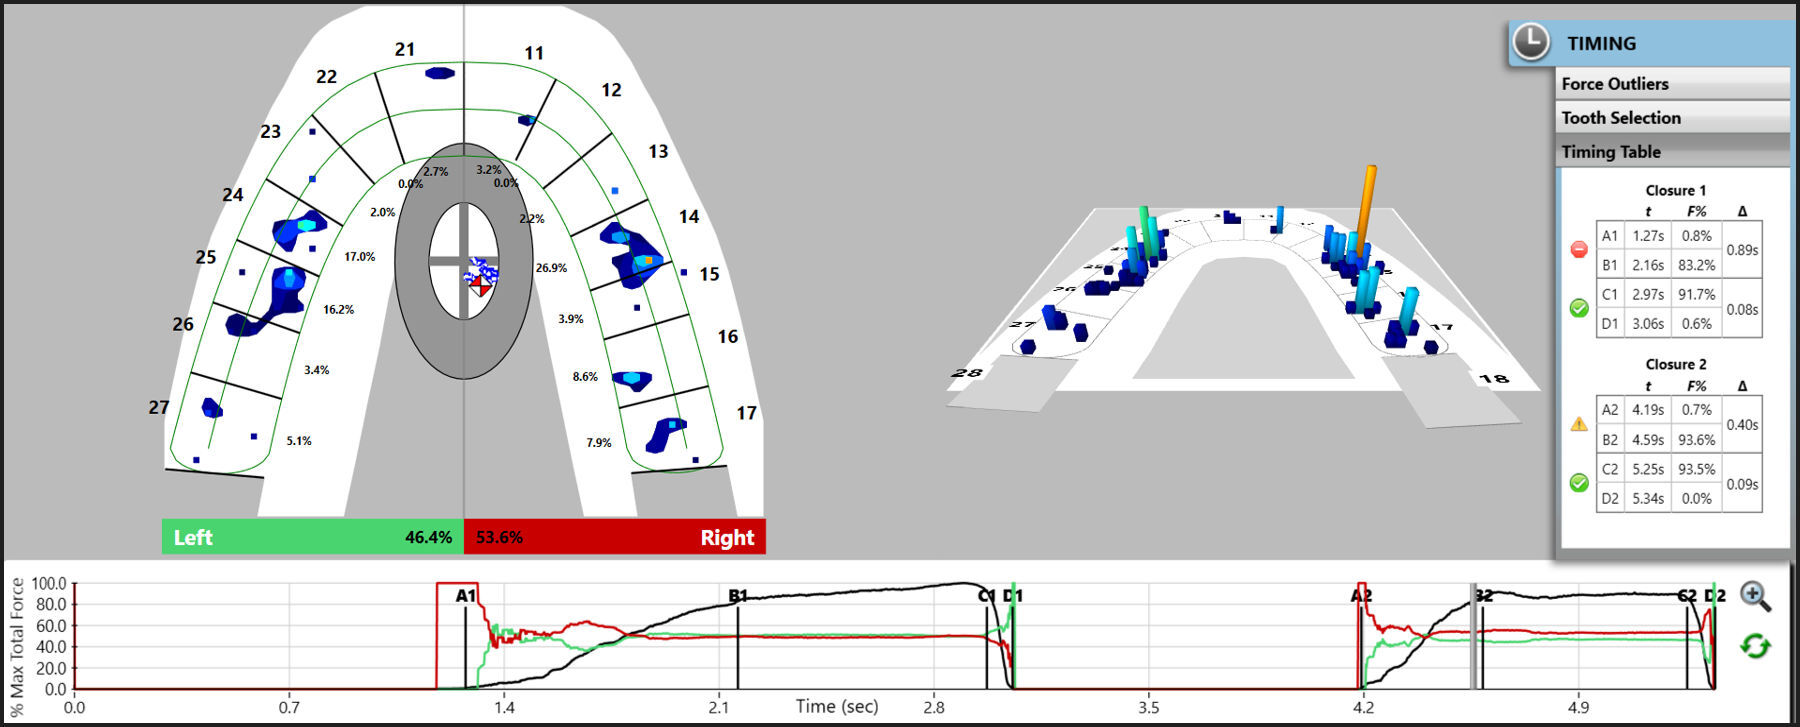
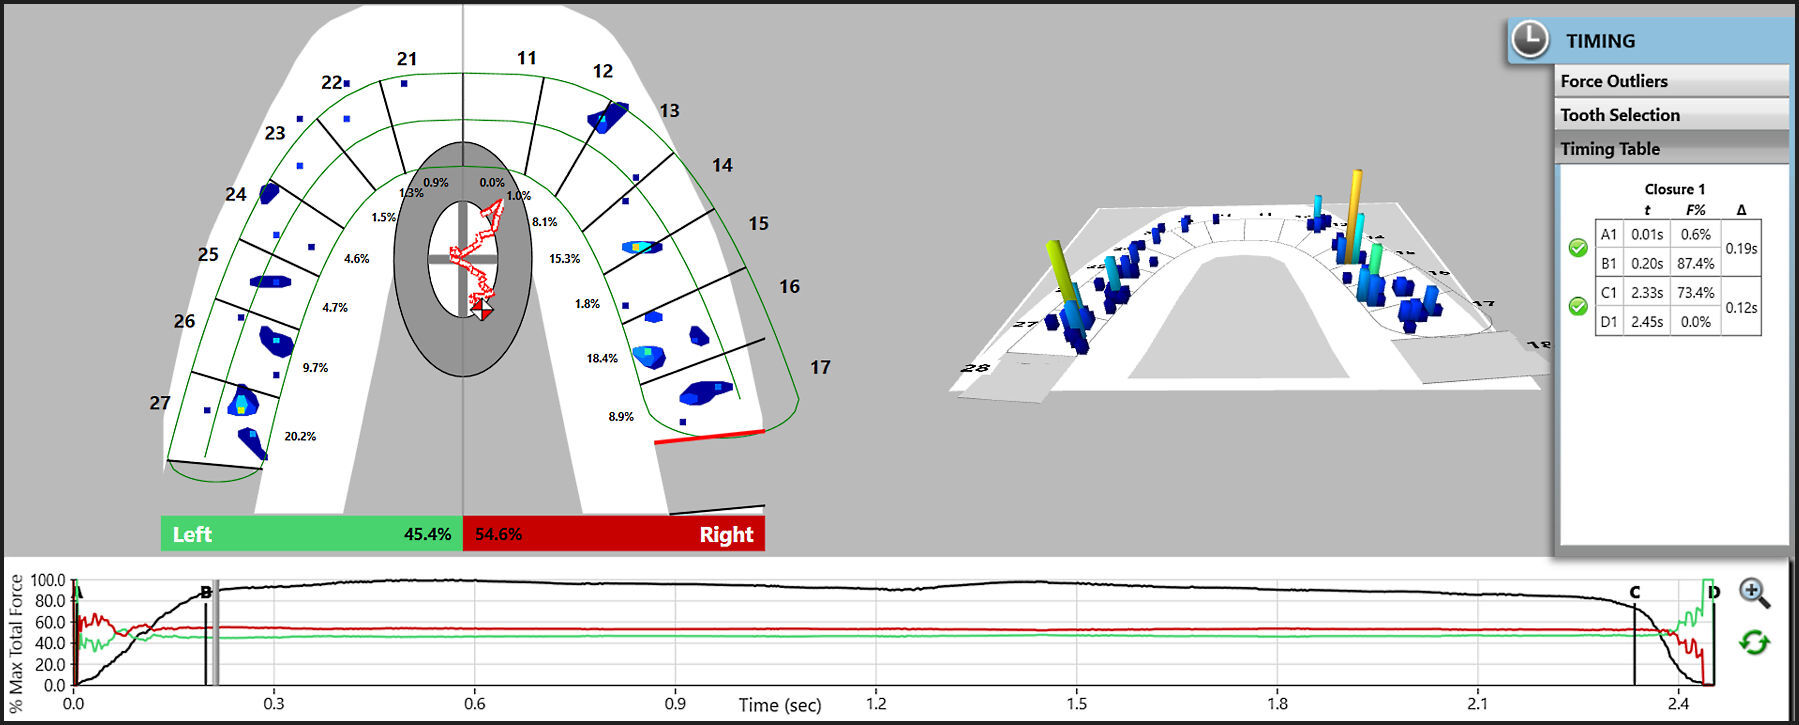
Figures 2G to 2M illustrate the left and right excursive movement contact sequences. These recordings were made after 6 more months of tooth movement took place in the same patient shown in Figures 2A to 2F. The ongoing fixed appliance treatment improved the MIP occlusal contact volume, as there are now widespread MIP occlusal contacts present that were absent in Figure 2F. However, even with more contact throughout, the OT is still quite slow (OT = 0.73 sec.), suggesting the patient cautiously closed into the T-Scan sensor (Figure 2G).


Follow-up Appointments for Non-Extraction Cases
Studies that have related orthodontic treatments with Temporomandibular Disorders (TMD) have all been categorized as23:
-
Papers that show TMD signs and symptoms are prevalent in orthodontically treated populations
-
Papers that researched the impact of orthodontic treatment on the development of TMD signs and symptoms
-
Papers comparing different types of appliances and their impact on the development of TMD signs and symptoms
-
Papers showing a relationship between extraction orthodontic treatment and the development of TMD
-
Papers showing that undergoing orthodontic treatment can induce a preventative effect on the development of TMD signs and symptoms
This collection of studies led to the conclusion that there is no association between the prevalence of TMD signs and symptoms, and undergoing orthodontic treatment. Further, a separate study by Rendell concluded that orthodontic treatment does not cause the onset of TMD signs/ symptoms, and if TMD signs/symptoms are ongoing during orthodontic treatment, their severity and frequency does not change during the duration of treatment.38 However, in clinical practice, it is not uncommon for patients to report the onset of TMD symptoms while undergoing the process of orthodontic treatment.
One study used the Herbst appliance to make Class II corrections, showed the orthodontic treatment increased muscle tenderness. But by the end of the study time frame, the number of subjects exhibiting muscle symptoms was equal to those at the start of treatment.39 Silverman also stated that intermaxillary elastic use can potentially induce TMD signs/symptoms by excessively increasing the Vertical Dimension of Occlusion (VDO).8 Because TMD signs/symptom can readily appear during orthodontic treatment, close monitoring of a patient`s mid-tooth movement status with the T-Scan technology, is advised, and is readily accomplished.
Considerations for T-Scan use during follow-up appointments
Orthodontic biomechanics in non-extraction cases includes inter-arch appliances that are attached to teeth directly, or to orthodontic wires engaged into attachments on certain teeth. Direct force application to teeth, tends to displace them in the direction of the applied force.
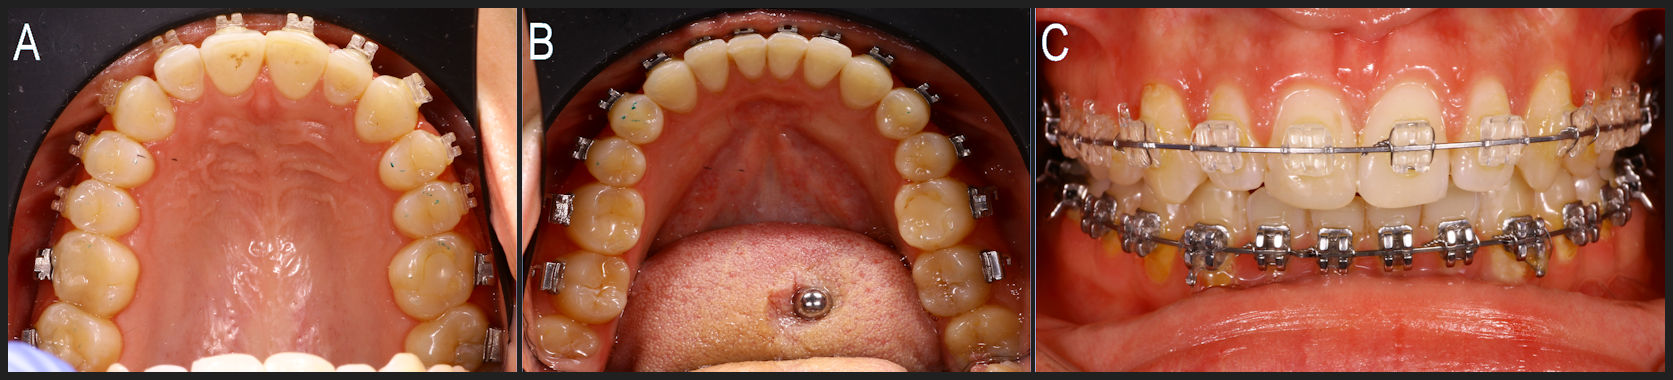
During Interarch Elastic Use (Figure 2A-C) record MIP/CO, protrusive, and both laterotrusive movements.
\
- Record MIP/CO - Detect any Force Outliers on molar teeth which serve as elastic attachments (Figures 2D to 2F) and evaluate the Occlusion Time.
This is important because usually in Class II elastic use, lower molars tend to extrude with their distal cusps rising above the occlusal plane, such that molar extrusion will often produce only 4 points of contact (upper - lower central incisors; upper - lower first molars) (Figures 2D and 2E). Further, attention should be paid to the marginal ridge positions of the lower 1st and 2nd molars (especially if they serve as attachments), because Force Outlier contacts often are present on their distal marginal ridges. And, in cases with the Occlusion Time > 0.2 seconds, additional wire adjustments should be made on the molar teeth, to lessen the overall time required for the patient to reach MIP.
II. Record laterotrusive movements - To ensure that upper and lower canines occupy the correct positions to ensure the Disclusion Time (DT) > 0.4 seconds (Figures 2G to 2M).
To manage detected excessive forces on posterior teeth during the lateral movements, wire adjustments should be incorporated. Engaging more teeth into the anchor unit on the mandible will redistribute vertical forces more evenly, and prevent unwanted super-eruption.
Follow-up Appointments - Extraction and Molar Distalization Cases
A well-published lawsuit about the Orthodontic treatment of a Class II Division 2 malocclusion, that resulted in a 7 mm anterior open bite end-point, was legally decided in favor of the patient. This decision was based on the assumption that the extraction treatment of 2 upper premolars was associated with the development of TMD signs and symptoms, while the patient`s predilection to Temporomandibular Disorders (TMD) was not well-diagnosed before the commencement of intervention. The patient did not demonstrate any signs and symptoms of TMD before treatment, but began complaining during the course of her orthodontic treatment.
The explanation for the development of TMD symptoms during premolar extraction orthodontics has been researched, to determine whether the extractions were the cause of TMD, whether patient growth was the cause, or if there were any other possible causes. Sadowsky and coauthors demonstrated there was no difference in the frequency of TM joint sounds between patients treated with and without premolar extractions.40 The authors stated that the frequency of TM joint sounds was less after orthodontic treatment, which suggests there is an association between occlusion and TMD signs and symptoms. A study by Luppanapornlarp and Johnston reported there was no association between TMD and premolar extraction.41 However contrarily, Dibbets & van der Weele showed there was a higher prevalence of TMD signs/symptoms 15 years after premolar extraction orthodontics, when compared to 10 years’ post-treatment. The authors surmised that growth patterns rather than the extraction protocol might be responsible for the increased occurrence of symptoms following orthodontic treatment.42 Lastly, a retrospective study by Staggers rejected the assumption that 4 premolar extraction treatment decreased the Vertical Dimension of Occlusion (VDO), instead showing that the VDO actually increased due to growth.43 With the evidence being equivocal regarding the anecdotal development of TMD symptoms during the course of orthodontic treatment, combined with the indirect association of TMD signs and symptoms and occlusion reported in many T-Scan based studies,5,31,44–47 close monitoring of the occlusion with the T-Scan should be provided throughout the active phase of orthodontic treatment.
Distalization Case Management with T-Scan
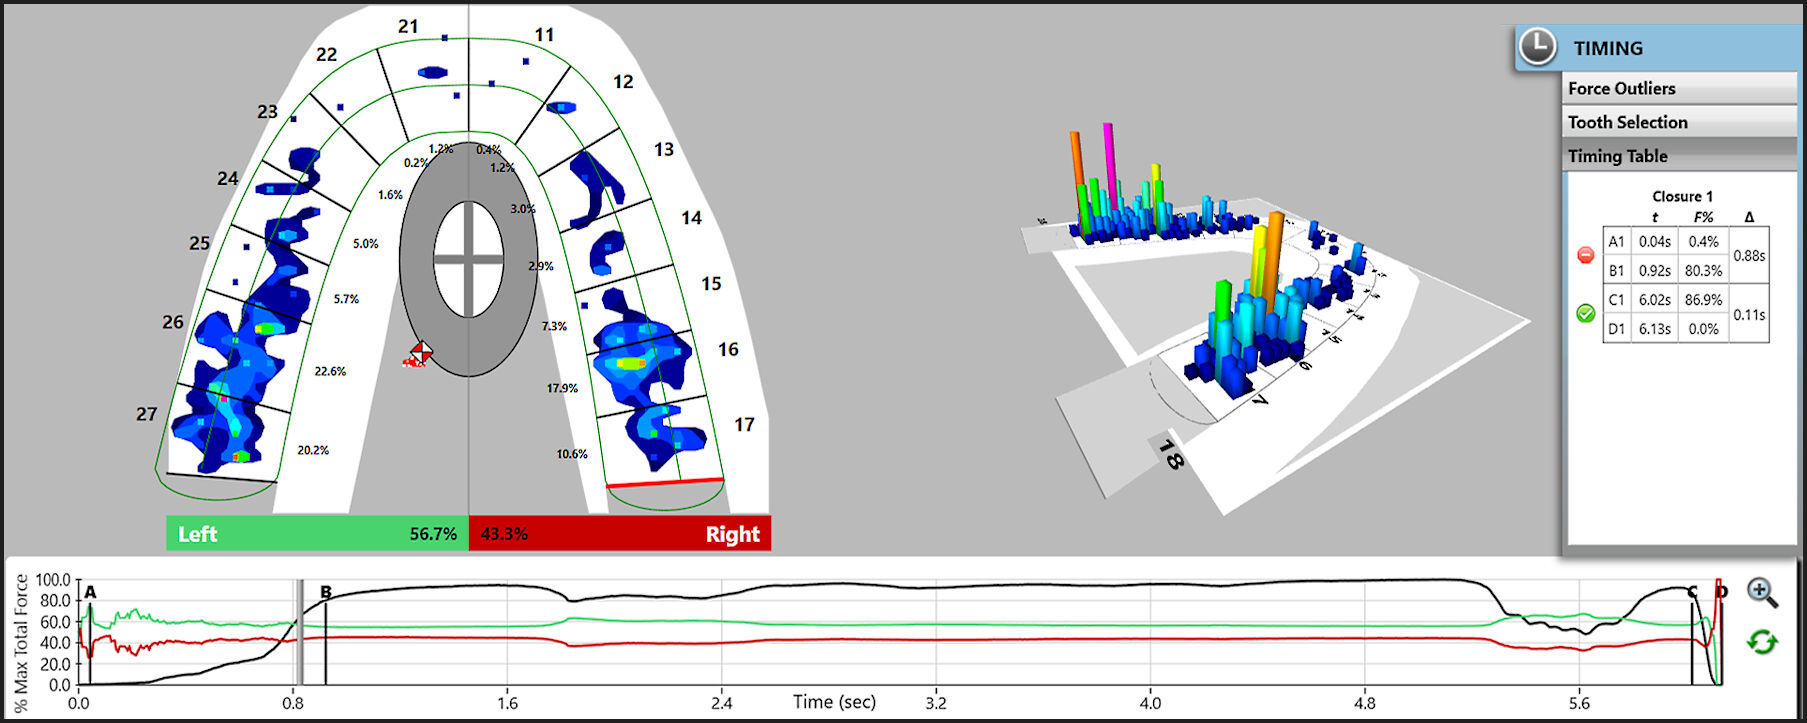
Despite that distalization is usually considered to be a non-extraction treatment option, the mechanics of tooth movement in extraction and distalization cases does incorporate sagitally directed tooth movement in the posterior segments of the arch (Figures 3A to 3E). Sagittal tooth movements generally cause positional changes of the main supporting cusps, which can lead to changes in the Vertical Dimension of Occlusion (VDO), and often cause new prematurities to be perceived within 2-3 days after appliance activation. Sometimes during distalization in severe cases, the mesiopalatal cusp of the upper first molar can cause acute pain and periodontal abscess formation in its opposing lower molar.
_frontal_view_of_patient_with_fixed_appliances_undergoing_lower_molar_distalization_u.jpeg)
_periapical_radiograph_of_the_mini-screw_in_the_area_of_tooth____31._e)_periapical_ra.jpg)
During Distalization
\
- MIP/CO is recorded - to determine the presence of any contacts with excessive force, and for any rapidly rising Force Outlier contacts (Figures 3F to 3H).


II. The Clench-and-Grind movement is recorded - to reveal any painful contacts. The patient is asked to first clench his/her teeth together into the T-Scan sensor, and then to grind repeatedly to both sides, back and forth.
Usually, painful contact is revealed in the T-Scan data as an extremely high and forceful contact, visible in the grinding movement. After locating and adjusting the contact, the patient should feel immediate relief (Figures 3I to 3L).


III. Both the right and left lateral excursive movements should be recorded - to be sure that the DT is short (< 0.4 seconds per excursion).
To maintain the DT closer to 0.4 seconds during any sagittal posterior tooth movements, additive procedures can be incorporated that enhance the contour of the palatal side of the ipsilateral canine. And, to resolve a painful tooth problem during distalization, occlusal buildups that may have been placed earlier on the molar teeth to facilitate sagittal tooth movement, can be adjusted. Finally, in cases where no molar occlusal buildups are employed, additional occlusal buildups can be placed onto premolars and 2nd molars to relieve a painful tooth.
Extraction Mechanics
If en masse mechanics is preferred, the canine position should be checked prior to performing any space closure. This ensures the canine has proper inclination to create sound posterior disclusion in the right and left lateral movements. Despite the initial situation (excessive crowding, or excessive buccal tipping of the upper incisors requiring possible tooth extraction), the mandible tends to
completely use the available space for performing all border movements. Therefore, the canine guidance should be obvious during this stage of treatment, although the posterior segments can still contain working and non-working side contacts. Then when the extraction site is nearly healed, more obvious canine guidance should be visually apparent. But until the extraction full space closure is complete, no straight wire additional bends should be incorporated in the posterior regions.
\
- After complete space closure is achieved, an MIP/CO recording is made - to assess the occlusal contact distribution, the right side-left side occlusal force % imbalance, the Occlusion Time, the presence of any Force Outliers, and the VOT.
II. To verify canine contact correctness, the laterotrusive movements should be recorded - The DT should approach < 0.4 seconds.
At this point in orthodontic treatment, the MIP/CO contact distribution gives insight into the necessity of further vertical tooth movement. When there are only a few existing contacts between the opposing arches, there likely will be molar Force Outliers present, along with prolonged Occlusion Time during the closure into MIP (A-B > 0.2 seconds). And if space closure remains incomplete, a Detailing Phase of tooth movement should be undertaken, to address these remaining occlusal issues.
Prior to Debonding of Fixed Appliances
The question of whether the ‘ideal’ occlusal relationships should be achieved before or after debonding is crucial to treatment planning. Improper tooth alignment combined with deflective interferences have been shown to be contributory to orthodontic relapse.8 In order to avoid unwanted tooth movements and relapse, proper tooth positions should be checked during the course of treatment. Occlusal interferences that are detected before debonding might aid in determining the need for further canine and incisor movements that could idealize the final incisor and canine positions, so they can better disclude the posterior teeth.
Two goals of completed orthodontic treatment.
-
To decrease the amount of non-axial occlusal forces
-
To redistribute the occlusal load between as many teeth as possible.
But as teeth change their positions during orthodontic treatment teeth, the likelihood that a horizontal force will act against inclined occlusal surfaces when patients swallow and/or function, is significantly increased.48,49 Rothner also advocated that Occlusal Equilibration50 could mitigate the occlusal trauma that can lead to periodontal breakdown, stating (incorrectly in 1948) that all centric contacts, regardless of the area, experience the same load.49 Both the adjusted amount of tooth structure requiring correction, and the relative differing occlusal contact force levels that exist around the post-orthodontically treated arch, can be easily improved by using T-Scan data sets to guide the final movements to optimize tooth position and orientation.
A Case Report51 involving the use of T-Scan to optimize a patient`s occlusion prior to debonding, illustrated how the T-Scan detected an increased time-duration of applied occlusal force on a pair of antagonists, that were subjectively reported by the patient to cause “continuous discomfort” during function. Although the patient was satisfied with the aesthetic outcome of the orthodontic treatment, the T-Scan diagnosed and treated the causative occlusal contacts responsible for the patient`s ongoing occlusal discomfort.51
The Detailing Stage (Figure 4A-D) is when the maximum number of contacts between the opposing arches should be developed.
_beginning_the_detailing_phase_by_observing_the_anterior_interdigitation_from_the_inf.jpeg)
The T-Scan should be used in the following ways:
\
- Make MIP/CO and Multi-bite recordings – to assess the MIP contact occlusal force distribution, and all the below closure into MIP T-Scan occlusal parameters described in Figures 4E to 4G:
-
No molar contacts should be the sole first contact at A.
-
No persistent contacts should be present on any molar tooth during the opening phase (during the VOT between C-D).
-
The Center of Force Trajectory (COF) should demonstrate a simultaneous closure path, starting near the midline close to the anterior teeth, and concluding near to the posterior teeth while staying near to the arch midline.
-
The Right side -Left side balance should be very near to 50%-50%, with all the MIP contacts evenly distributed around the arch (Figure 4H)


__at_9.jpg)
It is important to note that even if there is a high degree of right side-left side occlusal balance (near to 50% bilaterally), sometimes only a few occlusal contacts may be present around the arch immediately following debanding. Therefore, subtle adjustments made to the occlusion guided by the T-Scan can improve the overall closure interdigitation. Figures 4H to 4J detail the optimized closure sequence into MIP that resulted from T-Scan guided corrections made to the debanded data displayed in Figures 4E to 4G.
__all_teeth_are_in_contact_w.jpg)

Also, during the Detailing Phase, the protrusive and lateral movements are of great importance. If there are tight contacts present on the canines with no other anterior teeth in contact, any excessive palatal tipping should be overcome to provide more freedom for anterior mandibular positioning, and to develop additional solid anterior contacts that will guide straight protrusion.
\
- Record the Protrusive Guidance - to assess the DT, which should not exceed 0.4 seconds (Figures 4K to 4N).


Establishing Canine guidance is one important goal of orthodontic treatment. It can be easily achieved in most Class I and Class II cases. However, in Class III cases canine extrusion can be an option to establish Canine guidance, which can negatively impact the anterior aesthetics with a reverse smile curve. This option should be communicated with the patient during the initial treatment planning stages.
\
- Record the left and right lateral excursions - High quality canine guidance is best characterized by a DT < 0.4 seconds (See prior Figures 2K to 2M, 3K and 3L).
Articulating Paper can be used to help assess the contact path of the guiding contacts controlling each lateral excursion. The right and left lateral excursions should be guided by mesial canine fossae, with paper marks extending from the upper canine palatal ridge to the mesial marginal ridge of the mesial lingual fossa. In cases where no sufficient guidance can be achieved, or the DT exceeds 0.4 seconds, additional tooth movement should be incorporated. In most cases, these will be rotational upper canine bends.
Retention Phase
The Retention Phase has two major aspects of concern:
-
The longevity of the anterior alignment
-
Changes in the number of contacts in the posterior segments.
The problem of stability of anterior alignment has been addressed in many longitudinal studies that followed orthodontic outcomes at 3, 5, and 10-year intervals. Most studies agree that in an average patient, the maxillary anterior segment does not need dual retention, in that removable retention is sufficient.52–55 Canuto and coauthors reported that in 30% of treated subjects, there was a relapse causing maxillary irregularity during the post-retention period,54 but the degree and nature of relapse was not necessarily associated with some initial outcome tooth position irregularities. The generally accepted theory behind a maxillary anterior relapse is based on an association between posterior occlusal forces, and the periodontal reflex of the anterior teeth.56,57
Occlusal improvements during the so called “Settling Stage”, has a less discussed opposing view. This contradictory thinking suggests, there can be the evolution of both functional and non-functional occlusal contacts during Settling.
The commonly believed as being undesirable occlusal interferences present at the end of tooth movement are58:
-
Non-working side interferences with a lack of working side contacts
-
Posterior interferences in protrusive movements
-
Extensive retruded contact position-intercuspal position slides
Longitudinal studies performed during Settling reported at the 24-month recall, 72% of the patients showed no changes in their functional occlusion, such that it appeared the functional occlusion did not significantly change after fixed orthodontic appliance removal.56–58 The authors considered functional occlusion to be ‘satisfied’ when:
-
either canine guidance or group function existed, with or without balancing side interferences,
-
when an RCP-ICP slide < 2 mm, and
-
there were no posterior interferences in the protrusive movement.
However, the studies on Disclusion Time Reduction show that not only balancing interferences are problematic, but often working side interferences contribute to increased DT.29,36 Therefore, working side interferences should also be avoided at the end of orthodontic treatment.
Durbin and coauthors in their study of occlusal contacts following orthodontic treatment stated, “that newly gained occlusal contacts could either contribute to improved interdigitation or constitute a basis for a relapse.”59 This study found a gain in the total number of occlusal contacts in MIP occurred over a three-month retention period, with a major gain in the posterior segments. However, the anterior regions showed a decrease in the number of contacts. The assumption was made by the authors that anterior teeth were not supposed to move during the retention phase. The authors explained the anterior contact decreased from either an incomplete Class II correction, or from retainer interferences. The authors also found a negative correlation between the number of contacts at debonding and the number of contacts found at 3-month retention stage. The increase in contacts and their potential impact on the functional occlusion might be avoided, if the contacts and their relative forces were made even, and the DT reduced to < 0.4 seconds, before finishing the orthodontic treatment.
The behavior of first and second molars is of particular importance, as both contribute to the majority of the final occlusal contacts. Sultana and coauthors found a gradual increase in the occlusal force and occlusal area on first molar teeth occurred during the first months of retention. Whereas the second molar exhibited the highest increase in occlusal forces and occlusal area over the second year of retention, after retention was completed.60 This agrees with Lepley’s findings where higher forces were associated with larger occlusal areas.11
Two case reports described the Disclusion Time duration as an indicator that frictional posterior contacts caused maxillary anterior teeth spacing.61,62 Disclusion Time Reduction (DTR) improves a patient`s laterotrusive movements by decreasing the amount of excursive frictional interferences, while also lowering the muscle activity levels required to perform the movement.7,29–33,36,44–46,63 Silverman considered these excursive frictional interferences a potential cause of orthodontic relapse.8
Two comprehensive studies by Cohen-Levy and Cohen20,21 describe the outcome implications of utilizing T-Scan data sets when optimizing orthodontic case-finishing and retention outcomes. In patients that wore lingual bracket appliances, the authors described using differing T-Scan software tools to guide the case-finishing in adult patients with restorations present in their posterior teeth (Force Percentage per tooth, the Center of Force Trajectory and Icon, and the Occlusion Time). The overall goal of achieving symmetrical contact distribution with a centered Center of Force and no fast-rising Force Outliers on any tooth, can be achieved using T-Scan data to assess the patient`s occlusion. When necessary, changes can be made to occlusal surfaces of worn teeth, or to existing restorations to relieve forceful contacts.
In conclusion, orthodontic “Settling”, is dependent on the number of contacts developed before fixed appliance debonding, with the majority of contacts being “co-developed” during the first three months of retention. Later, the second molar teeth tend to align and erupt after retention is completed. Retention appliances should be planned according to the overall orthodontic biomechanics, whereas fixed orthodontic retainers placed on both arches provide more space for proper posterior interdigitation.
During the Retention Phase, the T-Scan should be used in the following ways:
\
- MIP/CO recordings are made at every retention follow-up appointment – to assess the distribution and number of contacts present, as well as right side - left side % force balance.
The Disclusion Time tends to remain constant during the retention period unless new restorations are introduced. To avoid unwanted tooth movements during retention, T-Scan excursive recordings should be made during each follow-up appointment.
II. Protrusion, and right and left laterotrusion recordings are also made - to detect changes in the DT from excursive working and nonworking side contacts that evolved during Settling, which require adjustment to prevent relapse.
SUMMARY
The ideal static occlusal relationships, as defined by both the OGS and PAR indexes traditionally define the quality of the orthodontic treatment outcome. Although the majority of visual characteristics of both indexes satisfy the aesthetic component of the orthodontic treatment goals, neither gives any insight into the functional occlusal relationships that follow tooth movement. When measured with T-Scan during and after orthodontic treatment, the functional occlusal relationships can be improved through interventional tooth movements guided by T-Scan data sets. This force and timing-based targeted orthodontic tooth movement approach, renders overall treatment to be more efficient, while decreasing patient discomfort and optimizing occlusal ‘Settling’ to prevent relapse.
Author Statements
Svetlana Koval: Conceptualization, methodology, writing of the original draft.
Robert Kerstein: Review and editing of the original draft, visualization, supervision.
Conflict of Interest
Robert Kerstein is a clinical consultant to Tekscan, Inc., South Boston, MA USA.