


INTRODUCTION
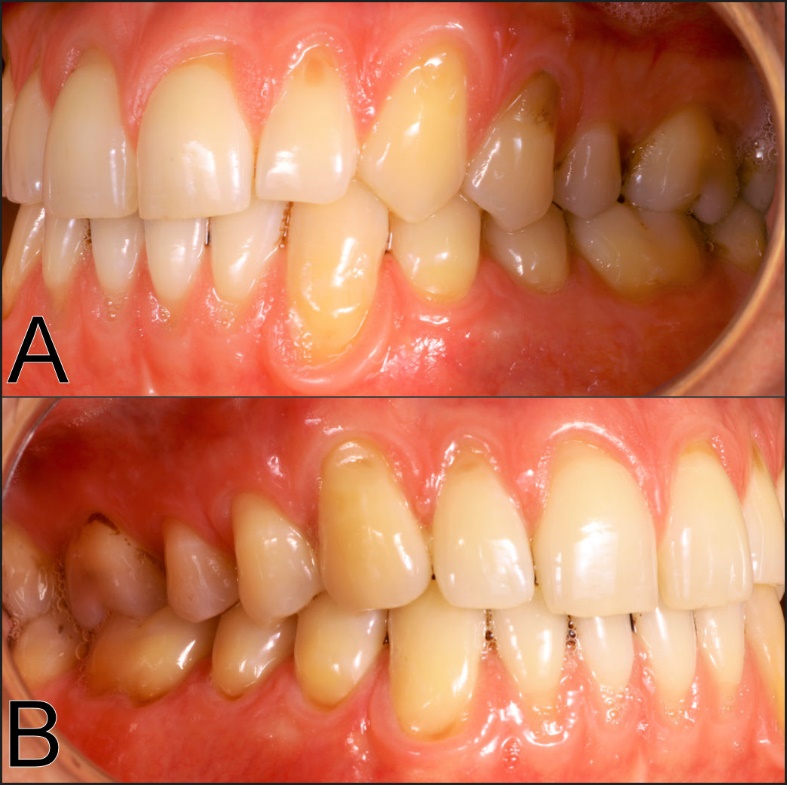
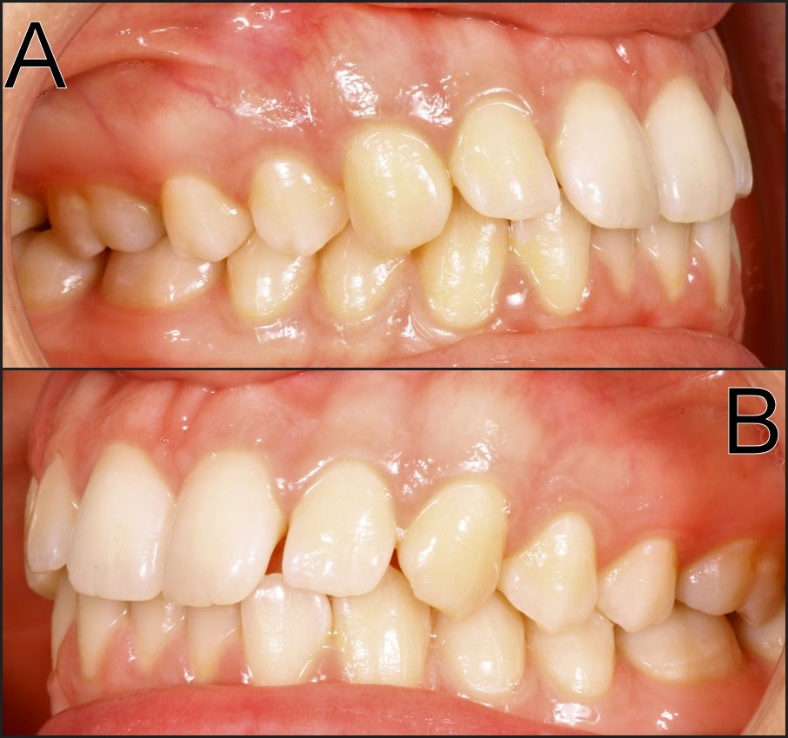
Classic studies by Angle1 and Andrews2 have established some morphological guidelines for normal or ‘ideal’ occlusion, but despite attempts to meet “normal,” interpretations of Class I are diverse.2 Katz emphasized that a unilateral treatment approach when interpreting Angle Class I could lead to unsatisfactory treatment results,3 suggesting not every Class I is an ‘ideal’ occlusion, but all ‘ideal’ occlusions are Class I. This ambiguity arises from Angle`s definition of Class I, which allows for a range of abnormalities of the first molar position = 3.5 mm mesiodistally (or +/- 1/2 a molar cusp’s width).2,4,5 It can be argued that the term ‘ideal’ should not be applied to the Class I with a ½ cusp position range. ‘Ideal’ implies a specific 1st molar cusp-groove relationship, with all other teeth having 2 antagonists, except for the upper central incisors and the lower third molars. See Figure 1AB.
_left_side_first_molar_cusp_to_groove_relationship_demonstrating_molar_class_i._b)_right.jpeg)
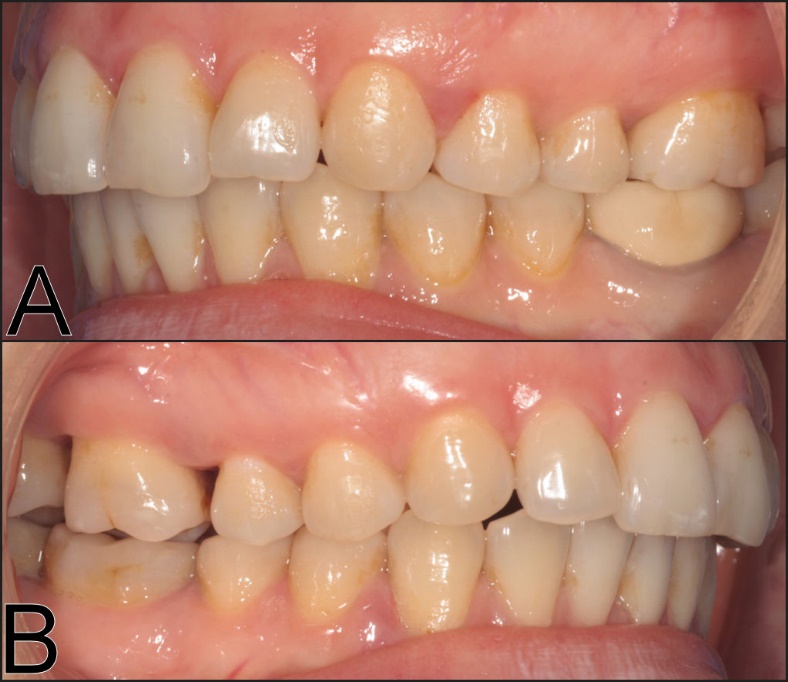
Another drawback of the Angle`s Classifications is its inability to categorize occlusion when opposite sides of the arch intercuspate in differing molar classifications (e.g. Class II on the right with Class I on the left. See Figure 2AB.
_left_side_molar_class_i__b)_same_patient_as_2a_with_molar_class_ii_on_the_right.jpeg)
Katz in 1992,5 developed a premolar relationship classification that described ‘ideal’ occlusion as a modified Class I, where the most anterior upper premolar fits exactly into the embrasure created by the distal contact of the most anterior lower premolar, irrespective of molar relationship. See Figure 3AB.
_katz_premolar_*modified_class_i*_relationship_on_the_left_side__where_the_anterior_maxi.jpeg)
However, a broad range of normal occlusion patterns are associated with different skeletal characteristics and are representative of dentoalveolar compensation.6
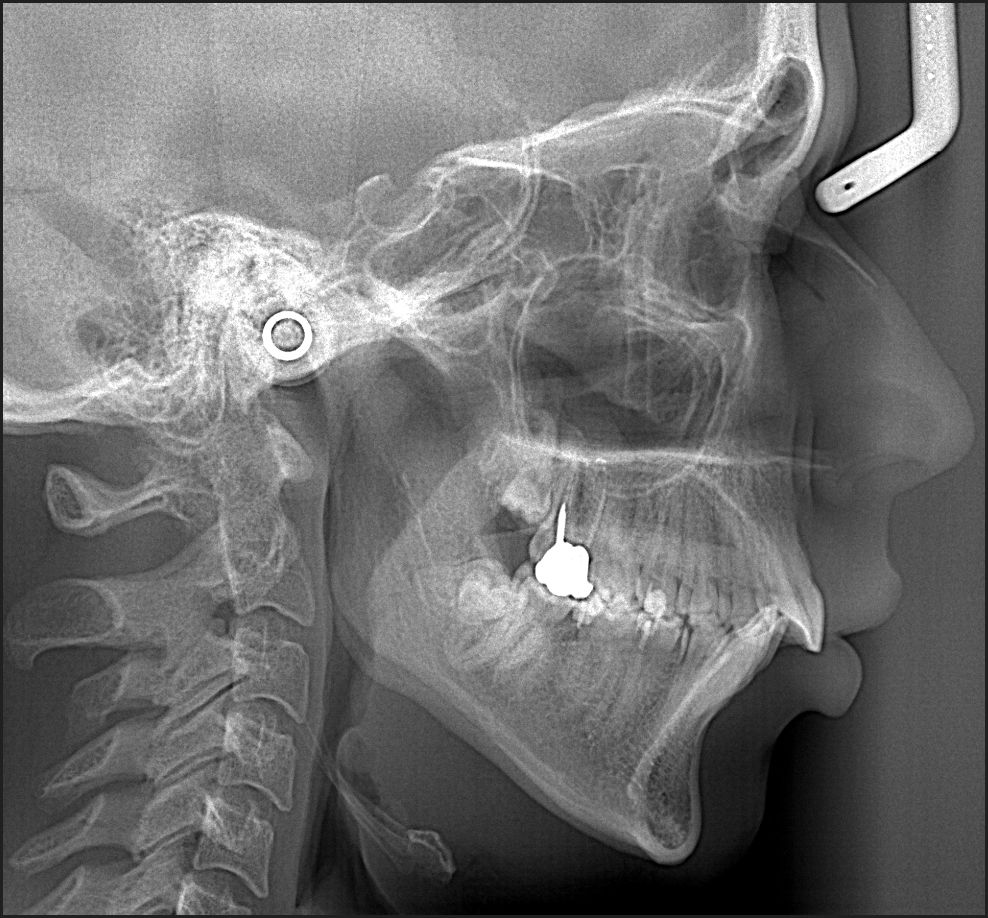
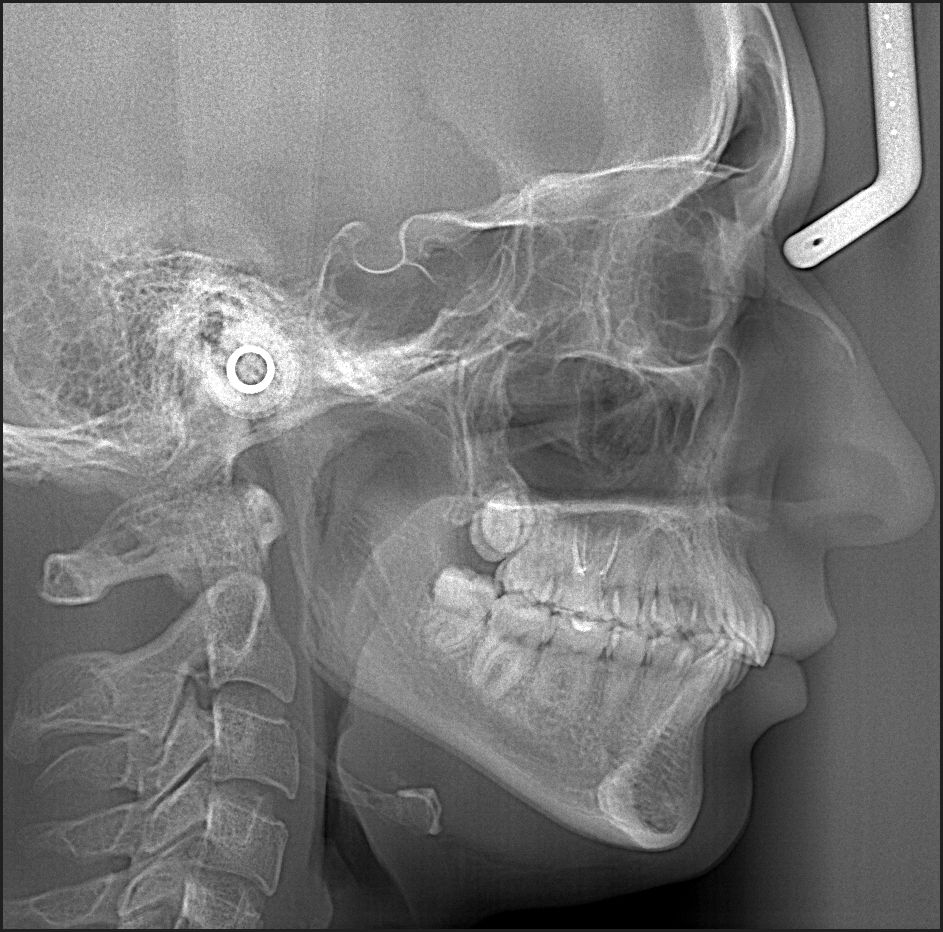
A study by Casko and Shepherd showed that there is a broad range of ANB angles representative of naturally occurring, sagittal, intermaxillary relationships that ranged from -3 - +8 degrees.7,8 These findings were confirmed and further expanded on by Kim,9 who divided normally occurring skeletal patterns into 9 types after mathematically modelling the skeletal patterns that occurred in subjects with Class I occlusion. The 9 types were based on antero-posterior skeletal cephalometric measurements that predict skeletal Class I, II, and III, combined with vertical skeletal cephalometric measurements that predict hyper-, normo-, and hypo-divergent skeletal types. Figures 4A, 4B and 4C.


This study confirmed that dental relationships compensate for the diversity of skeletal patterns, with skeletal Class I and the normo-divergent vertical skeletal type found in 13.9% of subjects. The highest prevalence was skeletal Class III with normo-divergent vertical types (25.5%), followed by skeletal Class II hyperdivergent vertical types (17.7%).8 Thus, dentoalveolar Class I patients can be associated with normo-, hyper-, and hypo-divergent skeletal vertical types. See Figure 5AB.
_right_side_of_a_dentoalveolar_class_i_patient_with_a_hyperdivergent_skeletal_type__b)_l.jpeg)
Although anteroposterior and vertical skeletal characteristics can comprise multiple combinations, one of the least variable skeletal parameters is the Interincisal Angle. In 2016 Mageet 10 suggested Orthodontics revisit skeletal and dental classification, to include 3 categories, with the one being an incisor relationship used by the British Standards Institute (1983): 11
-
Class I-III classifications based on the incisor relationship
-
The canine relationship
-
A modified Angle molar classification, adding Classes IV, V, and VI that describe unilateral Class I, II, and III patients.
The well-accepted notion of canine-protected occlusion most commonly relates to Class I and II relationships,12 and is considered physiologic by some authors.13–17 Others claim that canine-protected occlusion is one of a variety of guidance patterns, all of which are considered normal.18 Interestingly, the most frequently observed occlusal scheme present in Class I patients was balanced occlusion,18,19 although many studies report lower EMG levels result from canine-protected occlusion.14–17,20,21
Besides the dynamic anterior guidance relationships that occur on the working side, there is a long-standing debate on the prevalence of balancing contacts and non-working interferences. Balancing contacts occur broadly in various dental malocclusions, with contacts on the mesial aspects of second molars, and the distal aspects of first molars.19,22–24 Rinchuse suggested that not all balanced occlusion schemes present equally, using the term ‘modified canine protected/group function occlusion’ that emphasized the need for disclusion during lateral excursions, controlled by a ‘dominant’ or working side group guidance.24 Similarly, McAdam advocated for the absence of balancing contacts/interferences along with a canine guided or group function occlusal scheme.25 These authors countered the long-considered ‘stable’ excursive position known as 3-point contact during lateral excursions. This guidance concept described balancing contacts on the non-working side to complement a group function on the working side.26
Instead of defining good occlusion by how well-aligned anatomically are the molars and canines, studies by Qadeer and Cohen-Levy 25–27 assessed “ideal occlusion,” contact force levels and contact timing measurements gathered by T-Scan, from Class I post orthodontic subjects. Both authors reported that Class I occlusion was functionally non-ideal. And separately, they reported post-orthodontic subjects concentrated excessive occlusal force on 2nd molars, and presented with prolonged in time, working side group function guidance mechanisms, rather than canine guidance and posterior disclusion. Importantly, many T-Scan studies performed with simultaneous EMG recordings, repeatedly found that both working side interferences and working side group function occlusal schemes, significantly increased the duration of the Disclusion Time (DT), 14 while elevating masticatory muscle activity into a hyperactive state that resulted in frequently observed, occlusally activated, muscular TMD symptoms.14–17,28,29
OBJECTIVES
The Specific Aims of this study were to evaluate the static and dynamic excursive occlusal relationships in patients with different Angle molar classifications, using the T-Scan 9 digital occlusal analysis system, and compare those findings to prior studies where T-Scan data sets were gathered on both orthodontic and non-orthodontic subjects. This subject group’s digital occlusal data could give insight into how well naturally occurring characteristics of Class I, Class II and Class III occlusions function interdentally. A further objective is to provide new occlusal force and timing data information regarding measured, individual Angle Class occlusion function differences. A last objective was to add to the existing knowledge base about the prevalence of several Temporomandibular Disorder (TMD) symptoms in patients seeking orthodontic treatment.
METHODS & MATERIALS
The T-Scan 9 digital occlusal analysis system (Tekscan Inc., S. Boston, MA USA) measured multiple occlusal function characteristics in 49 patients who sought private practice Orthodontic treatment in Odessa, Ukraine between 2016 - 2017. The 49 subjects ranged in ages 14 - 42 years old (mean age = 25 years). The patient pool was an untreated group of randomly appearing adults who met the following Inclusion Criteria:
-
No missing teeth except for 3rd molars
-
All 8 permanent molars were fully erupted
-
No active orthodontic appliances
-
No removable prosthetic appliances
-
No more than 1 single crown
-
No history of dentofacial trauma
-
No history of surgical intervention in the orofacial area
-
No anterior open bite patients
-
No posterior cross bite patients
-
No history of hyper- or hypothyroidism, depression, anxiety disorders, hormonal treatment, tumors, major surgeries, or hypertension
As there is no clear agreement as to which relationship should be truly classified as “Angle Class I,” this manuscript will refer to the Class I that allows for the +/- ½ molar cusp range mesiodistally. In addition, occlusal schemes in this manuscript will be classified by the presence of working side contacts, but with anterior guidance or canine guidance control being preferred. The term “group function”27 will be applied to subjects where anterior and posterior teeth make simultaneous, translational occlusal contacts as the patient moves laterally out to their excursive border positions.
Utilizing the above guidelines, each subject’s occlusion was classified and grouped as Class I, Class II, or Class III. The Class I subjects presented as canine Class I, with no more than 30% overbite, representative of close to ‘ideal’ Class I molar and canine occlusions. Some of the 49 subjects demonstrated mild-to-moderate crowding, mild arch constrictions, but all anterior teeth generally made to contact with a single pair of opposing antagonists.
Both extra-oral and intra-oral examinations were performed on each subject. Initial pre-treatment intra-oral photographs were also obtained
The occlusal function characteristics measured by T-Scan 9 were:
-
The prevalence of balancing contacts in all subjects
-
The prevalence of balancing contacts in the 38 Class I subjects
-
The mean Class I Occlusion Time (OT)28
-
The mean Class II OT
-
The mean Class III OT
-
The mean Right side - Left side % occlusal force imbalance in all Angle classifications
-
The first closure tooth contact in all Angle classifications
-
The Anterior – Posterior (A-P) % force ratio in MIP in the different Angle Classifications
-
The Disclusion Times (DT) of the right, left, and protrusive excursive movements in all 49 subjects
-
The individual tooth that held the maximum force % in MIP in all 49 subjects
-
The most prevalent occlusal scheme in the 3 different Angle Classifications
Following the clinical examination and prior to the recording of any T-Scan data, each subject’s tooth dimensions and tooth distribution were both entered into the patient’s T-Scan tooth chart and dental arch. Then, each subject underwent a standardized T-Scan digital occlusal analysis protocol, comprised of five specific T-Scan recordings:
-
A Multi-bite patient self-closure into a firmly held MIP
-
A centric occlusion single closure into a firmly held MIP
-
A right lateral excursion made from a firmly held MIP
-
A left lateral excursion made from a firmly held MIP
-
A protrusive excursion made from a firmly held MIP
To improve the patient`s understanding of how to make proper excursive movements that gather high quality T-Scan excursive force and timing data sets, an explanation with a demonstration of the movement was first made by the practitioner. Then the subject repeated the desired movement, while observing themselves in the patient hand mirror.
A correct Sensitivity Setting per patient was determined prior to gathering any T-Scan data. The electronic gain activated only 3 pink (highest force) sensels around the arch, when the patient closed firmly into an HD T-Scan sensor to make complete intercuspation (MIP). The differing occlusal contact force levels displayed result when pressure exerted by teeth on the sensor, elicits differing voltage outputs within each occlusally loaded sensel (known as the Digital Output; DO).
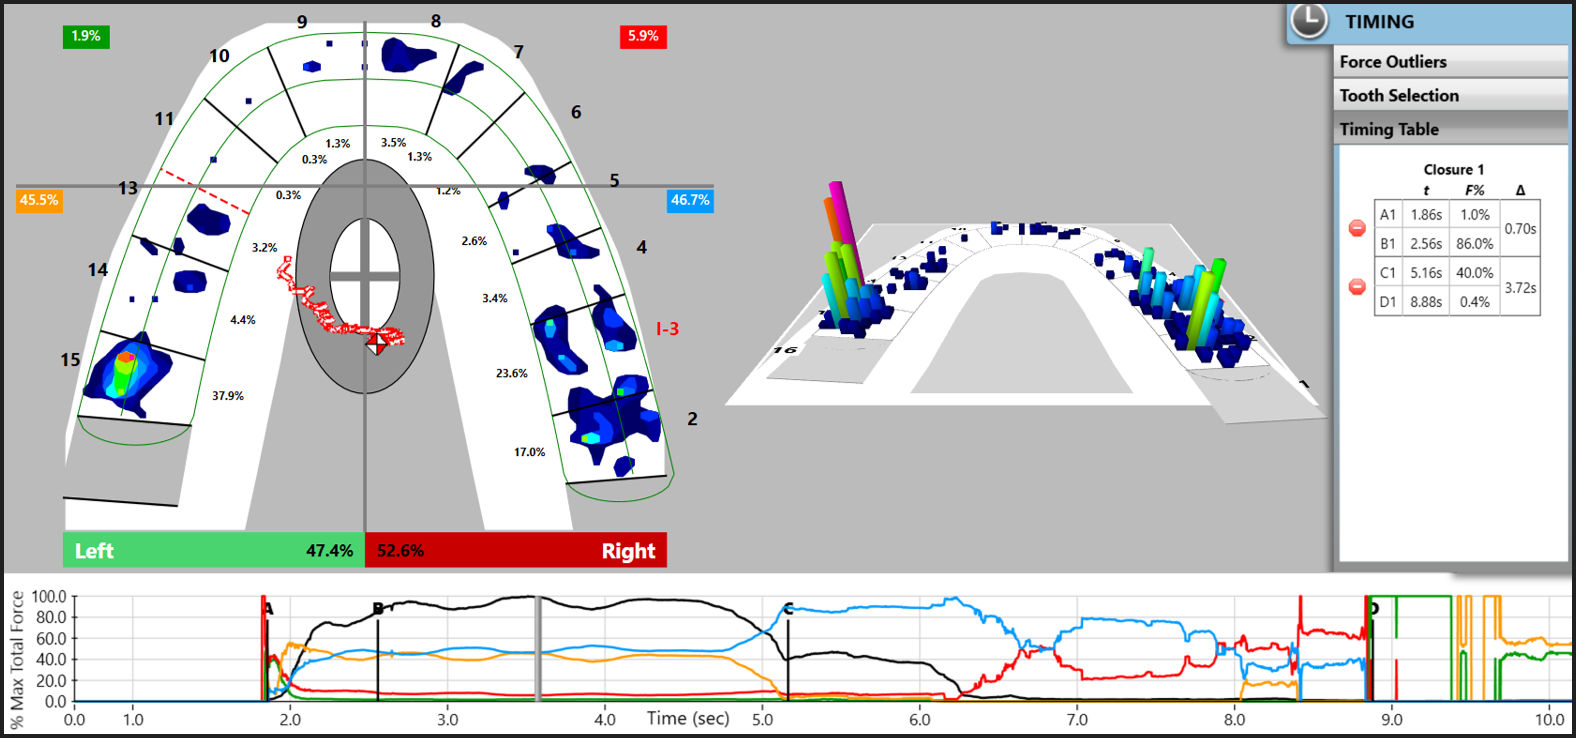
T-Scan recordings were made with the subject seated in an upright in the dental chair. The Centric Occlusion was recorded with the subject occluding on the sensor into MIP, holding intercuspation in MIP for 2-3 seconds, and then opening their mouth. A similar protocol was used for the Multi-bite recording, where the subject closed, held intercuspation into MIP, and then opened and closed into MIP 3 consecutive times during a single recording. (Figure 6; top pane)

During excursive recordings the subject closed on the sensor, held intercuspation in MIP for 2-3 seconds, and then slid their mandible to the right, or left, or forwards, with their anterior teeth maintaining translational inter-arch contacts. Excursive movements were deemed complete when the subject’s lower anterior teeth moved past the canine (or incisor) edge-to-edge incisal position.
The T-Scan recordings were analyzed based on the time-positions of the A, B, C, and D lines in the Force vs. Time graph software feature. (Figure 6; bottom pane)
The A and B lines define the limits of the time-based patient self-closure occlusal parameters, while the C and D lines define the limits of the time-based excursive movement occlusal parameters:
-
A Line – 1st tooth contact
-
B Line - Static Intercuspation when all teeth complete intercuspation during a patient self-closure into MIP. Static Intercuspation always precedes Maximum Intercuspation
-
A-B Time Duration - The A-B period defines the Occlusion Time (OT), which is the elapsed time from the 1st tooth contact until Static Intercuspation.
The Occlusion Time (OT) should ideally <≤ 0.2 seconds, such that longer OT durations indicate slow patient closure speeds, often accompanied by muscular weakness. When OT > 0.2 seconds, many closure interferences and time-early contacts are present during the patient self-closure.17,29–31
-
B-C Time Period - When the patient holds their teeth firmly intercuspating in MIP. No functional movements occur between B-C.
-
C Line - Commencement of an excursive movement made out of a firm intercuspated MIP
-
D Line - The time moment when all working and all balancing molar and premolar teeth are discluded, and solely anterior teeth (canines, incisors) are in lateral excursive guidance contact
-
C-D Time Duration - The C-D period defines the Disclusion Time (DT), which is the elapsed time required to disclude all posterior teeth bilaterally in a lateral excursion made from a firm intercuspated MIP
The Disclusion Time (DT) should ideally be ≤ 0.4 seconds. 14,32 Longer DT durations indicate the occurrence of excess occlusal surface frictional contacts during the excursion 16,28,30,33 that elevate masticatory muscle activity and often cause occlusally-activated muscular TMD symptoms.16,17,30,34,35
The 2-Dimensional T-Scan ForceView window (Figure 6; desktop left arch) was used to identify:
-
The location of first tooth contact at A
-
The % force distribution between the Right and Left sides.
-
The Anterior – Posterior (A-P) % occlusal force ratio – calculated after dividing the 2-D ForceView into quadrants at the distal of the canines bilaterally. This division specifically separates the anterior teeth from the 1st premolar teeth.26
All closure and excursive movement Time Parameters were analyzed by quadrants and by the moving of the B line to accurately indicate true Static Intercuspation, then moving the C and D lines to accurately indicate excursive commencement (Line C) and complete posterior disclusion bilaterally (Line D). With the specific Line placements corrected, the Timing Pane (Figure 6; numerical table at right desktop border) will show correct OT and DT durations for each closure and excursive recording.
Also reported for each excursive movement was the distribution of teeth that made working and balancing contact, and the prevailing occlusal scheme in each subject’s different excursions. This was determined based upon the contacts remaining engaged at the end of the movement. The following occlusal schemes were identified within this 49-subject group:
-
Anterior Guidance - the influence of the contacting surfaces of anterior teeth, controlling mandibular movements.36
-
Canine Guidance - a form of mutually protected articulation in which the vertical and horizontal overlap of the canine teeth disclude the posterior teeth in excursive movements.36
-
Anterior or Canine Guidance with Working Side Posterior Contacts - where the working-side is the side towards which the mandible moved.36
-
Anterior or Canine Guidance with both Working Side and Balancing side (non-working side) Posterior Contacts - where contact occurs on teeth on the side opposite to the direction the mandible moved towards.36
-
Working-side Contacts without any Anterior/ Canine Guidance
-
Working and Balancing side contacts without Anterior/Canine guidance.
The above Occlusal Scheme list does not include the term ‘Group Function’, which is defined as “multiple contact relations between the maxillary and mandibular teeth in lateral movements on the working-side, whereby simultaneous contact of several teeth acts as a group to distribute occlusal forces.” 37 This definition does not clarify the location of the working-side contacts relative to the distal surface of the canine/mesial surface of the first premolar, and therefore does not account for the important neurologic distinction between anterior teeth compared to posterior teeth.32
Dividing the 2-D ForceView into quadrants at the distal of the canines distinguishes the neural reflex that posterior teeth pulpal and Periodontal Ligament (PDL) fibers possess (premolars and molars), that is not present in anterior teeth.32 Posterior tooth neurons are peripheral afferent fibers that directly synapse with the central motor nucleus of Trigeminal Nerve (CN V). This synapse excites motor fibers innervating the Muscles of Mastication, along with the Swallow Mechanism muscles (the tensor veli palatini, the tensor tympani, the anterior digastric, and the mylohyoid muscles).32 This approach to classifying occlusal schemes based on whether or not the posterior teeth are excursively discluded is rooted in many T-Scan studies that repeatedly showed posterior contacts on both the working and the non-working (balancing) sides, contribute to increased Disclusion Time and elevated muscle hyperactivity.16,29,30,32,35
RESULTS
Comparisons between Class I, Class II and Class III found that 9 subjects had different classifications on the left and right sides. The same classifying anatomic factor that was found on both sides of the arch was counted only once. 23 subjects had bilateral Class I occlusions, while 8 had Class I on one side only (24 F, 7 M). 9 subjects had bilateral Class II occlusions, while 6 had Class II on one side only (12 F, 3 M). And 8 subjects had bilateral Class III occlusions, while 4 had Class III on one side only (9 F, 3 M). The 3 Class groups were well matched for gender and no difference was found between mean ages per class (p > 0.05).
The degree of Right-side-to-Left-side force % imbalance, observed between the high force side and the low force side, was remarkably similar in all three groups:
-
The Class I mean high side percentage = 56.9 (+/- 6.51) %,
-
The Class II mean high side percentage = 57.4 (+/- 6.58) %
-
The Class III mean high side percentage = 54.5 (+/- 6.45) % (p > 0.05 for all relationships).
-
For all 3 Angle Classifications = 56.26 +/- 6.51%
These imbalances were considered as moderate, being randomly distributed between the left and right sides in all three groups. (Table 1A)
A statistically significant difference was found between the different Angle’s Classifications regarding the anterior-to-posterior force % distribution (A-P).
-
The Class I group ratio = 9.5 %
-
The Class II group ratio = 18.7 % (p = 0.0213).
-
The Class III group ratio = 10.4 % (p = 0.0997)
Neither the Class I or the Class III groups’ antero-posterior force % imbalance reached significance with respect to the Class II group.
The mean total percentage of force applied to the anterior segment was:
-
Class I group = 9.2 %
-
Class II group = 15.3 (P = 0.051), showing a trend towards significance with respect to Class I
-
Class III group = 8.6 % (p = 0.056) showing a trend towards significance with respect to Class II
The same relationships appeared within the posterior total force percentages:
-
Class I = 90.8 %
-
Class II = 84.8 %%
-
Class III = 91.4 %.
The left excursion Disclusion Time was largest for the Class I group (1.07 +/- 0.64 sec.), which trended towards significance with respect to the Class II group DT (0.081 +/- 0.36 sec.).
The protrusive Disclusion Time of the Class I group was slightly elongated beyond physiologic normal (0.752 +/- 0.548 sec.), and longer than both the Class II and Class III groups, which trended towards significance with respect to both. (Table 1B). The right excursion Disclusion Time was largest for the Class III group (1.307 +/- 1.302 sec.), followed by the Class II group DT (0.992 +/- 0.666 sec.), with the shortest DT being Class I (0.906 +/- 0.528 sec.). Of importance is that no Mean DT in any of the 3 groups was > 0.4 seconds (physiologic normal). (Table 1B)
Within the 49 subjects, only teeth #s 14 and 18 did not have at least one 1st contact occurrence. #26 had the most occurrences = 7. Overall 1st contacts were randomly distributed, with clearly more 1st contacts on the left side teeth. There were more 1st posterior contacts, but there are also more posterior teeth. There were 18 left sided posterior contacts found on 5 teeth = 3.6 contacts/posterior tooth. On the left side, conversely, there were 12 anterior contacts found on 3 teeth, which equals 4.0 contacts/anterior tooth. (Figure 7, Table 2)

DISCUSSION
The functional occlusal parameter findings of this 49-subject population are quite similar to those reported in other T-Scan based research performed on non-orthodontic subjects, although some differences can be outlined.25,26 The first contacts occurred mostly on the left 1st and 2nd molars and the right canines. This agrees with Qadeer who reported initial contacts occurred on the left 2nd molars and the left central incisor teeth.25 When the first contacts were grouped by anterior, premolar or molar teeth, anterior and molar teeth were more likely to receive initial contacts than premolar teeth, regardless of the Angle’s Class.
The results indicate that subjects seeking orthodontic treatment tend to exhibit a moderate right-to-left side imbalance regardless of Angle Classification (with 56% force concentrated on the high side). This is different from Qadeer’s data, where non-orthodontic and post-orthodontic subjects had close to ‘ideal’ right side-to-left side force balance (51.36% - 48.96%).26 A moderate force imbalance between the right and the left sides may be a descriptive characteristic of a malocclusion. In one study on subjects who underwent lingual orthodontic treatment, the authors reported significant imbalances resulted from orthodontic treatment between the right and left sides, providing a rationale for rebalancing occlusal adjustment procedures during the retention stage.27
Qadeer reported the anterior-posterior force imbalance as higher in non-orthodontic patients (22.46% total anterior force) and less in post-orthodontic patients (10.58% total anterior force), when compared to this study’s findings.26 This reported A-P force distribution difference relates to the distribution differences observed in the 3 Angle classifications. In this study a statistically significant difference was found in the A-P force % between the Class I and II patients, with the highest anterior force % seen in Class II subjects (15.3% total anterior force). This greater percentage of anterior force seen in Class II subjects whose front teeth occlude (Class II Division I) results from a greater tendency to restrict the mandible with heavy lingual canine and central incisor contacts.
Often Class I subjects seeking orthodontic treatment complain of crowding and altered contact distribution. Cohen-Levy found that minimal anterior contacts existed at the end of orthodontic treatment.27 However in this study, a high incidence of 1st contacts occurred on anterior teeth, which coincided with the reported percentage of anterior forces, especially in the Class II group. The higher the number of anterior 1st contacts, the greater the chance that these early contacts may eventually rise to high contact forces.
The prevalence of canine guidance reported in this study was high (57%), when compared to 19% bilateral canine guidance reported by Scaife 12 and Weinberg,37 and much higher than the 2% rate of bilateral canine protected occlusion reported by Ingervall.38
The results determined slightly shorter right and left Disclusion Times in this group of patients seeking orthodontic treatment to Qadeer’s non-orthodontically treated patients.25,26 The Class I mean right and left DTs in the current study = 0.906 sec. and 1.071 sec., respectively, while Qadeer reported right and left DTs = 1.45 sec. and 1.27 sec.25,26 These reported differences may be related to a higher incidence of canine guidance patients in this study’s population. But these time differences may also have resulted from differences in the excursive recording technique, and Force vs. Time graph C and D Line placement, which are operator driven procedures owing to individual variances. Additionally, in this study, the Class III group had longer Occlusion Times compared to the Class I and II groups. But why Class III patients closed more slowly into complete intercuspation is unclear from the gathered data.
Although in this study the right side-to-left side force % imbalances were moderately consistent between the 3 Class groups, Cohen-Levy determined that large right side-to-left side force % imbalances could result after orthodontic treatment, that often caused pain on molar teeth with the highest force percentages.27 The authors relieved the discomforts with T-Scan guided occlusal adjustments made to the high force contacts. Koval corroborated this phenomenon in a lingual orthodontic Case Report, where high forces (measured with T-Scan) caused patient discomfort during and after the completion of tooth movement.39
LIMITATIONS
The primary limitation was the limited samples of Class II (15) and Class III (12) occlusions. It is likely that with larger samples in these 2 Angle Classes, some of the trends may have reached significance, or become more clearly non-significant.
CONCLUSION
This study evaluated 49 subjects seeking orthodontic treatment that presented with all three Angle Classifications of malocclusion. The analysis showed the different Angle Classes displayed many non-ideal occlusal function characteristics (including Class I), indicating that visual assessments of “ideal occlusion” do not create ideal occlusal function. T-Scan digital occlusal analysis provided reliable and reproducible data on the number of first contacts, the distribution of occlusal forces, the right side-to-left side force % imbalance, the Occlusion Time (OT), and the Disclusion Time (DT). These measured occlusal assessments visualized a high degree of occlusal function detail, far more evidently than can be determined with traditional outcome measures involving the visual inspection of the occlusal contacts, the inter-arch contacts, or the tooth alignment.
Funding Statement
No funding of any kind was received.
Conflict of Interest Statement
Dr. Kerstein is a clinical consultant to Tekscan, Inc. South Boston, MA USA