


Introduction
Medical and Dental technological advancements continue to provide a broader scope for research, and have led to faster and safer diagnoses, and superior treatment outcomes resulting in more comfortable patients, and a healthier dental community.
Dental malocclusion is a very common and prevalent dysfunction for which patients seek treatment. It is common that orthodontic treatment is applied to both dental and skeletal malocclusion, without necessarily studying the temporomandibular joint condition or the occlusal contact bite force distribution. Yet it is necessary for the treating clinician to completely understand the Condyle-disc spatial relationships as well as the health of the mandibular fossae, to achieve harmonious treatment outcomes with respect to treating the occlusion.
However, some dentists advocate that there is no need to investigate the TM Joint stability because they (incorrectly) believe that it will not change their treatment, regardless of any structural TMJ problems. It is important to recognize that any dental intervention (including orthodontics), is at risk for relapse/failure if the TMJ foundation is unstable. Therefore, in the planning of any occlusal treatment, the TMJ function should be equally as important to evaluate as are the teeth and the periodontium. Additionally, the muscular physiology in the head and neck is unique, as teeth play an important neurologic role in maintaining system homeostasis. Today, with the available biometric technologies, the TM joints, the masticatory muscles and dental occlusal interrelationships can all be studied in great physiologic detail.
Biometric techniques in Dentistry utilize the computerized analysis of the teeth, the TM joints, and certain associated muscles using 4 digital technologies:
-
T-Scan 9 (Tekscan Inc. S. Boston, MA, USA) for the objective evaluation of a patient’s occlusion, synchronized with surface electromyography.
-
BioEMG III (Bioresearch Assoc., Inc., Milwaukee, WI, USA) a surface electromyograph that is synchronized with the T-Scan 10 for evaluating muscle activity levels at rest and during excursions.
-
JT-3D (Bioresearch, Assoc., Inc. Milwaukee WI, USA) axillanathography provides 3-dimemsional incisor-point tracking for analyzing dynamic mandibular movements.
-
BioJVA (Bioresearch Assoc., Inc. Milwaukee WI, USA) Joint Vibration Analysis for evaluating the dynamic function of the TM Joints as an aid to the precise diagnosis of and treatment planning for Temporomandibular Disorders (TMDs) patients.1
T-Scan10 is dentistry’s only clinically recognized and research-validated digital occlusion analysis system.2,3 T-Scan provides quick, dynamic occlusal measurements that reveal the relative intensity of forces and timing of contacts on individual teeth that occur during clenching and all excursions. It can be used in diagnoses to detect occlusal stability of the overall bite. An ultra-thin, (100 microns uncompressed) and consistently uniform Mylar-encased sensor is placed between a patient’s teeth to record changing tooth-tooth contact relative force levels and timing sequences. The handpiece is connected to a computer workstation via a USB interface. This combination of relative forces from dynamic tooth contact and timing data provide a clinician detailed, precise, and unparalleled diagnostic and treatment planning occlusal measurement data, which allows one to address many different clinical occlusal pathologies.4 The displayed relative occlusal force and timing data aids in the examination and treatment of occlusal abnormalities on natural teeth, dental prostheses, and dental implant-supported prostheses.5
It is ideal to evaluate the Temporomandibular Joint status first, as treatment options may be limited by any structural joint breakdown. This can be done quickly and easily with Joint Vibration Analysis that uses tissue accelerometers to objectively capture vibrations given off by structurally compromised internal TM Joint anatomy. Vibrations are gathered during repeated mandibular opening and closing. JVA can make a very accurate negative diagnosis of “good function” or no “internal derangement” with a specificity of 98% according to the dental literature. For pathological conditions, the diagnosis may be tentative, but often correct and signals the need for an MRI or CBCT for a patient. A structurally compromised TM Joint breakdown leads to altered mandibular movement patterns during chewing function.6 Different vibration patterns have been linked to various Temporomandibular Joint pathologies, making Joint Vibration Analysis an essential Temporomandibular Joint diagnostic adjunct in the clinic. A JVA finding of significant TM Joint pathology can justify employing sophisticated diagnostic imaging like MRI.7 The differing vibrations are characterized by Amplitude and Frequency, which describes numerically, the energy associated with a particular internal TM joint dysfunctional event.8 Studies have shown that JVA is very capable of detecting joint pathologies with a 98% specificity and between 70 and 95% sensitivities, depending on the condition.9,10
After the introduction of T-Scan I technology in 198411 to the field of Occlusion, a very important occlusal functional movement parameter was isolated, known as Posterior Disclusion Time.12 The Disclusion Time (DT) is defined as the elapsed time in seconds, required for a patient to exit maximum intercuspation (MIP) and move right, left, or forward, to disclude all the posterior teeth, such that only canines and/or incisors are in tooth contact.12 Prolonged Disclusion Time (due to prolonged occlusal surface friction that occurs between opposing posterior teeth during mandibular excursions) is proportional to elevated levels of masseter and temporalis contractile activity that occurs during excursive movements.12–14 Many studies since 1991 have consistently demonstrated that the prolonged Disclusion Time and elevated masticatory muscle levels recorded using surface electromyography (sEMG), are etiologic for Occluso-muscle Disorder symptomatology (the muscle hyperactivity subset of Temporomandibular Disorders symptoms).13,15–17 The evaluation of sEMG activity can be very helpful in detecting axilla-mandibular mal-relation, functional muscle imbalances and/or occlusal interferences during function.18
With these Biometric tools evaluating the TM joint, the masticatory muscles, and the teeth in patients with mal-occlusions, an opportunity exists to establish a pre-treatment set of biometric normative values. These sets of signature patterns may be unique to a certain type of malocclusion. Hence, studying malocclusion in patients who seek orthodontic or complex restorative procedures before any treatment is rendered, using JVA and T-Scan synchronized with EMG, will help clarify whether a pre-existing disc displacement, an abnormal amount of bite force or increased Disclusion Times are present. These combined digital data sets that are able to characterize dental malocclusions, can aid in the understanding of how relapse to a symptomatic state can be prevented following complex treatments like orthodontics, implant-based rehabilitation, and other restorative dental procedures. This same digital data may simplify prognosticating the outcome of orthodontic treatment rendered in cases of malocclusion, while shedding light on the neurophysiologic status of the patient’s masticatory system function in the presence of a deranged occlusion.
Specific Aims and objectives of this study were to assess in Angle’s Class I, II and III malocclusion patients:
-
The Occlusion Time (OT)
-
The Total Force percentages as distributed at maximum intercuspation
-
The Bite Force distribution between the left and right arch-halves
-
The Disclusion Times (DT) of the right, left and protrusive excursions
-
To determine if any correlations exist between the above measured occlusal parameters obtained from the three Angle’s skeletal Classes and the physical conditions of disc displacement, hyperactive musculature and abnormal bite.
Materials and Methods
This was a prospective in-vivo study conducted in the Department of Oral Medicine & Radiology, SDM College of Dental Sciences and Hospital, Dharwad, India. Sixty-eight patients were included in the sample of those who visited the department seeking treatment for the correction of a malocclusion and for routine dental check-ups. Forty-eight of the subjects were female (70.6 %) and twenty were male (29.4 %). The protocol was reviewed by the SDM College of Dental Sciences and Hospital Institutional Review Board and ethical clearance was obtained. A signed informed consent was obtained from participating subjects.
Inclusion Criteria
-
Bilateral Angle’s Class I, Class II (and their subdivisions) and Class III malocclusion patients, who were not actively seeking TMD treatment, absent of active wear facets, small TM joint noises and without any substantial dental complaints.
-
Asymptomatic patients willing to undergo Orthodontic or complex restorative treatments to correct their malocclusion
-
Patients willing to undergo testing with Biometric technologies
Exclusion Criteria
-
History of previous orthodontic treatment.
-
History of chronic pain in the TM Joint region.
-
History of migraine or recurrent headaches, jaw pain, dizziness, vertigo, and ear tinnitus, suggestive of Occluso-Muscle disease.
-
History of any prior or ongoing TMD treatment utilizing splints, Neuromuscular Orthotics or other.
-
History of TM Joint Surgery or Arthrocentesis
Biometric Examination Procedure
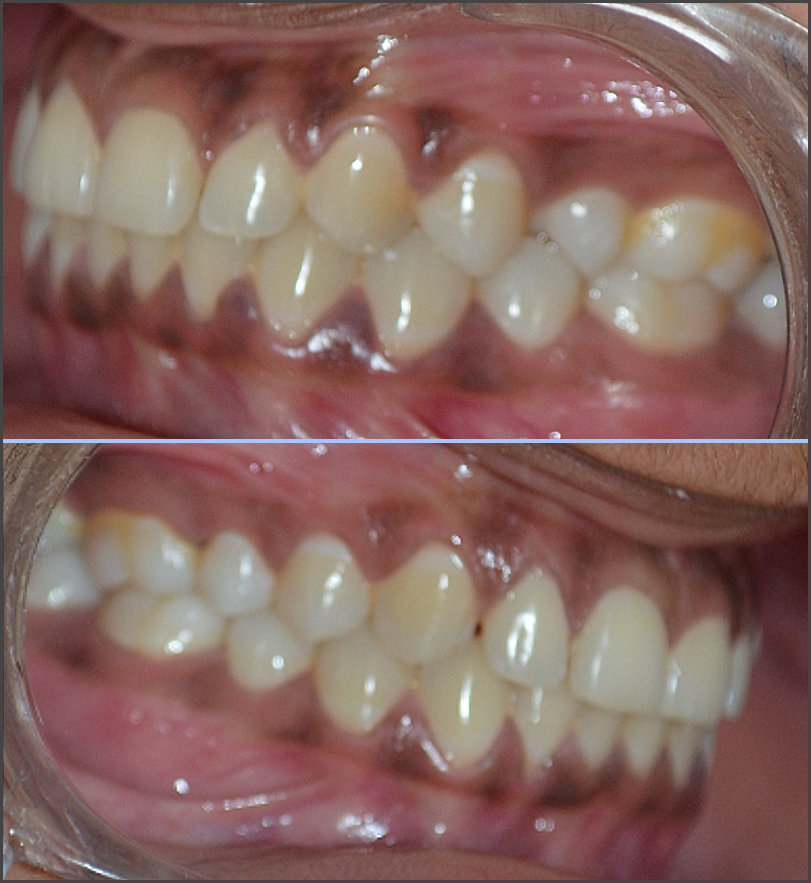
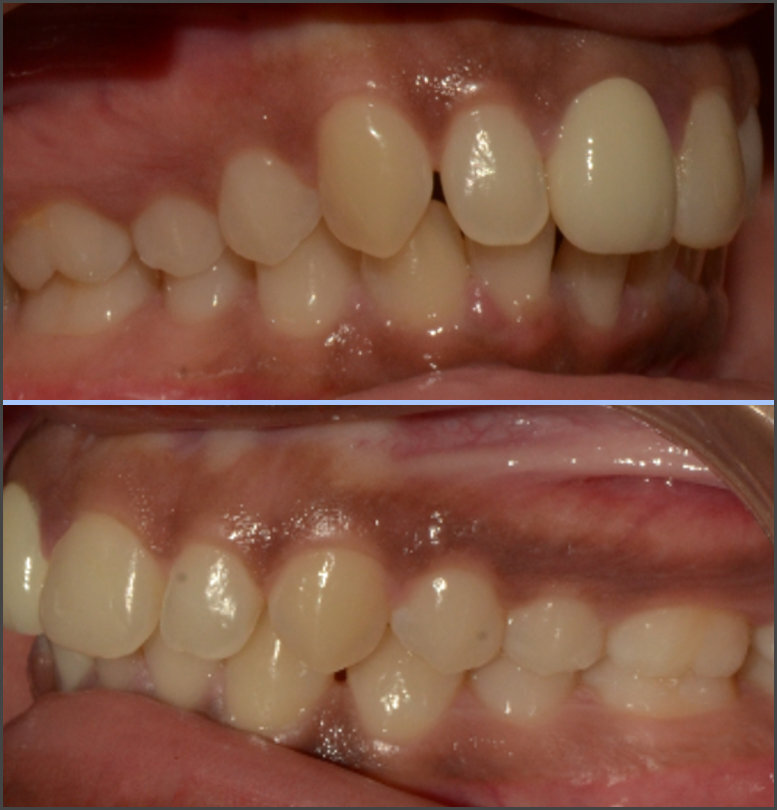
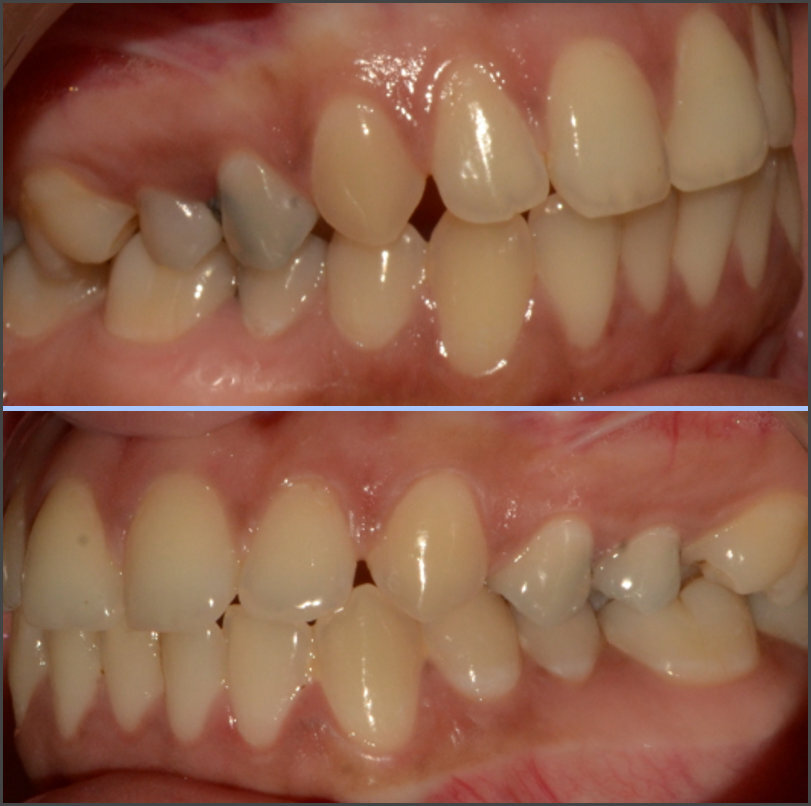
The included subjects’ occlusal evaluation was performed based on their Angle’s Class (Figures 1, 2 and 3). Twenty-three patients were assigned to the Angle Class I and II groups, and 22 others were assigned to the Class III group. All subjects underwent a clinical evaluation and an additional evaluation using JVA, T-Scan and BioEMG III.

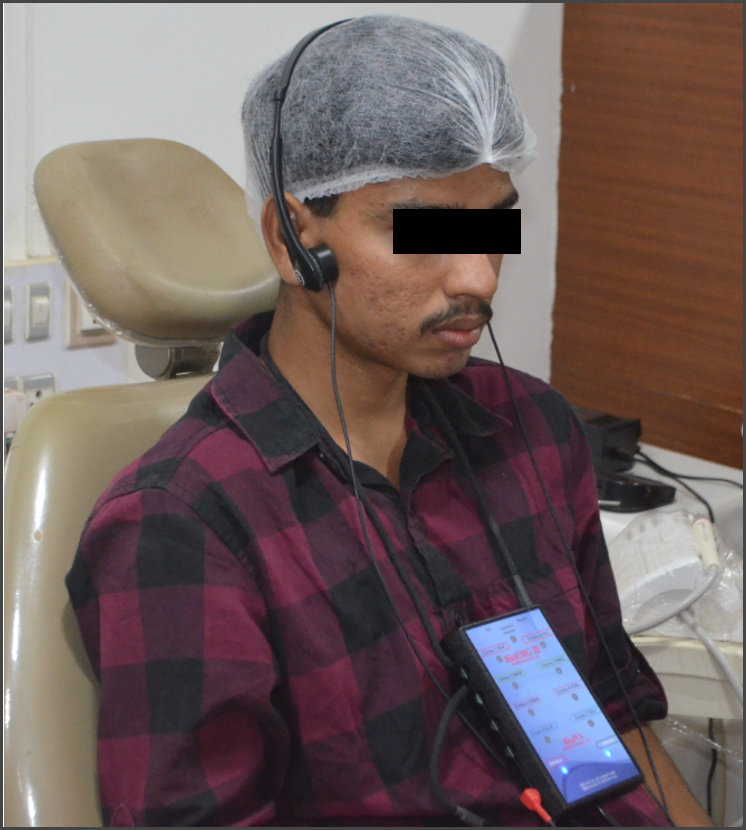
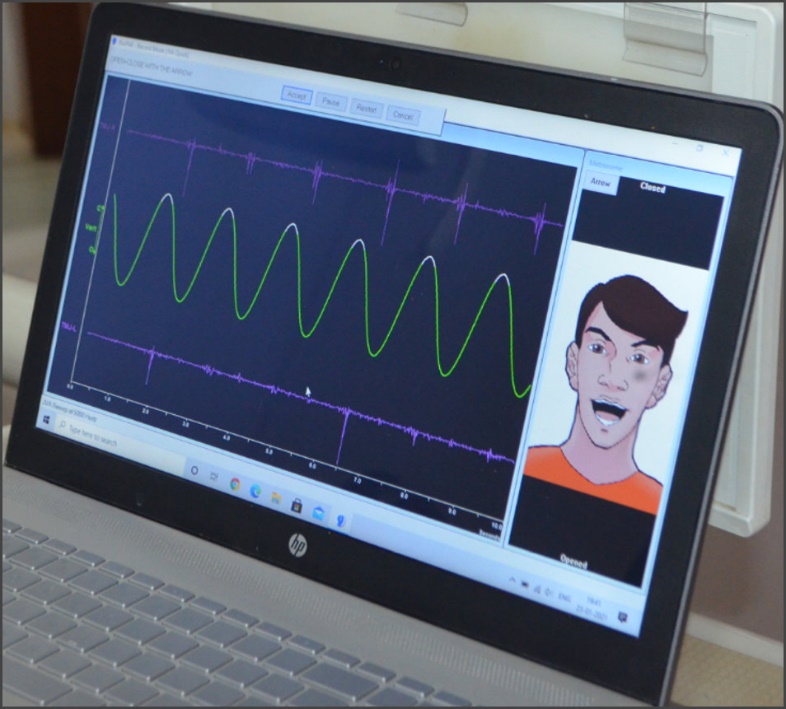
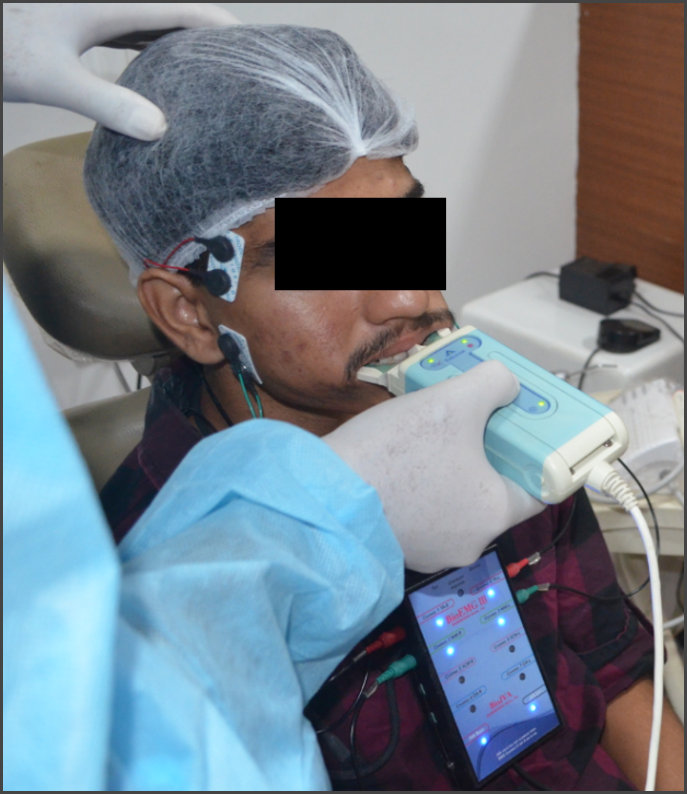
The Joint Vibration Analysis test was performed by asking the patient to sit upright in the dental chair with their head positioned with their Frankfort horizontal plane parallel to the floor. To maintain good hygiene, the skin over both TM Joints was cleaned with 75% isopropyl alcohol and dried. The JVA accelerometers were placed precisely over both Temporomandibular Joints. (See Figure 4) All patients followed a metronome on the computer screen, which was used to control the rate of opening and closing to improve the consistency between recordings. See Figure 5.


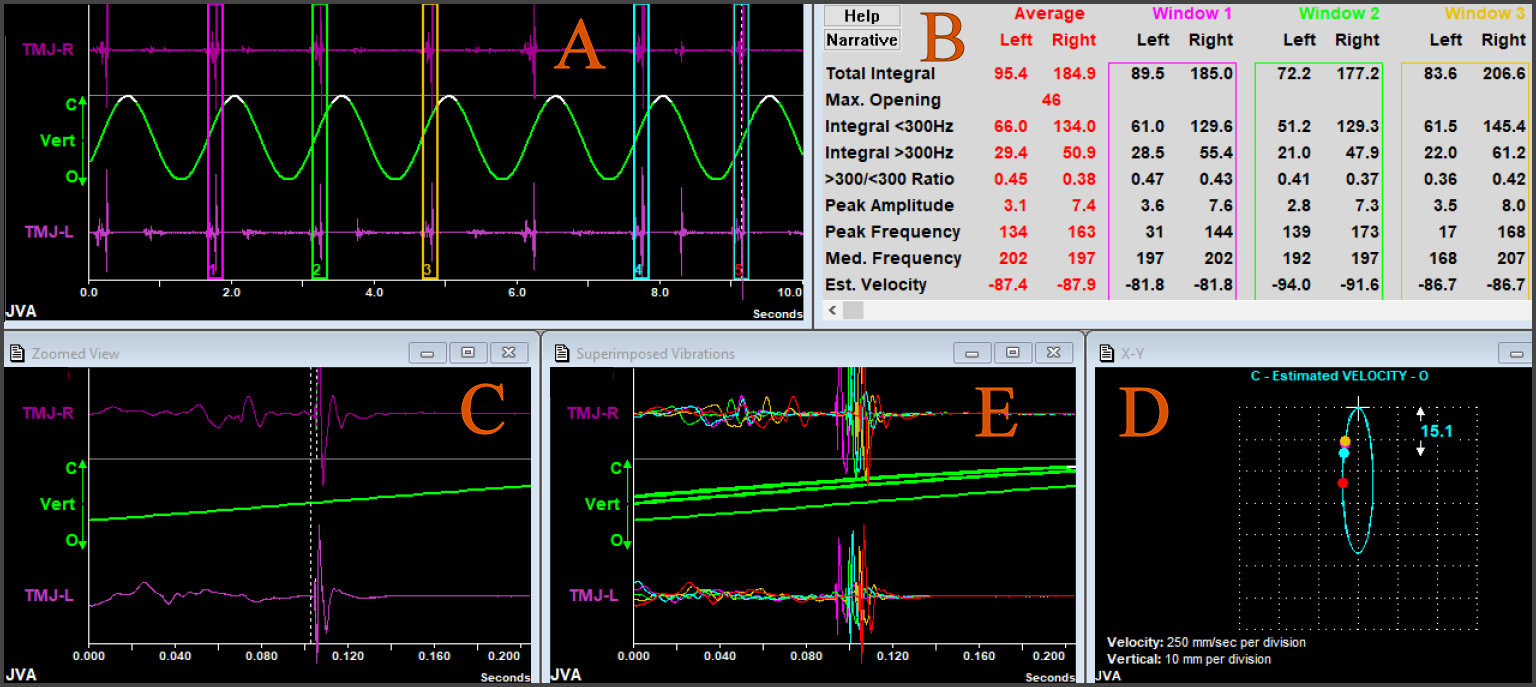
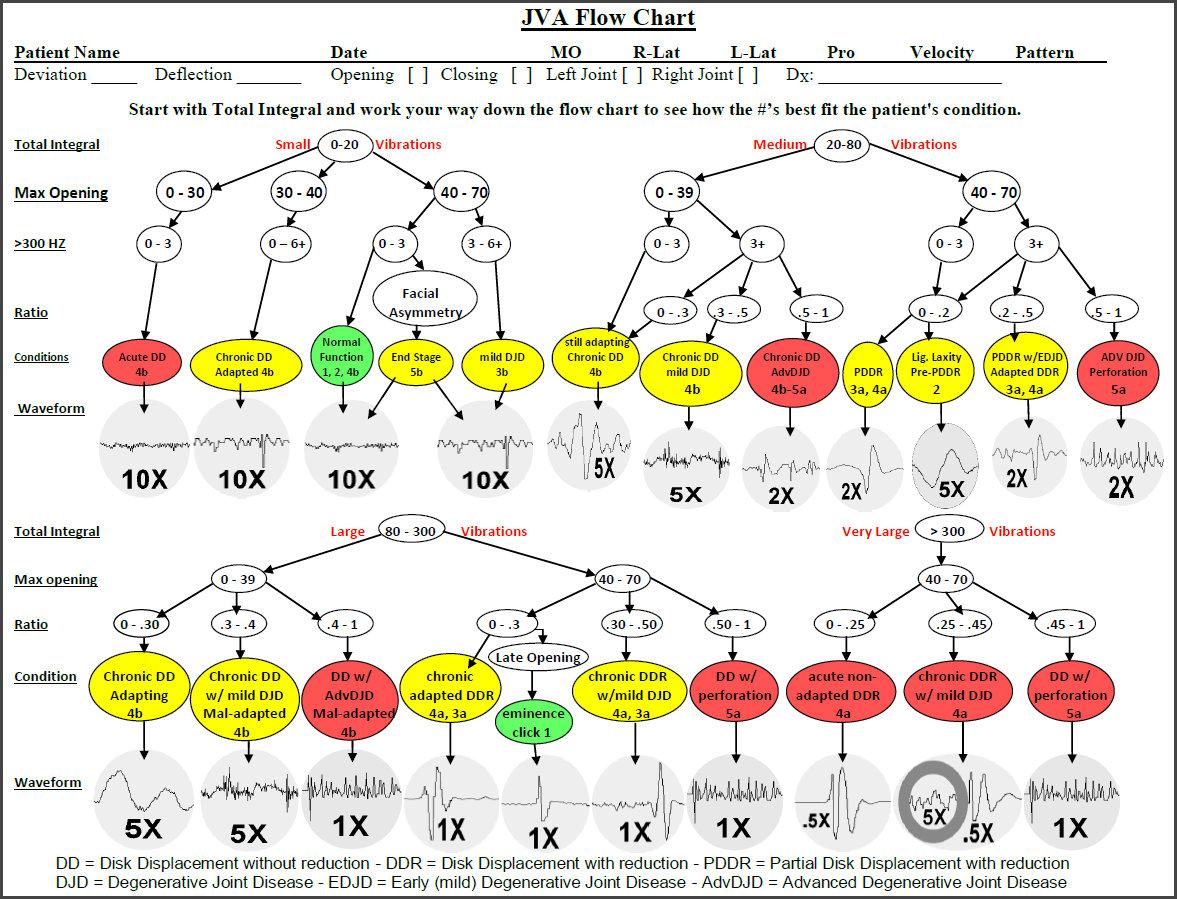
The JVA traces for all Class I, II and III subjects (Figure 6) were interpreted based upon:
-
The Range of Motion (ROM) – (the measurement of range of motion is required either with a ruler, caliper or with a jaw tracker when recording JVA and to use the JVA flow chart). Note: In Figure 6 the ROM was measured in advance and entered into the computer program before starting the recording.
-
The Total Integral
-
The Amplitude of each detected vibration
-
The Frequency of each detected vibration

The four measured JVA parameter values, (Total Integral, Maximum Range of Motion [ROM], > 300 Hz Integral and the Ratio of > 300 Hz Integral/< 300 Hz Integral) were compared to those on the standardized JVA diagnostic chart (Figure 7), to arrive at a probable internal derangement diagnosis observed in each malocclusion Class.
._it_was_validated_through_resear.jpg)
For the T-Scan and BioEMG analysis, a similar skin preparation preceded the placing of disposable silver/silver chloride, self-adhesive bipolar surface electrodes on the anterior temporalis and masseter muscles, parallel to and over the bulk of each muscle’s fibers. The digital occlusal parameters were recorded using the T-Scan 9 computerized occlusal analysis system.
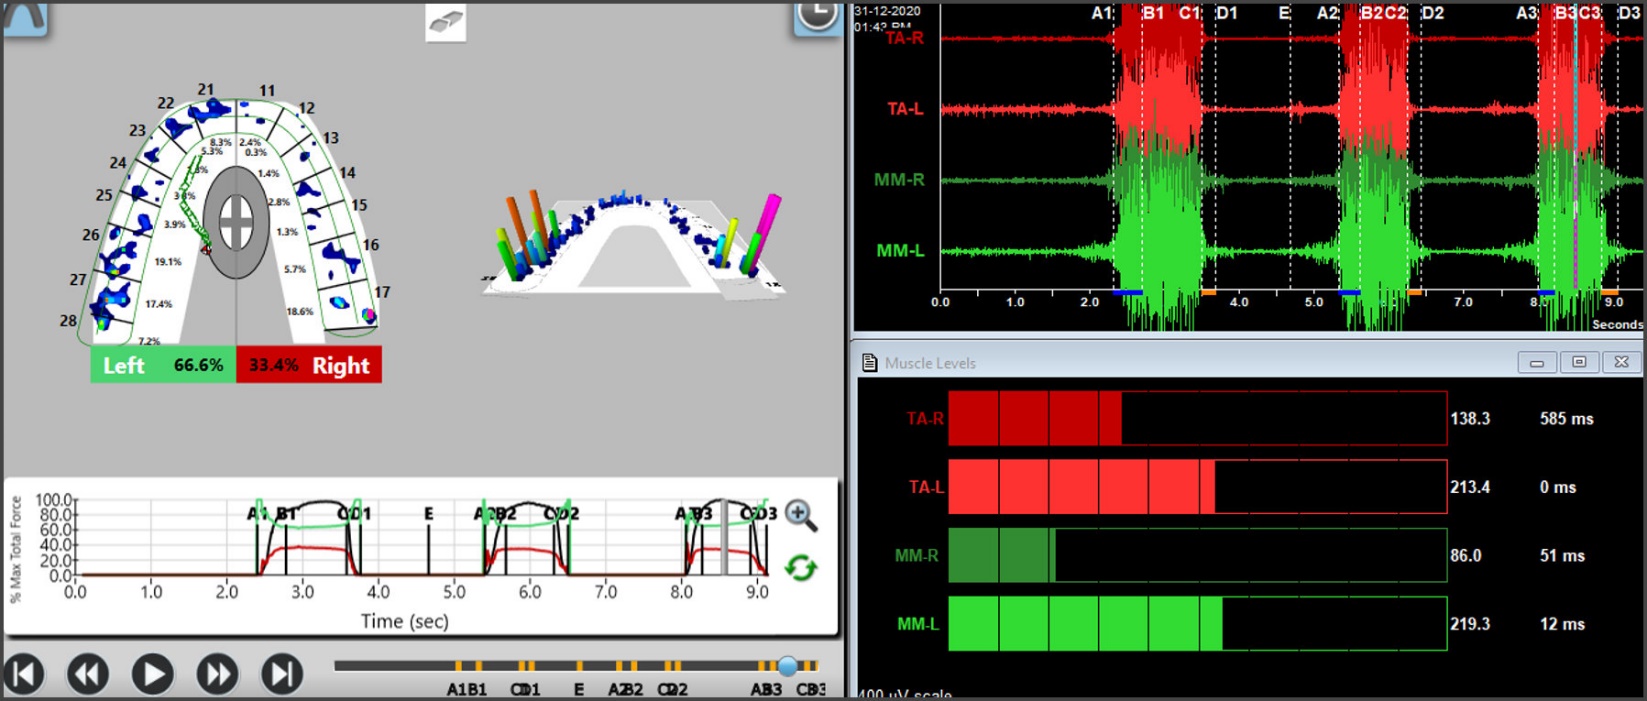
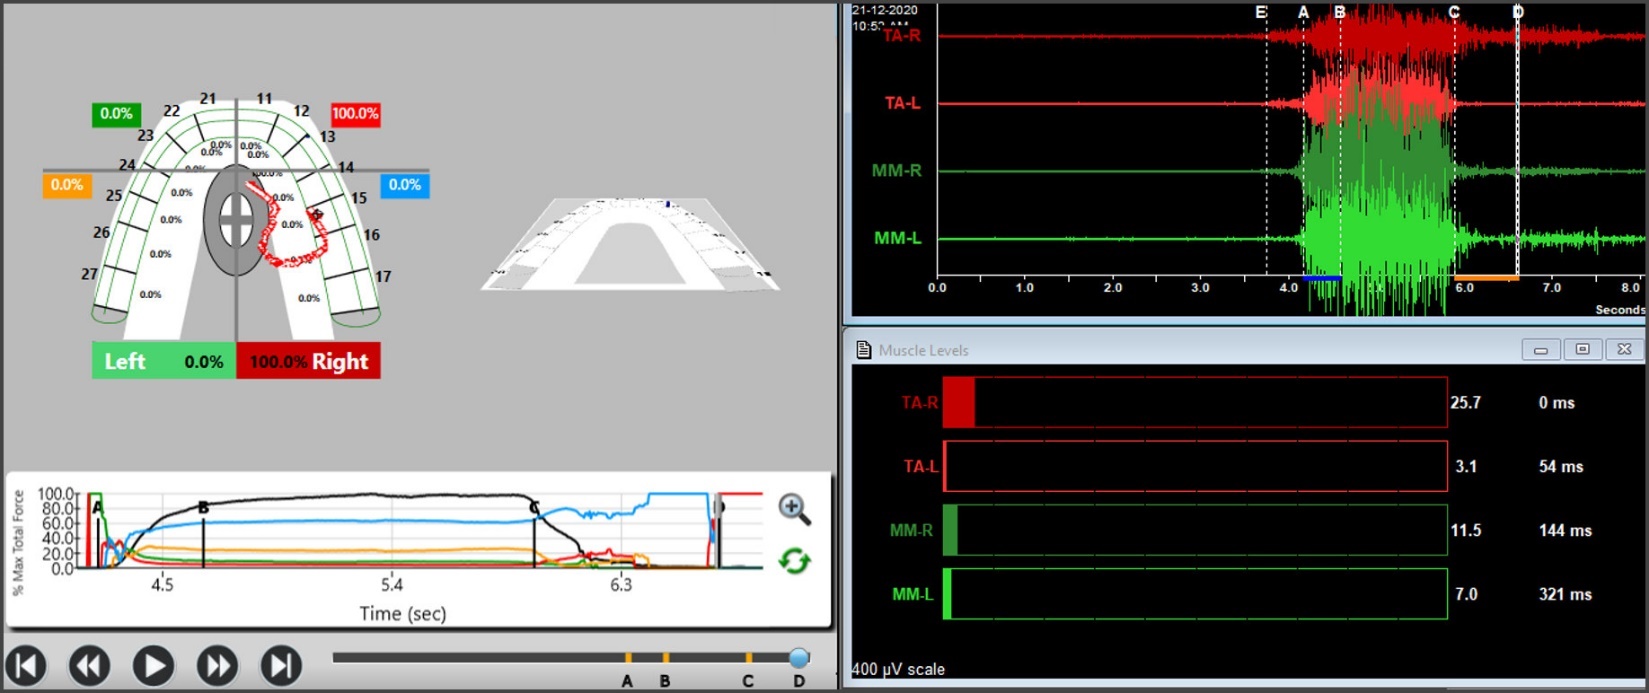
Before T-Scanning the occlusion, the computer display of the T-Scan dental arch was customized to match each patient’s teeth and implant situation. The patient again sat upright in the dental chair with their Frankfort horizontal plane parallel to the floor. The patient position did not change during the recordings while the subject bit down on the sensor. Subjects were trained to close onto the sensor and firmly intercuspate into (MIP), and to make excursive movements from that firm complete intercuspation. The recording sensor was placed intraorally between the dental arches to measure a real-time-sequence data, including relative occlusal force, force balance between arches and simultaneous muscle activity, as the subject made various movements (maximum intercuspation, left and right excursive) across its recording surface. The synchronized T-Scan/EMG technologies (Figure 8) were used to record the right and left excursions of all subjects closing into their Maximum Intercuspal Position (MIP) firmly, holding their teeth together for 1-3 seconds, and commencing a right or left excursion until only anterior teeth were in contact. This specific recording method ensured that high quality Disclusion Time and EMG data were obtained from all subjects (Figure 8).

The Occlusion Time was calculated from the initial contact to static forceful intercuspation. The Disclusion Time (DT) was calculated from the last timeframe of complete intercuspation in MIP, until all posterior teeth bilaterally were discluded and only anterior teeth were in contact. The presence of working and balancing side interferences was also noted during the excursive movements. Three sets of recordings per excursion were made to detect intra-operator errors.
Occlusal Bite Force Analysis
The Bite force parameters analyzed from the T-Scan/EMG data for the three Classes of malocclusion were:
a. Percentage of Bite force on the Right & Left arch-halves seen on 2D Force view. (Figure 9)

b. The force distribution based on Center of Force trajectory, either by the outer grey Standard Deviation zone, or the inner white Normative zone, or whether the COF icon sat outside both the white and grey zones, as seen in 2D-Force view (Figure 9)
c. The Occlusion Time (OT), which describes the degree of closure sequence bilateral time-simultaneity present (The A-B time-duration in Figure 9).
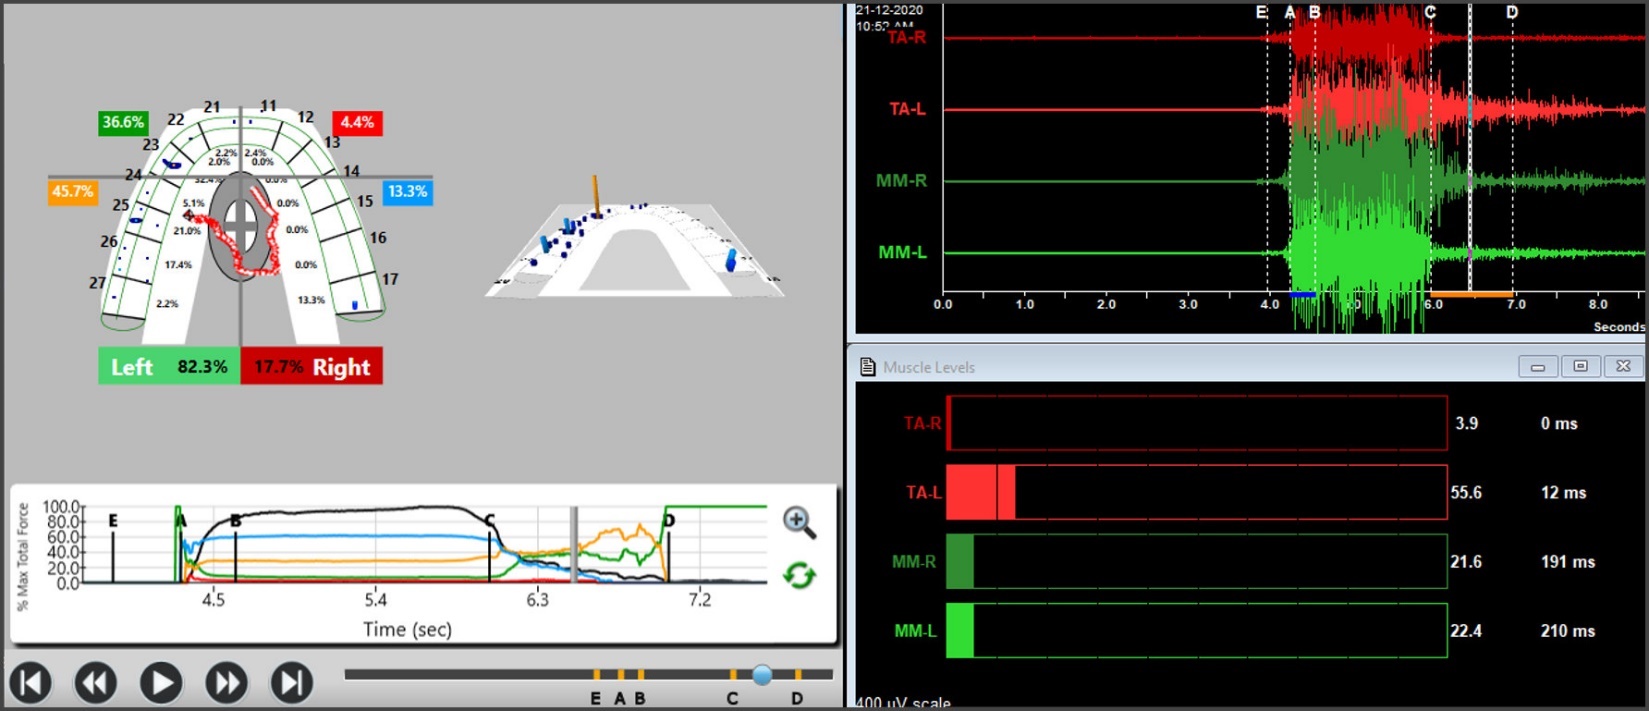
d. The Disclusion Time (DT), which is the elapsed time in seconds, measured from the beginning of an excursive movement made in one direction (right, left, or forwards) with all teeth in complete intercuspation through until only canines and/or incisors are in contact (The C-D time-duration in Figures 10 & 11)
_prolonged_left_disclu.jpeg)

e. The Resting state, Maximum Intercuspation (MIP) (Figure 9), and the excursive movement muscle hyperactivity (Figures 10 & 11), as measured with the T- Scan/BioEMG in all three Classes of malocclusions.
Statistical Analysis
The data obtained from the study was subjected to statistical analysis using SPSS 20.0 software (IBM, Armonk, NY, USA). The Chi-square and ANOVA tests analyzed the significant associations between the studied parameters and the 3 Angle Classes (p ≤ 0.05) (Figures 12-20).
Results
Forty-eight (70.5%) patients were female with a mean age of 23.5 years and twenty were male (29.4 %) with a mean age of 20.1 years. The 68 subjects were divided into three groups according to the Angle’s molar relationship (23 in Class I; 23 in Class II; and 22 in Class III).
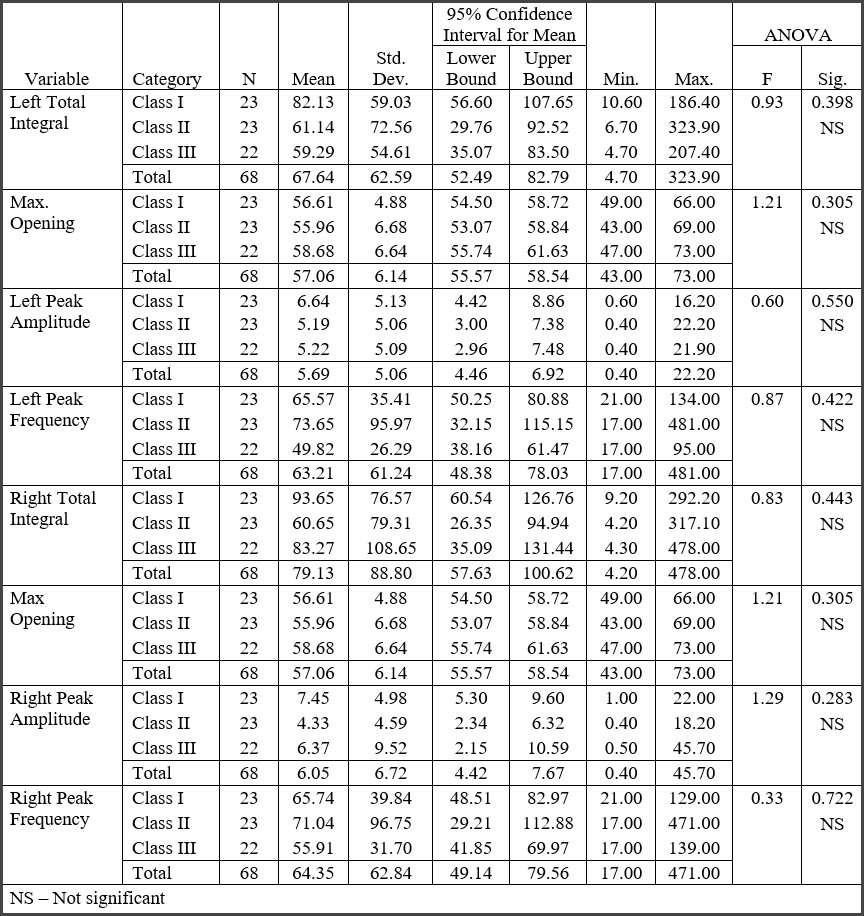
The JVA mean values of parameters (maximum mouth opening, left and right joint Total Integral, left and right joint Peak Frequency and Peak Amplitude) were analyzed for all three Classes of malocclusion with the ANOVA (Figure 12). The studied variables did not significantly differ between the 3 Classes of mal-occlusion and all subjects in each Class demonstrated a normal Range of Motion with mouth opening = 55-62 mm.

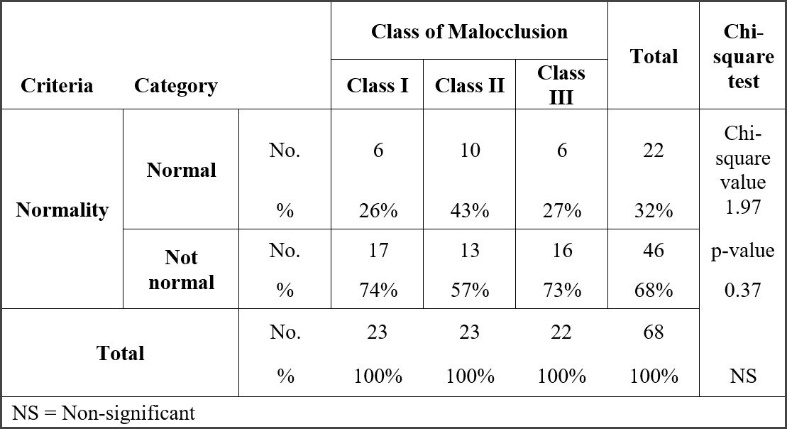
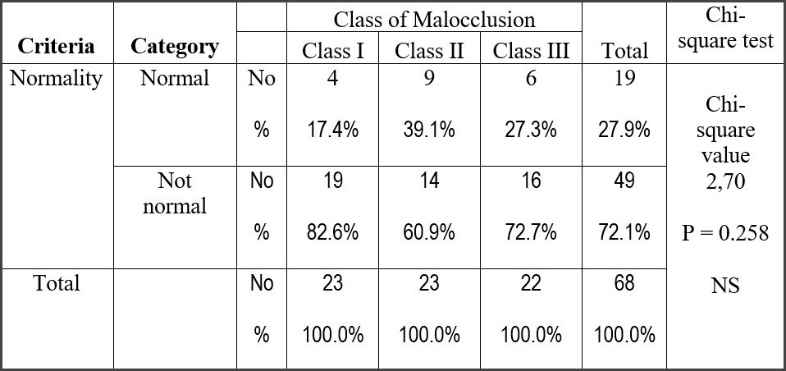
Applying the JVA chart by Piper Classification to arrive at a probable internal derangement diagnosis per class of malocclusion, determined left and right joint normal and non-normal subject designations for each class of malocclusion (Figures 13 & 14). The Class II mal-occlusion group had the highest number of normal subjects compared to the other two classes. However, the Chi-square test found no statistically significant differences between the Classes.
.jpeg)
.jpeg)
The subjects with normal ROM and very quiet TMJs had significantly lower left and right JVA values of the Total Integral (< 20), the > 300 Hz Integral (< 3.0), the Ratio of frequencies < 300 Hz/> 300 Hz (< 0.2) and the Peak Amplitude (< 3) compared to the Non-normal subjects. The distributions are shown in Figures 13 and 14.
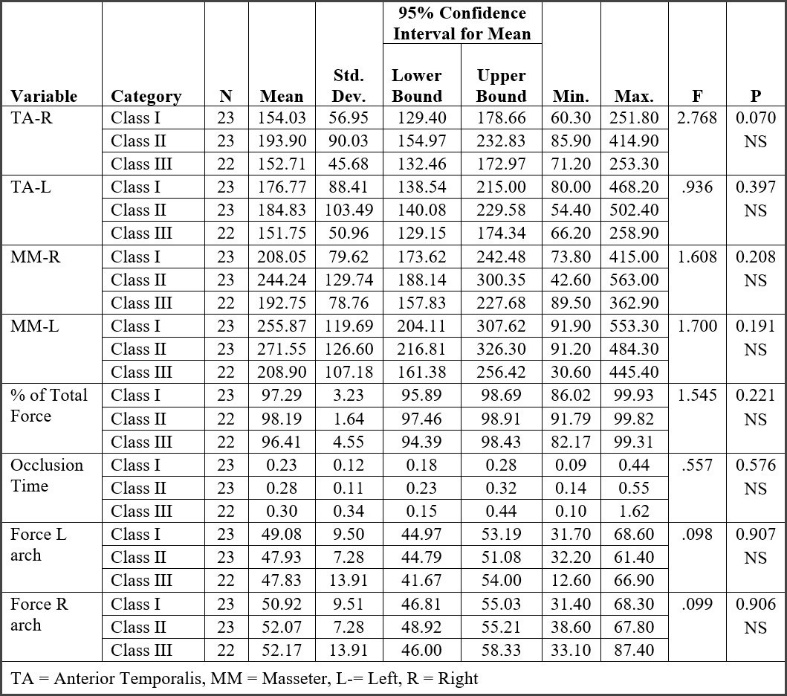
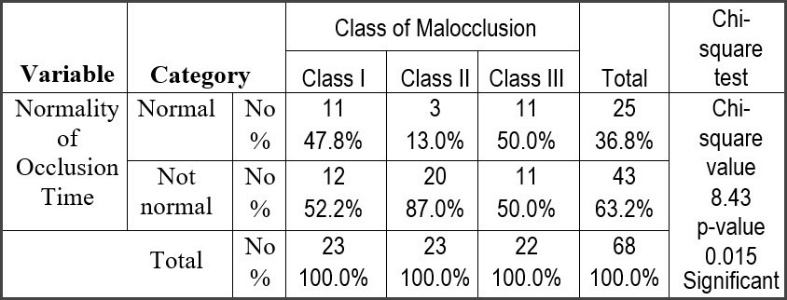
Figure 15 describes the results for maximum bite force, Occlusion Time (OT), the force distribution between arch-halves, and the EMG activity of bilateral temporalis and masseter muscles at maximum intercuspation (MIP). Using ANOVA no significant differences were found between these occlusal parameters in the 3 Classes of malocclusion. Again, all subjects within each Class were classified as normal and non-normal according to the known physiologic Occlusion Time (OT < 0.2 seconds). See Figure 16. The Chi-square test indicated that the Class II malocclusion group had a significantly higher number of individuals as “Non normal” with respect to the Occlusion Time (OT).

_or_not_normal_occlusion_time.jpeg)
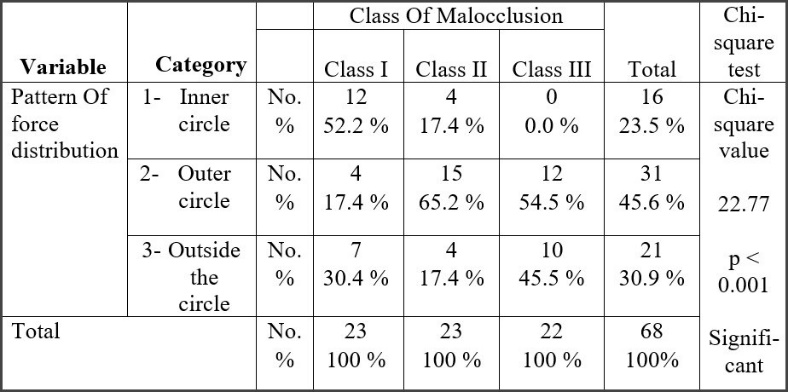
The comparison of percentage of people with different force distribution patterns (i.e., Center of Force (COF) in inner white normal zone, outer grey Standard Deviation zone, or completely outside the COF target) (Figure 17) found the Class III subjects had no individuals in inner white normal zone (0%), with the highest number of subjects completely outside the COF target (45.5%), while the Class I subjects had highest number of individuals within the inner white normal zone.

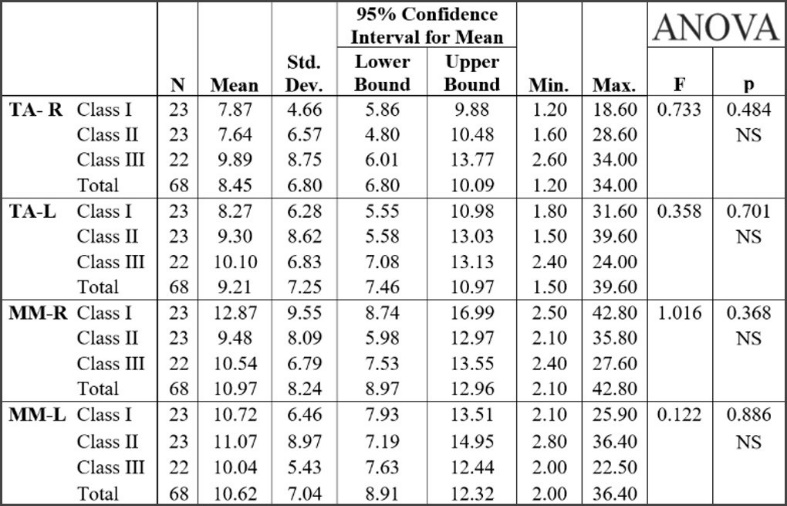
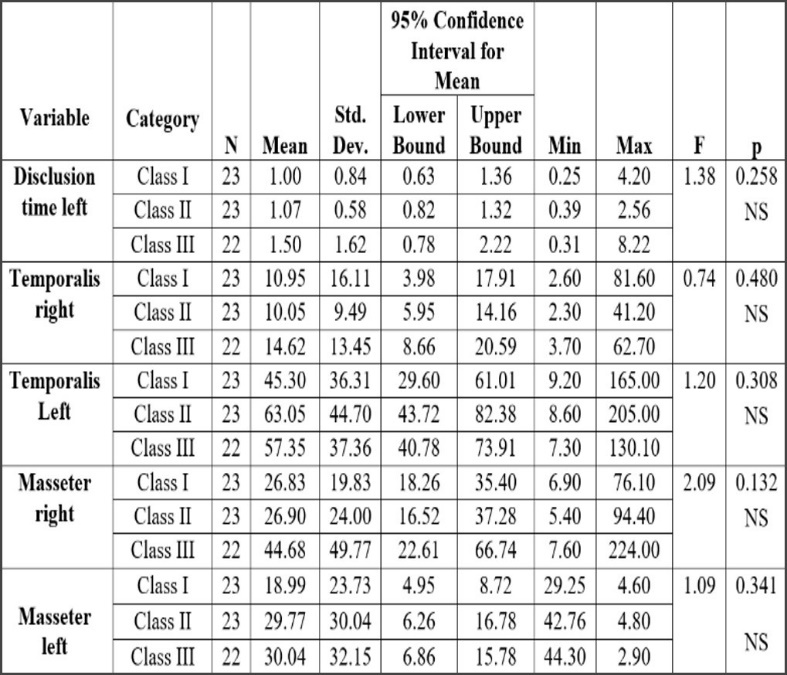
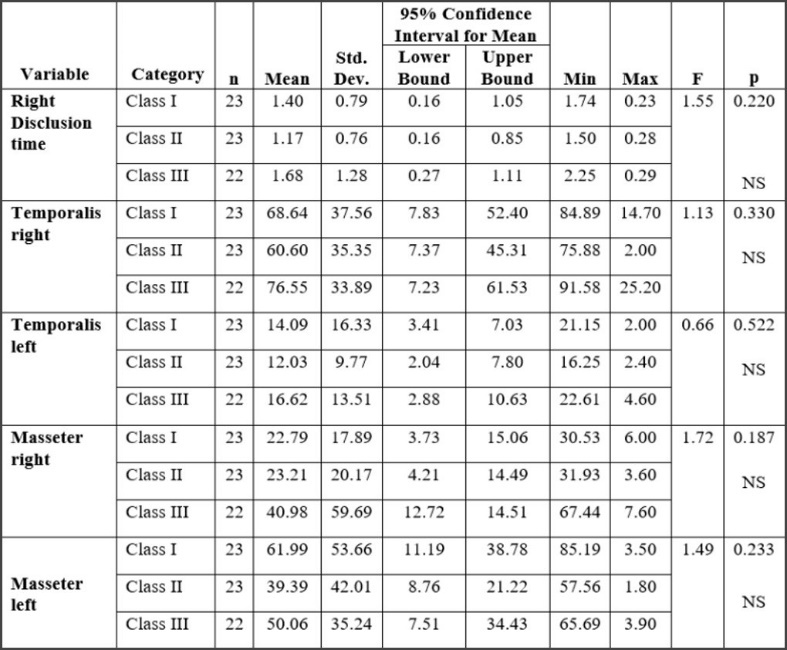
Figures 18 and 19 show the excursive movement parameters (the left and right Disclusion Times (DT) and the activity of bilateral temporalis and masseter muscles). No statistically significant differences were found between Classes for these parameters within the 3 Classes of malocclusion. Figure 20 shows the resting EMG activity.

Discussion
In patients with healthy/normal occlusion, there always exist a synergistic and coordinated firing and relaxation of the elevator and depressor muscles of mastication.19 The sensory factors responsible for supporting the masticatory coordination are the inputs from the teeth, from the muscles themselves, from the periodontal ligaments, from the tongue and from the oral soft tissues. Dental patients seek treatment for malocclusion because of irregular alignment of teeth, inability to chew properly, frequent cheek biting, speech problems, poor esthetics and difficulty breathing. In cases of malocclusion, the muscle firing coordination is altered or reduced,19 which can direct excessive forces vectoring onto the posterior band of the articular disc.20 Over time, this can progress into disc laxity and eventual partial or complete displacement. Altered or displaced discs make both audible and inaudible vibrations that are indicative of the disruption of the normal, smooth functioning of the various components of the TMJs.21 In contrast, the fully normal TM joint produces only the minimum of vibrations under function.22 Therefore, the diagnostic value of evaluating the vibrations helps identify a healthy vs. a diseased TM joint status, even in otherwise asymptomatic patients.23
In the present study, the normal occlusion subject group had total integral vibration energy within the normal range of 0-20 Pascal-Hz24 (Figure 12). Utilizing the JVA flow chart, many Class I and III patients demonstrated partial disc displacement with reduction, (Piper Stage IIIa with Total Integral ranging between 20-80 Pascals),25 with a few subjects demonstrating complete disc displacement with reduction (Piper Stage IVa with total integral ranging between 80-300 Pascals). And most of the Class II subjects demonstrated ligament laxity (Piper Stage II).
A vibration’s Peak Amplitude and Peak Frequency both describe the energy associated with a particular TM Joint dysfunction, with the Peak Frequency revealing the chronic nature of the underlying disease. A frequency value near to but < 300 Hz indicates TM Joint chronic disease,23 whereas a frequency well below 300Hz indicates a soft tissue pathology while frequencies > 300 Hz indicate the condyle may be making bone-to-bone contact with the skull base.25
In the present study, the Peak Frequencies in all 3 Angle Classes were < 300Hz, indicating most subjects had mostly soft tissue conditions. When a vibration’s Peak Amplitude > 6 Pascals it is often audible, but < 6 can be inaudible to the patient.26 Class I and Class III subjects had more audible vibrations compared to Class II subjects.
After interpretation of all the combined JVA parameter values, (Total Integral, Peak Amplitude, Peak Frequency and Ratio), the results showed that all subjects who demonstrated the normal ranges of these parameters (the Normal subjects) had statistically significant lower values of the total integral, peak frequency and peak amplitude, compared to the Non-normal group (Figures 13 & 14). These findings are consistent with a previous study from Durrani et al,27 that used JVA to detect TMJ vibrations in their asymptomatic patients. The authors found that 5 out of the 20 subjects (25%) had underlying TM Joint pathology, with all the above-mentioned parameters being lower in the normal joints compared to the abnormal ones. It then is important to note patients can be completely asymptomatic in terms of reported complaints and still have abnormal JVA parameters and underlying TM Joint pathology. Both the present study and the prior Durrani study highlight the role that JVA can play when detecting pathologies that a patient is unaware of. It can indicate that some treatment is needed (or not) to prevent further TM joint disease progression.
An ongoing controversy exists as to whether genetically determined facial morphology influences the contractile strength of the masticatory muscles,28 or if a very strong musculature contributes to the form of the face.29 This present study attempted to decipher whether muscle activity levels or other physical factors (Occlusion Time, Disclusion Time, the pattern of force distribution between the arch-halves) were associated with a particular Angle Class. Figure 15 shows the EMG activity of the bilateral temporalis and masseter and the T-Scan recorded values for the Occlusion Time, the Maximum Intercuspation, the Total Relative Force and the arch-half force distribution obtained with T-Scan/BioEMG Multi-Bite recordings. These synchronized data sets identified the dynamic effect a tooth contact or groups of tooth contacts sequentially have on the masticatory musculature’s response with respect to each Angle’s Classification.
The Total Force % of the subjects’ maximum clench can indicate their potential occlusal strength. Class I total force percentage = 97.29%, Class II total force percentage = 98.19%, and Class III total force percentage = 96.41%. However, there were no total force percentage significant differences between the 3 groups, which agrees with the prior findings of Sandhu, et. al.30
Occlusion Time is deemed ideal when < 0.2 seconds.31 An ideal Occlusion Time indicates that both arch-halves of the occlusion quickly sequentially contact, but it does not qualify the force equality of each arch-half; only the time-simultaneity of all the occlusal contacts (regardless of arch half) from first contact until static intercuspation. An increased Occlusion Time (OT > 0.2 seconds) indicates the patient is slow to fit their teeth together and may have muscular compromise from premature contact that can occur during an attempted intercurspation.32
In the present study, the Class III mean Occlusion Time (OT) was longer than both Class I and II, and the Class III right side-to-left side force imbalance was larger than in both the Class I and Class II groups, which agrees with the prior findings of Koval S et al.33 However, neither of these parameters was significantly different between the 3 Angle’s Classes (Figure 16) and when considering ideal Occlusion Time (OT) as being a normal range, the Class II group had significantly higher numbers of Non normal Occlusion Time subjects when compared to both the Class I and III subject groups (Figure 17).
The Center of Force Trajectory, Icon, and Target all appear in the T-Scan 9’s 2-Dimensional Force View. The Icon marks the location of the summed total occlusal force generated by all the contacting teeth at any given moment in a T-Scan recording. The inner white zone represents the area where 68% of the normal occlusal population MIP force summation can be found, whereas outer grey Standard Deviation zone is where 95% of the normal occlusal population’s MIP Force summation can be found.32 In the present study, the Class III subjects had no subjects within the white most normal zone (0%) and had the highest number of subjects (45.5%) outside the entire COF target Standard Deviation area (Figure 17). With many Class I subjects within the COF normative white zone, it appears that a more normal skeletal relationship better distributes occlusal forces within the arches, than does an end-on skeletal alignment with edge-to-edge incisal relationships (as in Class III).
In the 3 Angle’s malocclusion subject groups studied, when the Occlusion Time (OT) was normal, the force distribution between the arches was more equal, and the bilateral muscular contractions were more equally shared.31,33–36 Ideally, in an asymptomatic subject with a normal occlusion, the amount of muscle activity in a muscle pair (e.g. right masseter – left masseter) should be bilaterally similar. However, with malocclusions the relationship of the mandible to maxilla is altered, also altering the muscular balance; causing some muscles to contract more than their counterpart or inhibiting the counterpart muscle from contracting. In the present study, the subjects in all three of Angle’s Classes demonstrated non-uniform bilateral muscle activity (Figure 16) suggesting that many subjects could have maxillo-mandibular relationship discrepancies. But the EMG results showed no significant differences between the 3 Angle’s classes, which was in agreement with prior studies performed by Sandhu et al30 and Miralles.37
Excursive functional movement recorded with T-Scan 9 assessed the Disclusion Time (DT) and the existence of any posterior occlusal surface friction.12 In many previous studies prolonged Disclusion Time has been shown to be a major triggering factor for muscle hyperactivity and Occluso-muscle disease symptoms.12,37,38 Of the various occlusal factors that contribute to prolonged Disclusion Time, the Angle’s skeletal classification is important. In one 80 patient study by Kerstein,39 the Disclusion Time (DT) statistically varied between Angle’s Classes, with the worst mean Disclusion Time observed in anterior open occlusion subjects = 1.8+ sec.; Class II = 1.7 sec., followed by Class III = 1.3 sec., and shortest seen in Class I = 1.2 sec.39 In the present study the longest DT was observed in the Class III subjects (Tables 7 & 8) concurring with Kerstein’s previous findings, as this study did not include any open anterior occlusion subjects. Class III patients have very shallow anterior guidance surfaces predisposing Class III patients to posterior interfering contacts. Importantly, no studied Angle’s Class had normal mean Disclusion Time (DT < 0.4-0.5 seconds per excursion), indicating that without occlusal intervention, ideal Disclusion Times do not necessarily develop.
The integration of T-Scan and BioEMG allows the clinician to record occlusal contacts and the corresponding electrical potential of the masticatory muscles simultaneously, allowing the clinician to correlate the effects of teeth on the masticatory musculature. In a normal excursive movement, the non-working temporalis does not fire. In the present study in many left and right excursive movements, hyperactivity in the non-working temporalis was detected, indicating there was posterior occlusal surface friction present in all 3 Angle Classes. The maximum mean left and right excursive hyperactivity was seen in the Class III malocclusions (Figures 18 & 19) where excursive guidance contacts are very shallow (or absent), and rarely do they disclude the posterior teeth.
In normal patients with ideal occlusion there will be very low resting muscle activity levels, (1-2 microvolts).35 Low muscle activity during rest is attributed to less required mandibular posturing. When there is a compromised maxillo-mandibular relationship, posturing may result to compensate for the mal-relationship. This can appear as EMG spiking from larger motor units due to fatigue of the smaller motor units from posturing the mandible. In the present study, no significant difference in resting muscle activity was found between the 3 Angle’s Classes. But there was > 2 microvolts resting EMG in many asymptomatic subjects (Figure 20). In these subjects, an unconscious auto-adaptive mechanism likely attempted to compensate for the malocclusion.
Conclusion
Although all the included Angle’s Class I, Class II, and Class III subjects were clinically asymptomatic, with the help of biometric diagnostic technologies, it was determined that many subjects had abnormal TM Joints, poor bite force distributions and/or electromyographically recorded muscle hyperactivity (including Class I). Regardless of the skeletal relationships and a lack of reported symptoms, biometric digital analyses revealed many underlying conditions that could not be otherwise detected, thereby revealing the true neurophysiologic nature of a masticatory system that must operate in the presence of a malocclusion. Clinicians should understand that pre-existing masticatory system abnormal conditions may deleteriously impact a complex orthodontic or prosthodontic treatment outcome.
Statement of conflict of interest
Dr Kerstein is a Consultant for Tekscan, Inc. S. Boston, MA, USA. He receives no compensation for sales of any Tekscan products. John Radke is the Chairman of the Board for BioResearch Associates, Inc. and receives no commissions on sales. The remaining co-authors declare no conflict of interest.
Funding sources
No commercial or other funding was received.