Processing math: 100%
1.
Thumati ProfP, Radke J, Thumati DrRP, Vijayakumar DrM. EMG and Jaw Tracking Evaluation of Masticatory Function after Full Mouth Reconstruction. Adv Dent Tech. Published online August 30, 2021.
Download all (18)
  • Figure 1. Thirty-four measurable masticatory movement parameters that are commonly recorded with incisor-point trackers. SD = Standard Deviation, AP = Antero-posterior, Max. = Maximum, Ave. = Arithmetic Mean.
  • Figure 2. This is a graphic depiction of the Average Chewing Pattern (ACP) in three dimensions from a Class I fully dentate control subject with good occlusion. The black lines describe the Mean Control Group ACP, the red (opening) and cyan (closing) lines are the individual patient’s ACP for comparison. Note how closely the shapes of the subject’s patterns concur with the normal group mean patterns.
  • Figure 3. Nine EMG mastication parameters that are commonly recorded to evaluate the change in the quality of masticatory muscle function. SD = Standard Deviation.
  • Figure 4. This graphic image of the Average Chewing Cycle from a control group (n = 60) shows the inter-relationships between the bilateral anterior temporalis and masseter muscles. It can be used to evaluate the relative normality of a patient’s muscular activity including the hierarchy of contraction intensity.
  • Figure 5. The golden proportion as applied to the vertical dimension of occlusion.
  • Figure 6. The Golden Proportion applied to the face relates best to the mesofacial form.
  • Figure 7. The Median Shimbashi Measurement from the CEJ of the upper central incisors to the CEJ of the lower central incisors is ideally 18.0 (+/- 1.0 mm) among Class I ideal occlusion control groups.
  • Figure 8. The JT-3D incisor-point tracker and BioEMG III amplifier applied to a potential reconstruction patient.
  • Figure 9. A pre-treatment ACC from one of the patients in this study. Ta-R (non-working temporalis) is the second most active, exceeding the working temporalis. The hierarchy (1 – 3 – 2 – 4) of the muscle activity is less than ideal and represents an adaptation to the present functional condition. The elevator muscles do not completely relax during opening and the Peak activity is closer to the End of Closure (Orange Vertical Line) than in Figure 10. Note: The blue lines in this trace are bilateral suprahyoid activity, which continues even during opening. (MM-R = right masseter, MM-L = left masseter, TA-R = right temporalis, TA-L = left temporalis)
  • Figure 10. The same patient as in Figure 9 one month after treatment has been finalized. The working temporalis is now more active than the non-working temporalis and the hierarchy (1 – 2 – 3 – 4) of the muscle activity has been restored. The levels of activity are also higher for each muscle post treatment. (MM-R = right masseter, MM-L = left masseter, TA-R = right temporalis, TA-L = left temporalis)
  • Figure 11. This superimposed view graphically reveals the extent of the variability of each of the muscles. Whatever the reason for dysfunction, the general indications of dysfunction are reduced activity levels, disoriented hierarchy and increased variability. Restoring more normal patterns represents an improvement in masticatory function.
  • Figure 12. An example of the ACP of a subject prior to treatment. The (red = opening/cyan = closing) patient figures are highly deviated from the (black) mean normal figures that are scaled to fit the vertical dimension of this individual.
  • Figure 13. The vertical size (15 mm) and velocity of chewing a hard bolus is dramatically greater in this post treatment record compared to the same patient’s record in Figure 12. Although the patterns do not overlap the mean normal patterns exactly, the shapes and smoothness approach those of the control patterns (black lines) far more than the pre-treatment records of Figure 12.
  • Figure 14. An example of the visual transition from pre-treatment to post treatment.
  • Figure A. Panoramic X-Ray of a patient prior to treatment. Extensive degradation of the oral structures, numerous root canals and previous dental treatments are evident suggesting a complete mouth rehabilitation would be justified.
  • Figure B. Electrode placements for masseter and anterior temporalis muscles.
  • Figure C. A pre-treatment disclusion time from C to D in the time graph of 3.04 seconds that ends in the left posterior dentition.
  • Figure D. Post treatment disclusion time from C to D in the time-graph of 0.41 seconds and termination at the cuspid

Abstract

Objective: To objectively document improvements in masticatory function after full mouth reconstruction using routinely measurable
variables (EMG and Jaw Motion).
Methods: A series of 38 patients seeking full mouth reconstructions with severely damaged dentitions were recorded using a magnetic
incisor-point tracker and a surface electromyograph. Movements and muscle activities were recorded while alternately chewing gum
and a hard bolus on the left and right sides (separately, 4 records) prior to any treatment. Precisely the same records were recorded again
one month post treatment. After determining data norma lity, Student’s t test wa s used to analyze the data. ULF-TENS was used to relax
the musculature prior to capturing a bite registration.
Results: Five EMG parameters exhibited significant improvements for one or both conditions (p < 0.05). Other parameters indicated
trends in the same directions. Five movement parameters changed significantly within at least one of the four conditions (p < 0.05) and
approached control values. These cycle times and Turning Points improved towards more normal values under all four conditions (p <
0.05).
Conclusions: After treatment 5 mean muscle parameters were found to be significantly closer to those of a previously recorded control
group. Five mean chewing movement parameters also changed significantly to better align with the previously established control
values.
Clinical Significance: The ability to objectively evaluate masticatory function can offer the dentist and the patient a method to add
function to their cosmetic criteria for treatment success.
Key Words: Electromyography, Incisor-point tracking, Average Chewing Pattern (ACP), Average Chewing Cycle (ACC), mastication,
Turning Point (TP), Terminal Chewing Position (TCP)

Introduction

There are two general criteria that are used to justify a full mouth reconstruction; 1) to create a more cosmetically pleasing smile, including restoring a more physiologic occlusal vertical dimension (OVD), and 2) to restore a patient’s ability to masticate more effectively when their natural dentition is severely damaged. The first reason is more often considered because cosmetic issues are clearly visible to both the patient and the dentist, but the second reason is actually critical to maintaining good health. In general, masticatory dysfunction reduces the extraction of nutrients from food,1 especially from all those healthy raw vegetables, and it can lead to the development of irritable bowel syndrome (IBS).2,3

When individuals have not maintained their dentitions for decades at some point a major reconstruction can be the best option to restore effective masticatory function and simultaneously their cosmetic appearance. Missing teeth, chipped teeth, eroded teeth, rampant decay, the extensive failing of previous restorations and posterior bite collapse are all factors that indicate reconstruction may be functionally beneficial.4,5 Although perfect restoration of function may not be possible, improvement in masticatory function is a reachable goal. Although it may or may not be possible, it is not necessary to achieve perfect masticatory function. Even though patients are often not aware of extent of their dysfunction, a significant improvement to the patient’s ability to function will usually be recognized and very satisfying.

With modern computer technology it is now possible to measure the quality of masticatory function and identify any improvements that are achieved. This is important because asking the patient “how well can you chew” suffers from the fact that the process of degradation is usually so gradual that it is not even perceived by the patient. The patient with severe degradation adapts very gradually to their condition over a very extended period of time and consequently cannot precisely evaluate the extent of their current limitations. Thus, the patient cannot provide much guidance for what needs to be restored.

There are two current approaches used to evaluate masticatory function; 1) particle size measurement of a bolus chewed for a fixed number of cycles6,7 or 2) the analysis of the combined recording of the chewing motions and muscle activity.8–11 The first method is messy, time consuming to apply and does not evaluate the quality of muscle function. However, by simultaneously recording the motions and comparing the muscle activity of a patient while chewing to control values, a reliable indication of a patient’s masticatory restrictions can easily be obtained.9–11

Measurement of Chewing Motions

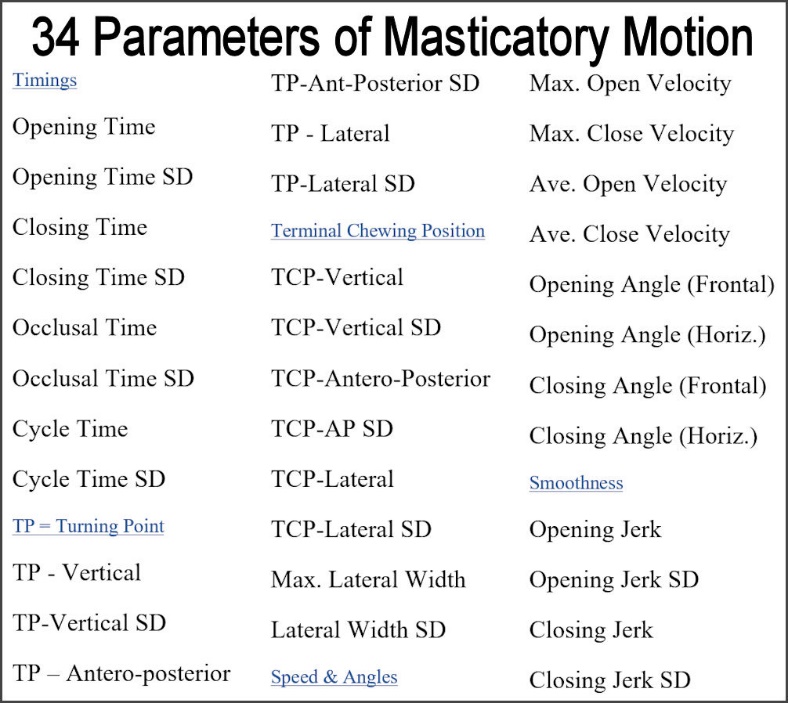
There are thirty-four measurable movement parameters that are associated with incisor-point motions that are utilized for mastication.12,13 See Figure 1. Many of these parameters can be altered by temporomandibular disorders (TMDs), but they can also be changed in non-TMD subjects when the occlusion and/or the maxillo-mandibular relationship have been altered by damaged and or missing teeth. Tracking all of these parameters from pre-treatment through final treatment can be an effective way to evaluate the efficacy of treatment with respect to function. Since the nature of mastication is complex, only some of these parameters are altered within a specific case.

Figure 1
Figure 1.Thirty-four measurable masticatory movement parameters that are commonly recorded with incisor-point trackers. SD = Standard Deviation, AP = Antero-posterior, Max. = Maximum, Ave. = Arithmetic Mean.

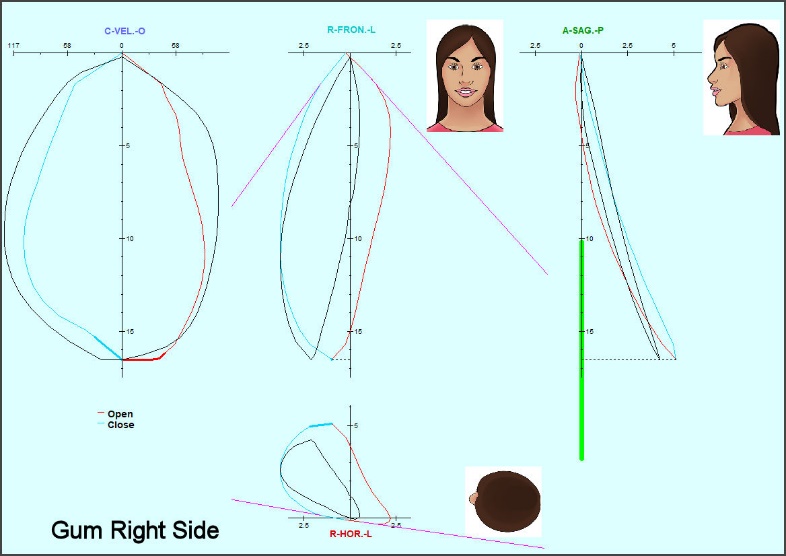
There are many combinations of changes and they vary greatly among dysfunctional subjects. These 34 parameters can all be calculated automatically by software, reducing the effort required to analyze each patient. In addition, software can quickly graph mean patterns of a patient’s incisor-point chewing motions in frontal, sagittal, horizontal and velocity planes superimposed over mean normal patterns that have been well established.14–16 See Figure 2.

Figure 2
Figure 2.This is a graphic depiction of the Average Chewing Pattern (ACP) in three dimensions from a Class I fully dentate control subject with good occlusion. The black lines describe the Mean Control Group ACP, the red (opening) and cyan (closing) lines are the individual patient’s ACP for comparison. Note how closely the shapes of the subject’s patterns concur with the normal group mean patterns.

The ability to recognize the significance of these patterns was contingent upon measuring a substantial control group to establish norms for comparison.17 Previous work has indicated that TMJ internal derangements slow the cycle time, increase variability and reduce the vertical component of masticatory patterns.18 The most comprehensive and innovative normal movement studies occurred in Japan nearly 30 years ago led by Professor Takao Maruyama.14 His group found that the shape of the patterns is more important than the absolute values of the parameters. Because the shapes of the patterns in Figure 2 mimic the mean normal shapes, one can see that this subject has good masticatory function without even looking at the numerical values. Achieving an ideal ACP is not a requirement, but it can be used as a target for indicating the extent of masticatory improvement towards ideal function.

Measurement of Muscle Activity

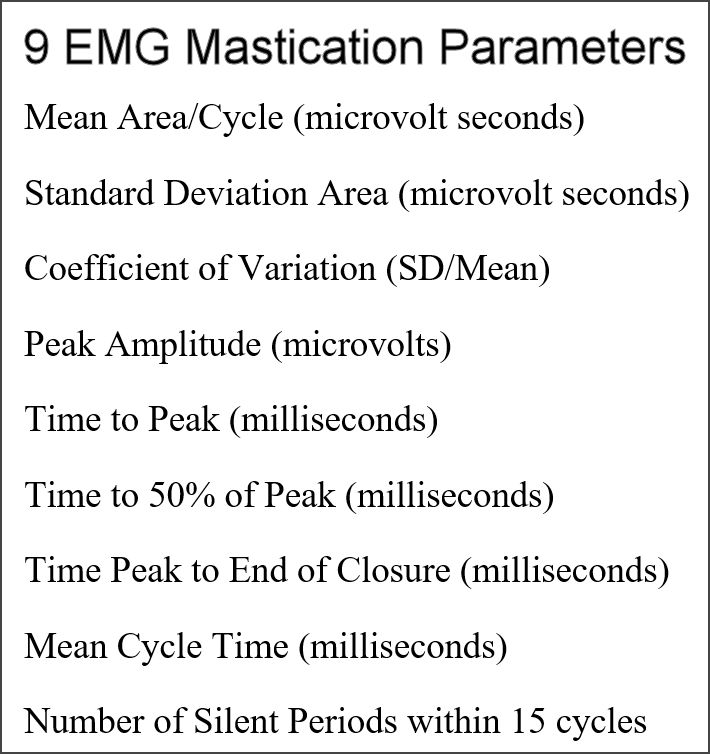
There are nine EMG muscle activity parameters that can be recorded electromyographically while a subject is chewing a soft or hard bolus to evaluate the quality of muscular function during mastication.12,13 See Figure 3. The muscles most commonly recorded bilaterally are the anterior temporalis and the masseter muscles since they are active during the crushing of the bolus.19–21 An indication of the opening activity can be recorded from the anterior digastric in the suprahyoid area,22 but the lateral pterygoid is not accessible using non-invasive surface electrodes.23 The importance of working masseter function was revealed 25 years ago by comparing the EMG activity of dysfunctional subjects to normal controls.24 Recently, a definitive comparison of the changes in the combined masticatory EMG and incisor-point motions from before to after routine prosthodontic treatments also revealed normative control group values.25

Figure 3
Figure 3.Nine EMG mastication parameters that are commonly recorded to evaluate the change in the quality of masticatory muscle function. SD = Standard Deviation.

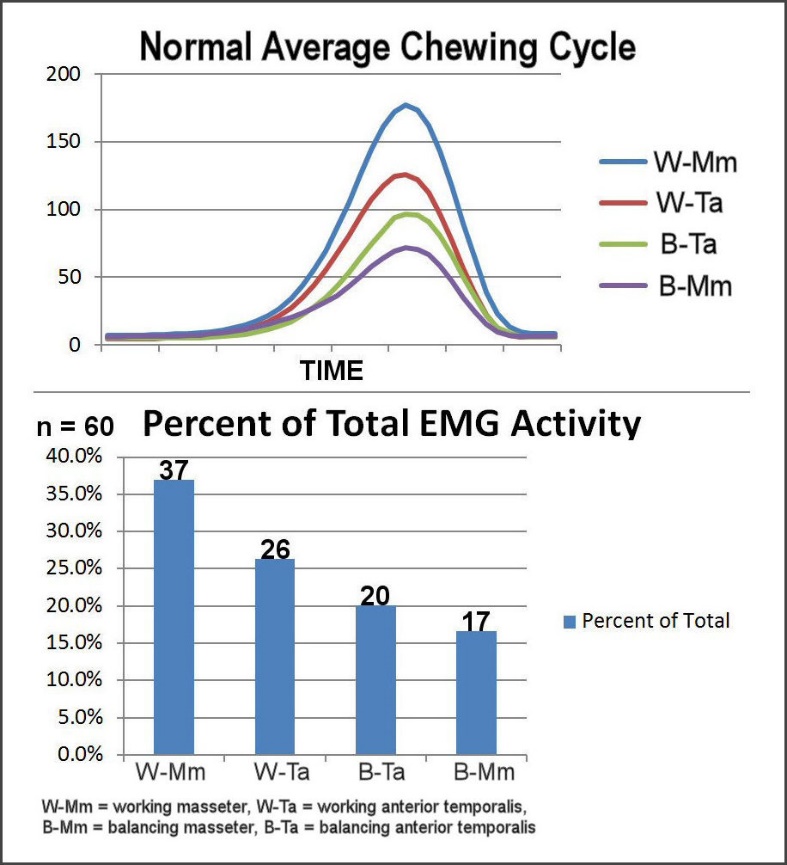
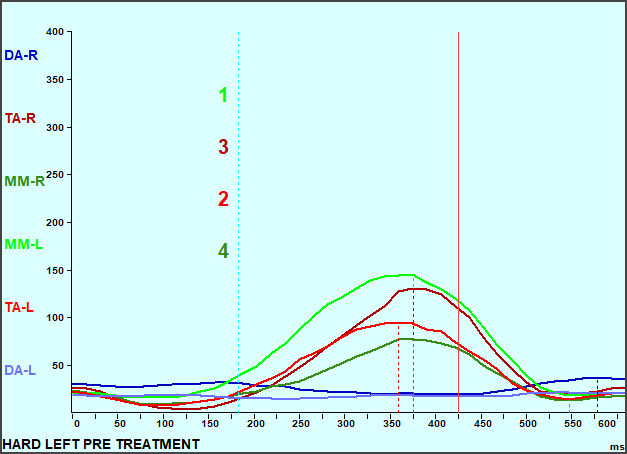
A graphic display of the Average Chewing Pattern (ACC) of the anterior temporalis and masseter muscles can give a visual indication of the relative normality of the muscular function.25 See Figure 4. This ACC graph indicates that the working masseter is expected to be the most active and the non-working masseter the least active. This graphic can reveal an adapted-compromised condition where the subject does produce a normal appearing ACP, but does so with a non-normal appearing ACC.

Figure 4
Figure 4.This graphic image of the Average Chewing Cycle from a control group (n = 60) shows the inter-relationships between the bilateral anterior temporalis and masseter muscles. It can be used to evaluate the relative normality of a patient’s muscular activity including the hierarchy of contraction intensity.

(Reprinted from: Thumati P, Thumati RP, Radke J. Changes in Objective measurements after prosthodontic treatment. Adv Dent Tech. 2020 Jan; (2(1):69-82. with permission from the publisher Advanced Dental Technologies & Techniques.)

Masticatory muscle activities are commonly recorded with two distinct bolus types, gum and a hard bolus. The gum bolus is very easy to chew and works best to detect the presence of interfering tooth contacts that elicit silent periods within the EMG burst when occurring frequently within cycles.26 The hard or tough bolus increases he stress the masticatory system and often reveals difficulty with mastication that gum chewing does not disclose.

Vertical Dimension of Occlusion

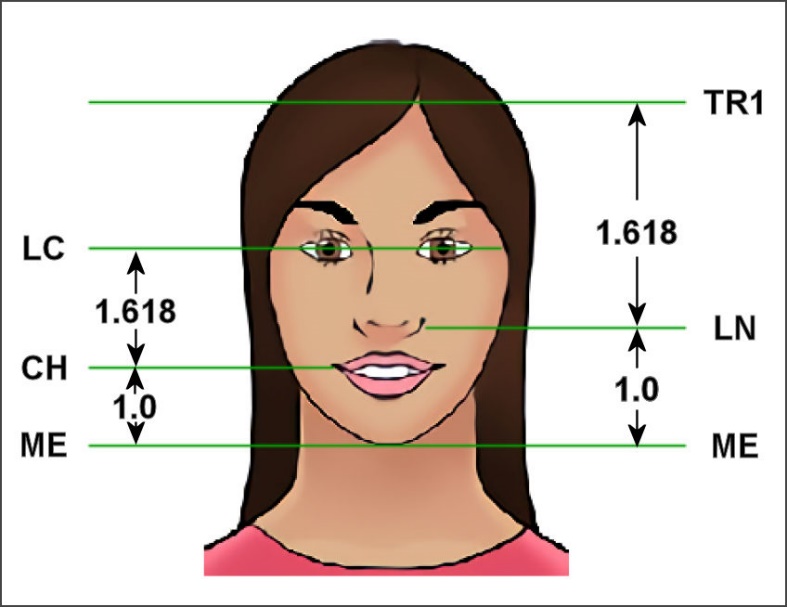
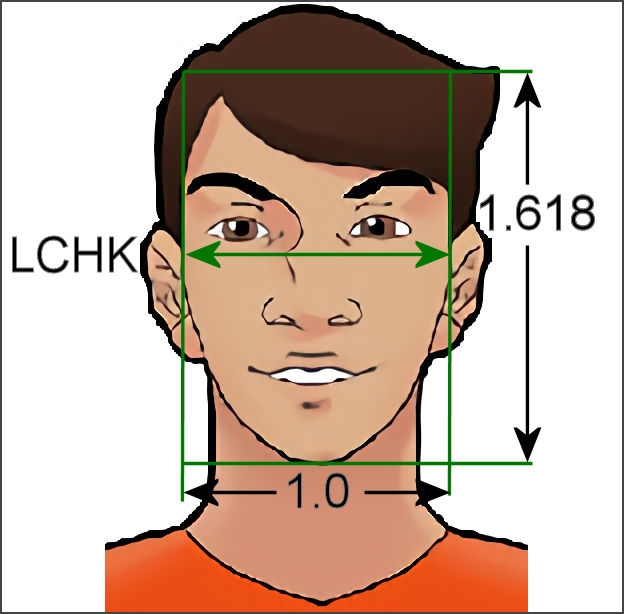
A number of clinical parameters have been developed to judge the aesthetic restoration of a collapsed OVD such as the Golden Vertical Proportion of 1:1.618.27,28 See Figure 5. This proportion seems to hold true regardless of whether the facial skeletal structure is mesofacial, brachyfacial or dolichofacial. However, it does seem to define the mesofacial type when applied to the complete facial pattern. See Figure 6.

Figure 5
Figure 5.The golden proportion as applied to the vertical dimension of occlusion.
Figure 6
Figure 6.The Golden Proportion applied to the face relates best to the mesofacial form.

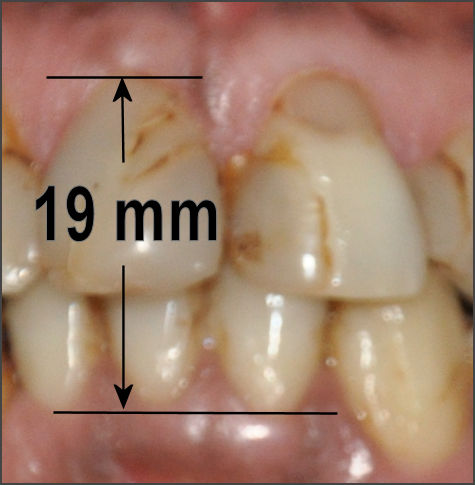
The Median Shimbashi Measurement (MSM) is between 17-18 mm from the cementoenamel junction (CEJ) of the upper central incisors to the cementoenamel junction of the lower central incisors with the teeth in centric occlusion.29 See Figure 7. Some have confused the first set of measurements by Dr. Hank Shimbashi, which in a Class I control group averaged 19 mm at rest position, with the same distance later averaged between 17 mm and 18 mm in centric occlusion. While these are not absolute values, they are useful guidelines to re-establishing a comfortable vertical dimension and it has been widely reported that patients with worn dentitions and severe malocclusions often measure well below 17 mm.30

Figure 7
Figure 7.The Median Shimbashi Measurement from the CEJ of the upper central incisors to the CEJ of the lower central incisors is ideally 18.0 (+/- 1.0 mm) among Class I ideal occlusion control groups.

Objective

The objective of this study was to document improvements in masticatory function that are objectively observable after a full mouth reconstruction that is functionally focused.

Methods

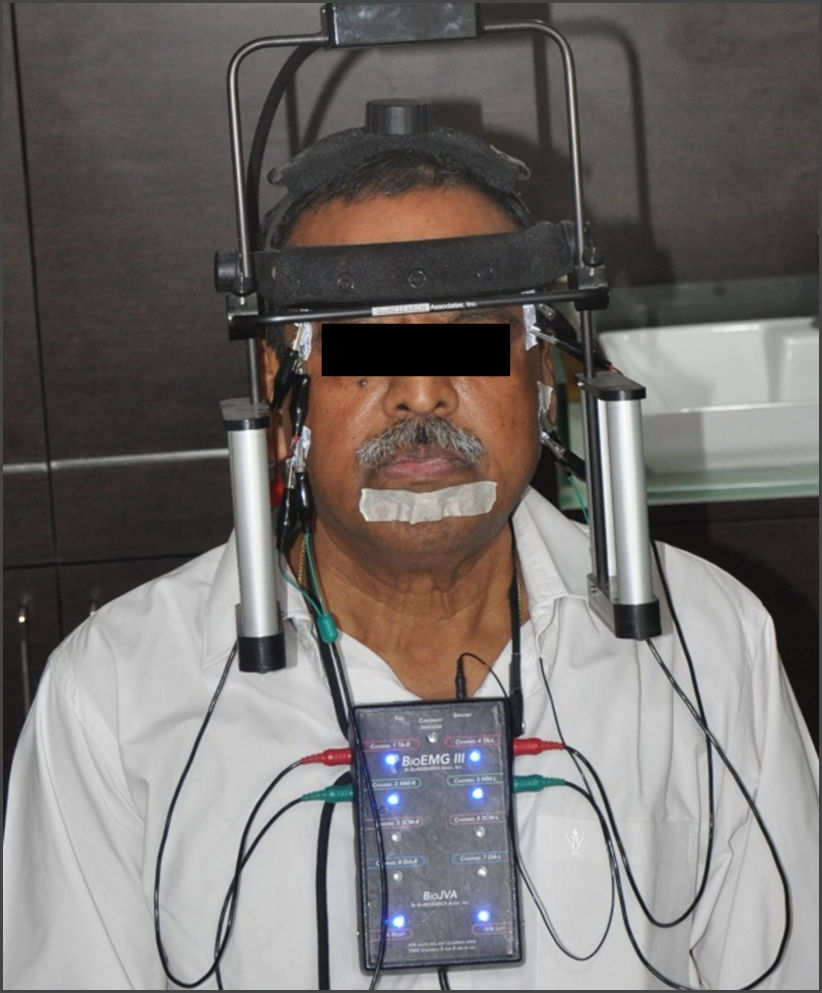
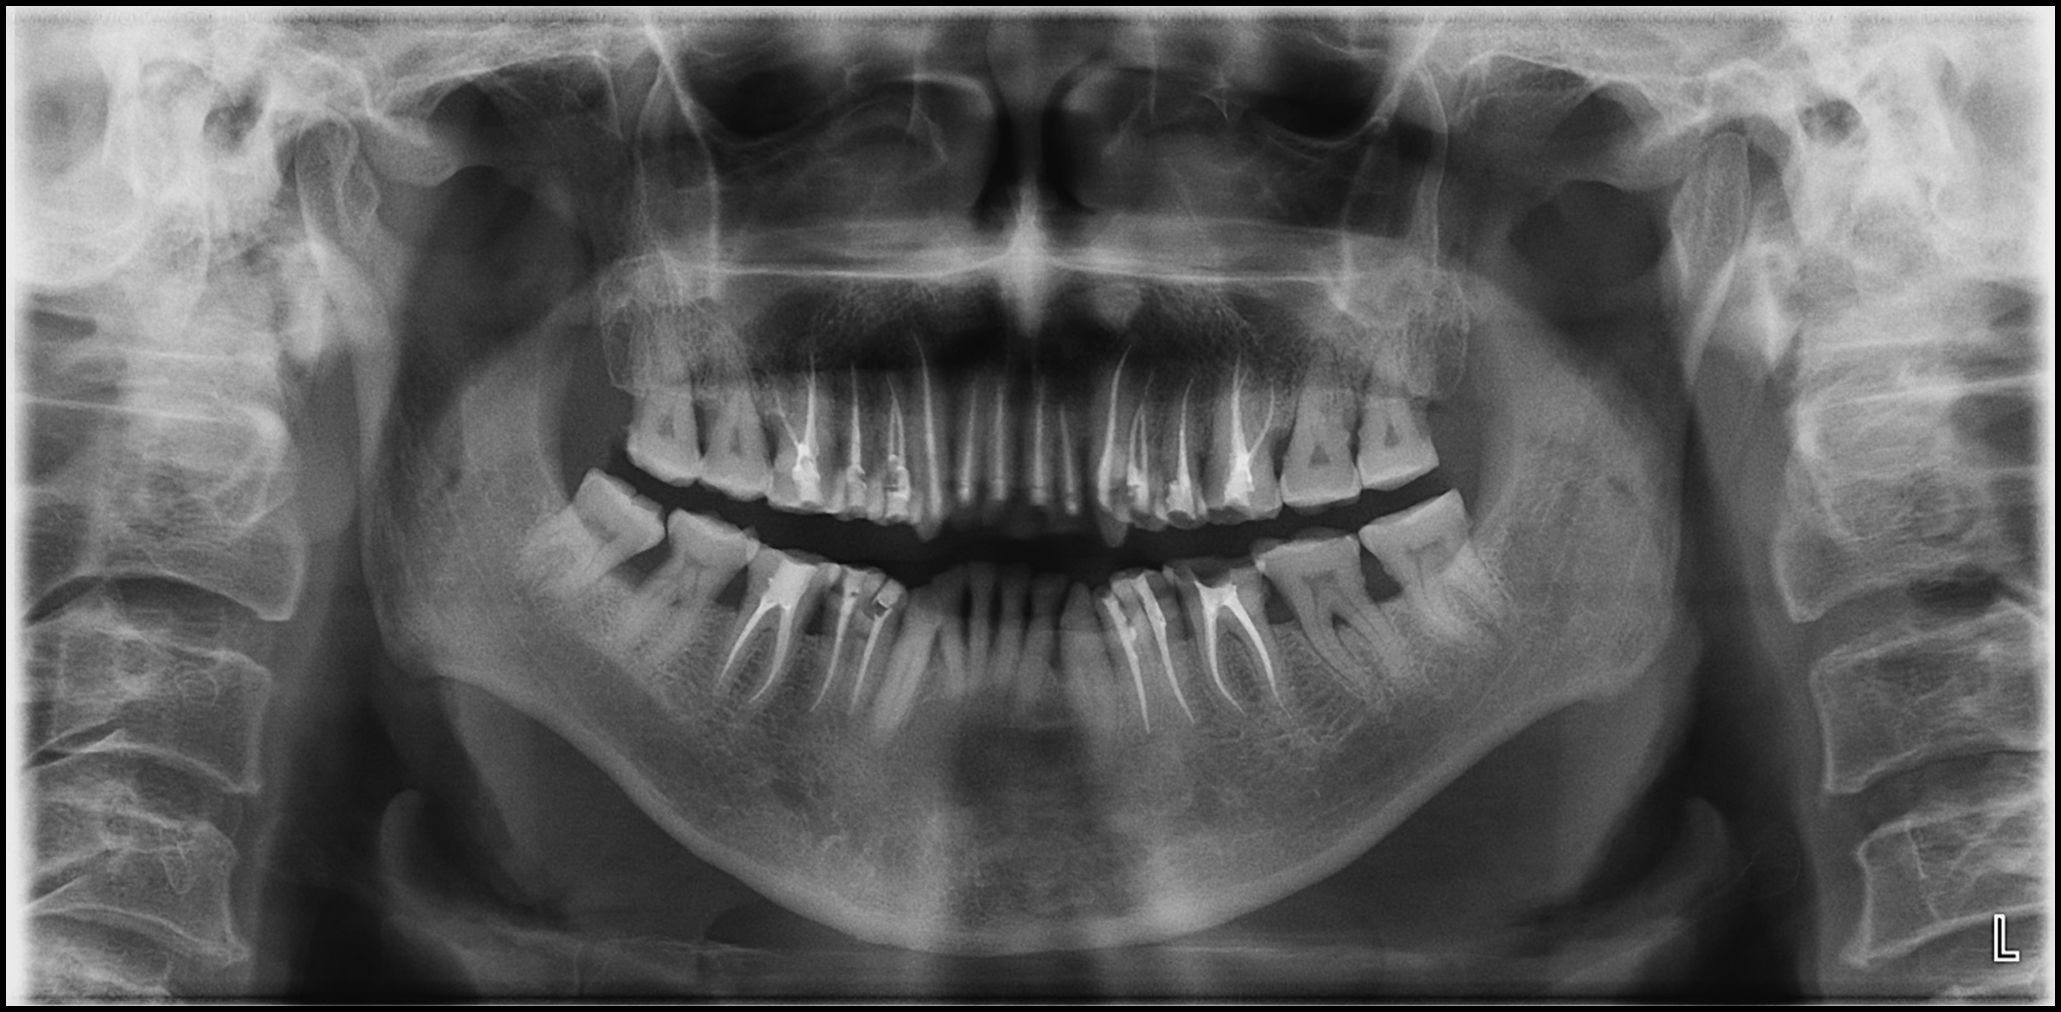
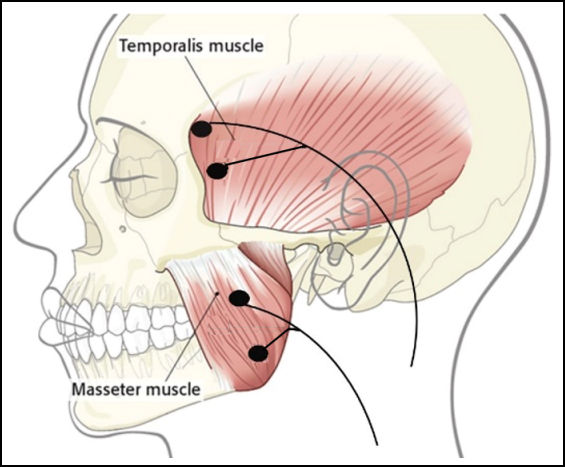
A series of 38 patients seeking extensive dental restorations due to severely damaged dentitions were evaluated from medical histories, clinical examinations, and panoramic x-rays. See Figure A in the appendix. Prior to any treatment each subject was fully informed and agreed to participate in this study. Each subject was recorded using a magnet-based incisor-point jaw tracker coupled to an eight-channel surface electromyograph (JT-3D connected with BioEMG III, Bioresearch Associates, Inc. Milwaukee, WI USA). See Figure 8. Bipolar electrodes were placed bilaterally over the anterior fibers of the temporalis and the superficial fibers of the masseter muscles with the electrode’s long axis parallel to the direction of the fibers. See Figure B in the appendix.

Figure 8
Figure 8.The JT-3D incisor-point tracker and BioEMG III amplifier applied to a potential reconstruction patient.

Records were taken first while chewing gum on the left and right sides (2 separate records). 2 additional records were taken while the subject masticated a hard bolus, consisting of Chikki (a peanut based candy). Precisely the same recording procedure was repeated 1 month post treatment. During each recording session, three-dimensional incisor-point motions were captured simultaneously along with the activities of the bilateral superficial masseter and anterior temporalis muscles at a more than adequate sample rate of 2000 samples/second/channel. See Figure 8.

The inclusion criteria: Good general health, an extensive need for restorative dental prostheses, a willingness to participate and a signed informed consent.

The exclusion criteria: Any systemic disease, severe temporomandibular disorders, inability to chew gum or a hard bolus prior to treatment or a beard preventing masseter electrode placements.

The frequencies of interest for surface EMG recordings of masticatory activities are from about 30 Hz to about 500 Hz because higher frequencies consist mainly of baseline noise and contribute little to the clinically relevant amplitude. Using a frequency cutoff lower than 30 Hz allows artifacts to contaminate the muscle data.31 Frequencies between 0 and 20 Hz are particularly unstable because they result primarily from the highly variable firing rates of muscles, which are continuously changing during all masticatory function.32–34

Statistical Analysis

The data of this study were analyzed clinically and statistically within the Mastication Analysis portion of the BioPAKTM computer program (Version 8.8, BioResearch Associates, Inc. Milwaukee, WI USA) and again after transferring these datasets into Excel (Microsoft, Inc. Woodinville, WA USA) for additional statistical analysis. After determining that the data were normally distributed, Student’s t test was used to compare the pre-treatment values to the one-month post-treatment values. After calculating the ACP and the ACC, only the parameters that changed significantly for the whole group are reported here. A value of p < 0.05 was chosen for statistical significance and p < 0.10 for indicating a trend if the change was directionally the same.

Bite Registration

After the tooth preparations were completed, the subjects received 45 to 60 minutes of ULF-TENS applied to the Vth and VIIth cranial nerves bilaterally through the coronoid notch to relax all the muscles innervated by them.35–37 (QuadraTENS, Model QT-42, BioResearch Associates, Inc. Milwaukee, WI USA). ULF-TENS was followed by a bite registration at a neurophysiologic position of the mandible in relation to the maxilla, which was used to fabricate all prosthetic solutions. Although this procedure was originally established more than 50 years ago to prosthetically correct a fully collapsed maxillo-mandibular relationship in patients exhibiting symptoms of temporo-mandibular disorders, it has subsequently been found to be useful for planning a variety of restorative and orthodontic treatments for patents without extensive muscular TMD symptoms.38–40

Results

Muscle Activity Parameters

Of the nine EMG parameters, five were found to be significantly changed within this group one month after treatment when compared to the pre-treatment values. See Table 1. The Mean Area, which is a measure of intensity, increased significantly for 3 of the 4 conditions (p < 0.05), but not for the right side chewing of a hard bolus, which did however trend in the same direction (p = 0.0786). The coefficients of variation decreased significantly for all conditions (p < 0.05). The peak amplitudes increased for all, but only significantly for the Right gum bolus (p < 0.05). The time from beginning of opening to 50 % of the peak values was significantly reduced for 3 of the 4 conditions, but not for the right gum bolus, which did trend in the same direction (p = 0.0981). The time from the peak intensity to the end of closure increased significantly for 2 of the 4 conditions (p < 0.05) and trended in the same direction for the other two conditions (p < 0.10).

Table 1.Group mean values of EMG activity for 5 of the mastication parameters with 1 month post treatment compared to pre-treatment values. Red values represent statistically significant changes, yellow values indicate a not significant trend in the same direction. (μV x Sec = microvolt-seconds, SD = standard deviation, Tx = treatment).
Group EMG Mastication Parameters Mean area (μV x Sec) Coefficient of variation (SD/mean) Peak Amplitude (μV) Time to 50% of Peak (milliseconds) Peak to End of Closure (milliseconds)
Left Gum Pre-Tx 35.5 0.421 109 277 36.0
Left Gum Post-Tx 65.1 0.367 127 238 80.0
p < 0.00084 0.01570 0.07985 0.00300 0.02460
Left Hard pre-Tx 50.1 0.455 127 239 -0.30
Left Hard Post-Tx 68.7 0.362 148 211 21.30
p < 0.04638 0.00059 0.09148 0.03367 0.09698
Right Gum Pre-TX 46.3 0.426 117 322 16.3
Right Gum Post-Tx 76.4 0.353 144 252 46.0
p < 0.00244 0.00046 0.04339 0.09806 0.09681
Right Hard Pre-Tx 59.1 0.464 133 248 -28.3
Right Hard Post-Tx 64.1 0.394 152 212 4.8
p < 0.07856 0.00321 0.11288 0.01676 0.03355

Red = Significant (p < 0.05), Green = Trend (p < 0.10), Black = not significant

Left Chewing Timing Parameters

This group was specifically asymptomatic of severe TMDs symptoms and therefore presumably adapted to their damaged dentitions. Thus, of the 34 potential movement parameters, only seven were most often significantly changed from pre-treatment to 1 month post treatment. See Table 2. The Opening Time was reduced for both Gum and the Hard Bolus, but only the Gum changed enough to achieve significance (p < 0.05). The opening standard deviation (variability) was reduced with both boluses, but the change was significant only for the Hard Bolus (p < 0.05). The complete Cycle Time was reduced for both bolus types (p < 0.05). The Standard Deviation of the Cycle Time was reduced for both bolus conditions, but only reached a level of significance for the Hard Bolus (p < 0.05). The hard bolus is more challenging and therefore is a more definitive test of good function.

Table 2.Group mean values of Left Chewing Movements for 7 of the mastication movement parameters with pre-treatment values compared to 1 month post treatment. Red values represent statistically significant changes, yellow values indicate a not significant trend in the same direction. (SD = standard deviation, Tx = treatment, sec. = seconds, TCP = Terminal Chewing Position, A/P = antero-posterior).
Left Mastication Movements Pre-Tx Gum Left Post-Tx Gum Left Mean Normal for Gum Pre-Tx Hard Left Post-Tx Hard Left
Opening Time (sec.) 0.277 0.233 0.277 0.271 0.202
p = 0.04913 (+/- 0.061) 0.05289
Opening SD (sec.) 0.102 0.099 0.061 0.171 0.0786
p = 0.40029 0.02802
Cycle Time (sec.) 0.755 0.674 0.760 0.768
p = 0.03508 (+/- .114) 0.04501
Cycle SD (sec.) 0.202 0.182 0.114 0.271 0.171
p = 0.30667 0.01144
Turning Point Vert (mm) 11.5 12.8 17.6 12.7 13.7
p = 0.05810 (+/- 3.9) 0.13871
TCP Vertical (mm) 1.86 1.59 0.18 2.02 1.54
p = 0.17089 (+/- 0.15) 0.03961
Turning Point A/P (mm) 2.6 6.4 3.9 3.6 7.1
p = 0.00455 (+/- 4.6) 0.00016

Red = Significant (p < 0.05), Green = Trend (p < 0.10), Black = not significant

Left Chewing Positional Parameters

The Turning Point (TP) is the point at which the opening movement transitions to closing and it is the point farthest from the intercuspal position in the three dimensions of vertical, antero-posterior and lateral. The Vertical Turning Point increased slightly but not enough to indicate significance (p > 0.05). Note: This vertical parameter is more affected by the size of the bolus than by any change in the occlusion, which requires standardizing the bolus size. However, the Antero-Posterior Turning Point did increase significantly for both conditions (p < 0.0046), indicating a definitive change in the position of the TP. See Table 2.

The Terminal Chewing Position (TCP) is the point at which the bolus is maximally crushed or the closest point to the intercuspal position. The Vertical TCP was reduced with both boluses, but only decreased enough to reach significance with the hard bolus (p < 0.05). The antero-posterior and lateral values of the TCP are usually restricted by the occlusion to small values and are only variable when the dentition is severely worn. See Table 2.

Right Timing Chewing Parameters

The Right Opening Times did decrease slightly for both bolus conditions, not significantly, but suggestive of a possible trend for the hard bolus condition (p = 0.0746). The Opening Standard Deviation decreased for both conditions (reduced variability), but significance was only reached for the gum bolus (p = 0.0485), while the Hard Bolus suggested a possible trend in the same direction (p = 0.0601). The Cycle Times were reduced under both bolus conditions (p < 0.05). The cycle Time Standard Deviations were reduced under both bolus conditions, but the change was significant for the hard bolus (p = 0.0114), not significant for the Gum bolus data. See Table 3.

Table 3.Group mean values of Right Chewing Movements for 7 of the mastication movement parameters with pre-treatment values compared to 1 month post treatment. Red values represent statistically significant changes, yellow values indicate a not significant trend in the same direction. (SD = standard deviation, Tx = treatment, sec. = seconds, TCP = Terminal Chewing Position, A/P = antero-posterior).
Right Mastication Movements Pre-Tx Gum Right Post-Tx Gum Right Mean Normal for Gum Pre-Tx Hard Right Post-Tx Hard Right
Opening Time (sec.) 0.282 0.261 0.277 0.258 0.216
p = 0.19527 0.07464
Opening SD (sec.) 0.126 0.096 0.061 0.161 0.105
p = 0.04846 0.06014
Cycle Time (sec.) 0.744 0.670 0.76 0.745 0.593
p = 0.04289 0.00204
Cycle SD (sec.) 0.250 0.127 0.114 0.294 0.179
p = 0.00323 0.02012
Turning Point Vert (mm) 11.3 11.8 17.6 +/- 3.9 13.3 13.8
p = 0.25618 0.30188
TCP Vertical (mm) 0.97 1.47 0.18 +/- 0.15 2.06 2.24
p = 0.21951 0.04272
Turning Point A/P (mm) 2.4 5.2 3.9 +/- 4.6 2.4 6.2
p = 0.01104 0.02929

Red = Significant (p < 0.05), Green = Trend (p < 0.10), Black = not significant

Right Chewing Positional Parameters

The Vertical Turning Point (VTP) increased for both bolus conditions but only showed a trend for Gum chewing (p = 0.0581). The Antero-Posterior Turning Point (ATP) did increase significantly for both conditions (p < 0.03), indicating a definitive change in the position of the ATP. See Table 3. In contrast, the Vertical Terminal Chewing Position was reduced significantly only for the Hard Bolus (p = 0.0427).

Discussion

When statistically analyzing the database of a heterogenous group like this one, it is important to realize it is probable that some of the subjects had rather normal function on one side and dysfunction only on the other side. Thus, for the analysis of each side, some normal data was likely mixed with the dysfunctional data diluting it somewhat. If the data were limited to only dysfunctional motions the differences could have been be greater.

Surface Electromyography has been developed for use in dentistry for the past 70+ years.41 Magnetic incisor-point jaw tracking has also been continuously utilized and further developed for many decades prior to the present.42 However, the application of incisor-point tracking combined with EMG applied to masticatory function has been a more recent approach. The reproducibility of combined EMG muscle activity and incisor-point masticatory motion data have been shown to be very good, especially with respect to timing.43 An early combined study found that joint and muscle dysfunctions alter both the movement and muscle activity during chewing.44

Average Chewing Cycle

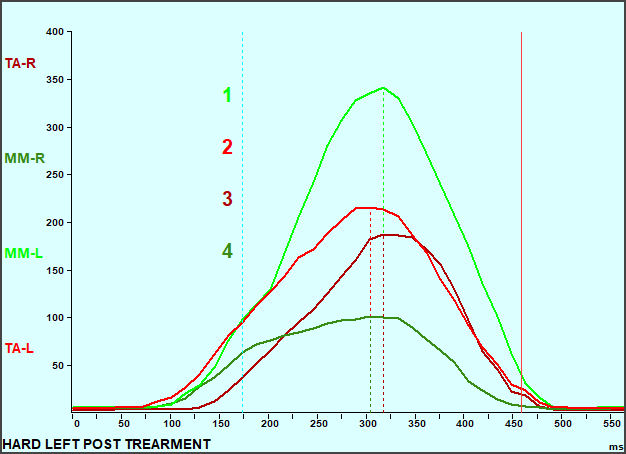
The Average Chewing Cycle (ACC) graphically reveals the average activity pattern of the masseter and anterior temporalis muscles during chewing.45,46 Figure 4 revealed the mean muscle activity patterns of a large control group with no symptoms and Class I occlusions. Although the mean pattern is altered somewhat for Class II and Class III, those differences are readily recognized. The ideal mean ACC, just like the mean ACP, is a target to pursue but it is not necessary to match it exactly to achieve acceptable function. All patients have some degree of adaptive capacity, reducing any requirement to achieve perfection. However, any improvement that moves the patient closer to the ideal pattern may indicate an improved functional capability. The ACC pattern in Figure 9 is not the worst possible by any means, but the pattern in Figure 10 changed closer to the mean normal pattern (Figure 4) and it also changed to a completely normal (1 – 2 – 3 – 4) hierarchy.

Figure 9
Figure 9.A pre-treatment ACC from one of the patients in this study. Ta-R (non-working temporalis) is the second most active, exceeding the working temporalis. The hierarchy (1 – 3 – 2 – 4) of the muscle activity is less than ideal and represents an adaptation to the present functional condition. The elevator muscles do not completely relax during opening and the Peak activity is closer to the End of Closure (Orange Vertical Line) than in Figure 10. Note: The blue lines in this trace are bilateral suprahyoid activity, which continues even during opening. (MM-R = right masseter, MM-L = left masseter, TA-R = right temporalis, TA-L = left temporalis)
Figure 10
Figure 10.The same patient as in Figure 9 one month after treatment has been finalized. The working temporalis is now more active than the non-working temporalis and the hierarchy (1 – 2 – 3 – 4) of the muscle activity has been restored. The levels of activity are also higher for each muscle post treatment. (MM-R = right masseter, MM-L = left masseter, TA-R = right temporalis, TA-L = left temporalis)

One month after the treatment was finalized a recording was made to check the progress. See Figure 10.

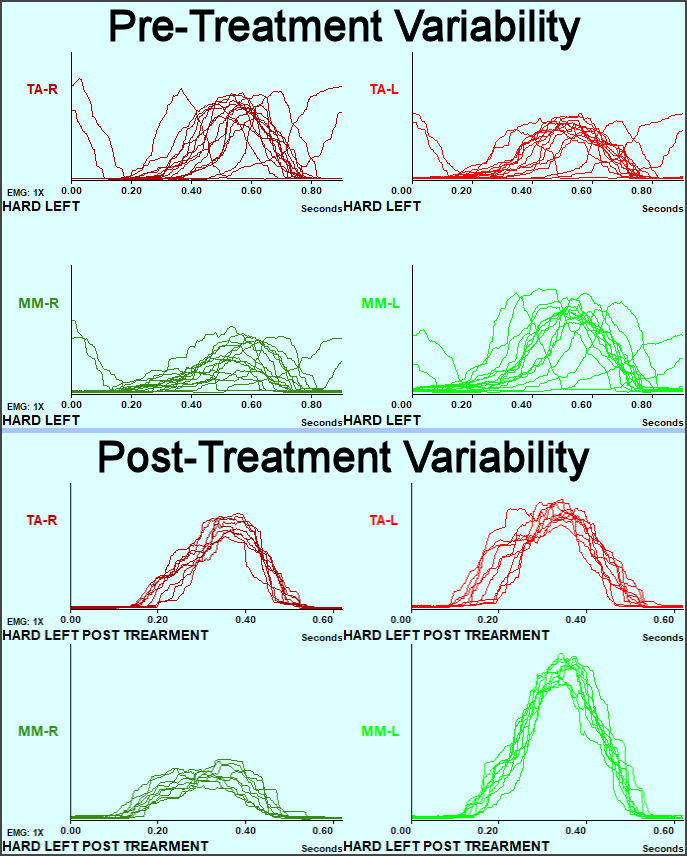
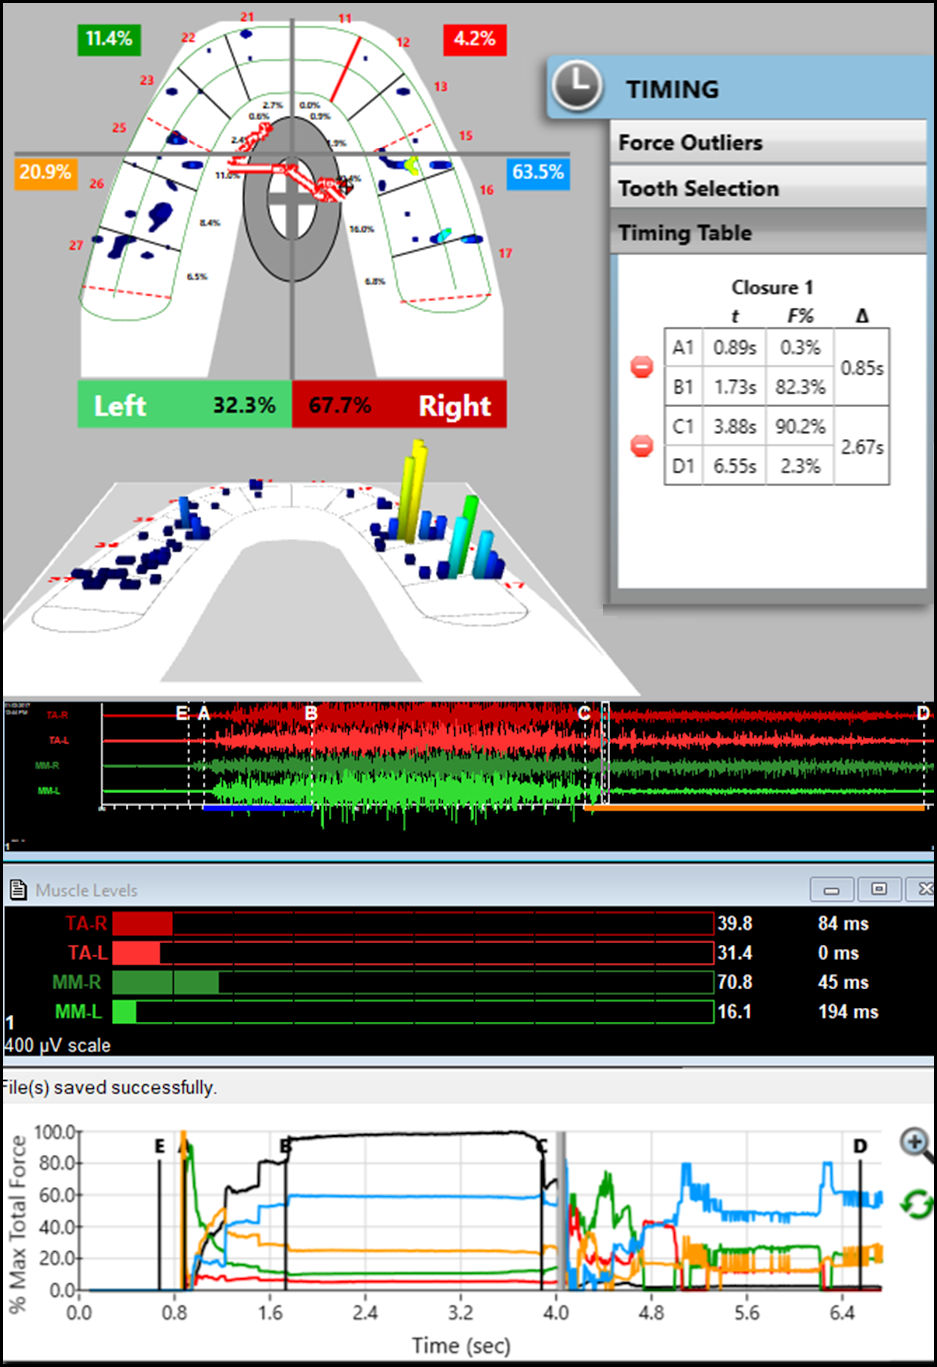
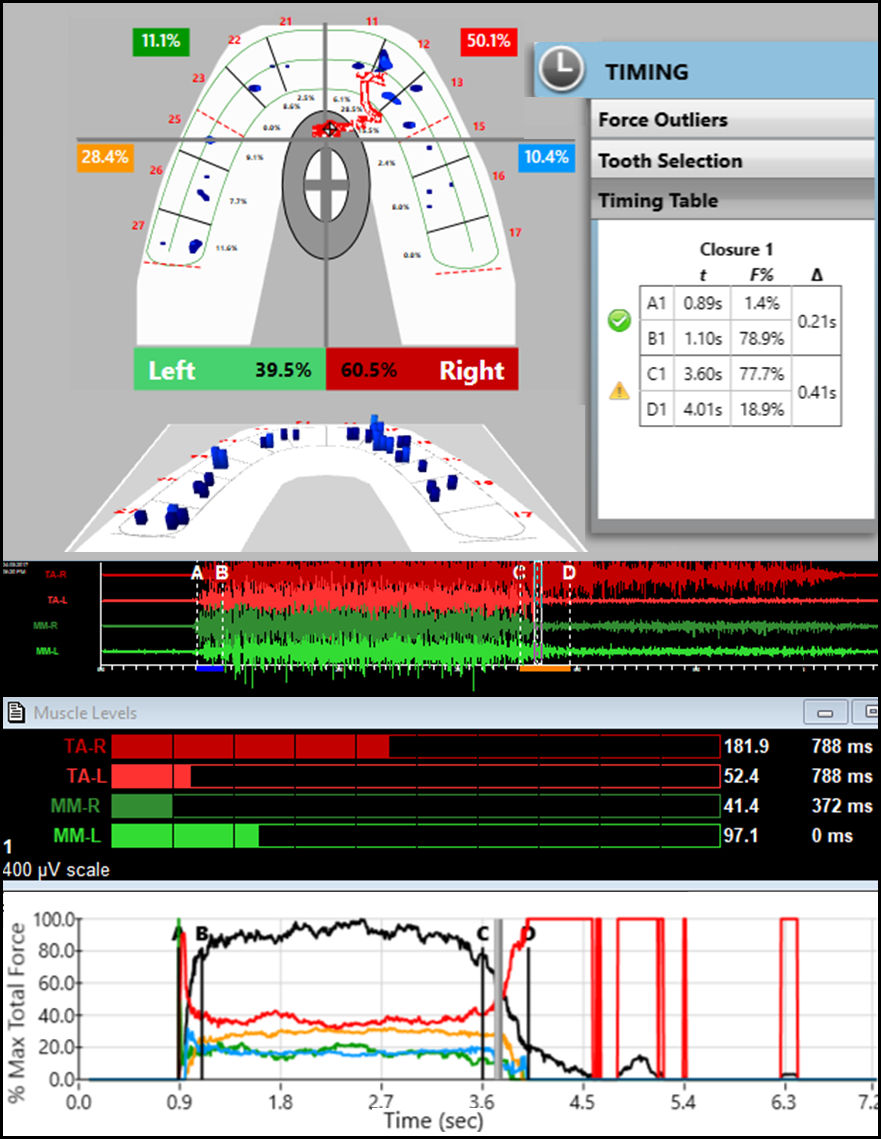
In this patient example the variability in the ACC was also reduced after treatment as well. Figure 11 is a view of the muscle activity cycles superimposed, which visually shows precisely the extent of the variation from cycle to cycle (top half) and the reduced variability after the finalization of treatment (bottom half). A moderate level of variation is required to masticate a bolus as it is changing, but dysfunction adds significantly to the extent of the variation.9,12,13

Figure 11
Figure 11.This superimposed view graphically reveals the extent of the variability of each of the muscles. Whatever the reason for dysfunction, the general indications of dysfunction are reduced activity levels, disoriented hierarchy and increased variability. Restoring more normal patterns represents an improvement in masticatory function.

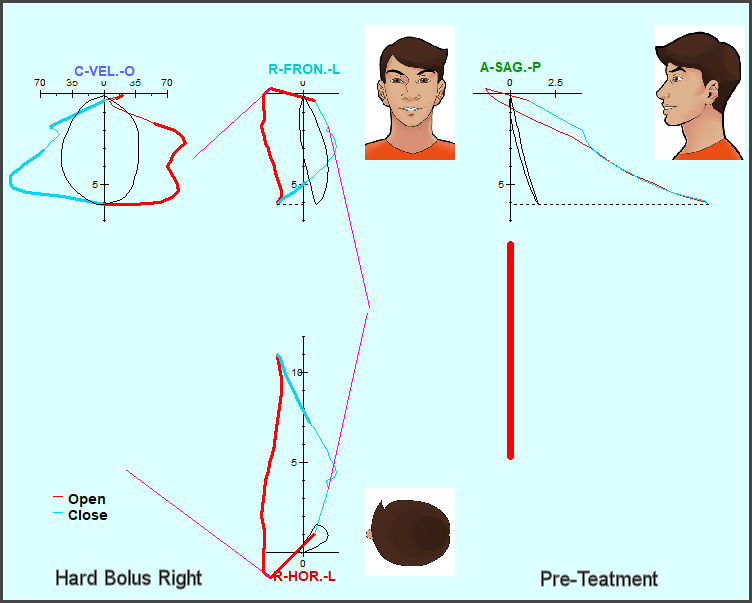
This group of subjects exhibited severe damage to their dentitions, but did not complain of TMD-like symptoms, indicating that they were able to tolerate their unfavorable conditions with high adaptability. Other individuals with similar conditions, but less adaptability, could become TMD symptomatic. Figure 12 is an example of a pre-treatment ACP. The frontal view indicates a worn-flat occlusion and a very flat sagittal angle of opening/closing. The size of the pattern is abnormally small (< 10 mm vertical opening) and the velocity is consistently interrupted, both in opening and in closing. The opening movement is anterior and lateral with minimal vertical change, which indicates a complete lack of any anterior guidance. In Figure 12 the patient’s movement patterns are nothing like the mean normal patterns, a clear indication of masticatory dysfunction.

Figure 12
Figure 12.An example of the ACP of a subject prior to treatment. The (red = opening/cyan = closing) patient figures are highly deviated from the (black) mean normal figures that are scaled to fit the vertical dimension of this individual.

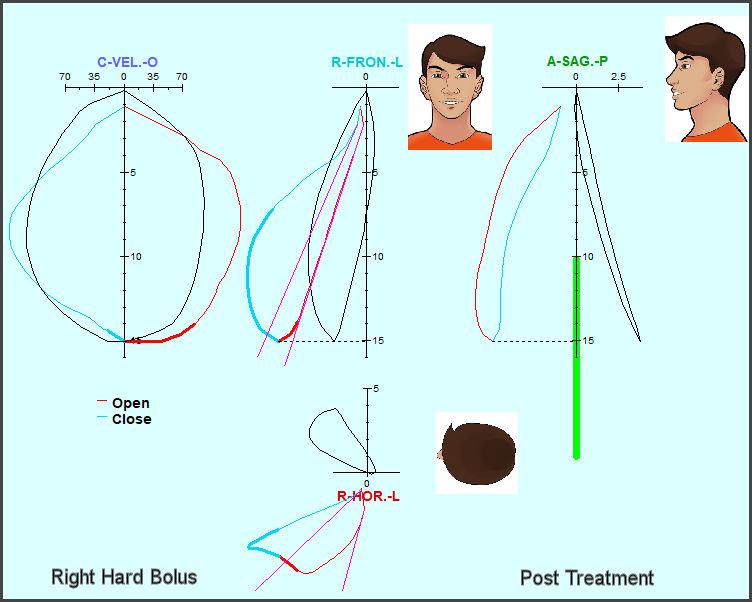
One month after restoration of the dentition the ACP (red/cyan) of the patient from Figure 12 has dramatically changed and exhibits patterns more like the mean normal patterns (black shapes). See Figure 13.

Figure 13
Figure 13.The vertical size (15 mm) and velocity of chewing a hard bolus is dramatically greater in this post treatment record compared to the same patient’s record in Figure 12. Although the patterns do not overlap the mean normal patterns exactly, the shapes and smoothness approach those of the control patterns (black lines) far more than the pre-treatment records of Figure 12.

Visually Assessing Cosmetics

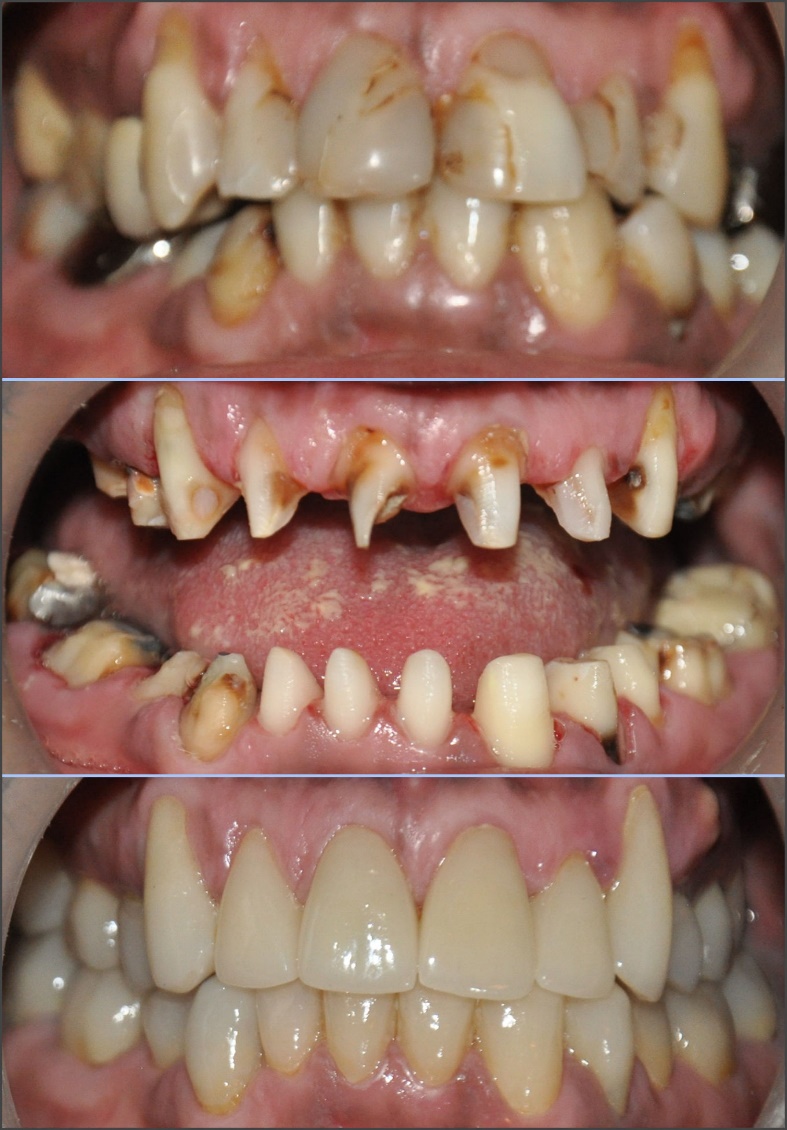
When visually assessing the changes in the patient’s appearance, the cosmetic aspects of the case can be readily seen by both the patient and the dentist. Figure 14. Cosmetic changes have therefore been the main drivers of reconstructive services. In contrast, changes in the functionality are not obvious to the observer. Consequently, the importance of good masticatory function has mostly been ignored by dentistry until recently. Poorly functioning patients are often unable to express a need for improved masticatory function as they have no reference for what is good function. It is only through the objective measurement of function that the extent of any dysfunction can be accurately disclosed. While the changes in the appearance of the dentition in Figure 14 is obvious, nothing about its appearance indicates whether the quality of masticatory function has improved.

Figure 14
Figure 14.An example of the visual transition from pre-treatment to post treatment.

Limitations

Due to the large number of variables included in this study the sample of 38 subjects may have been somewhat less than sufficient to maximize the significance of all of them. A larger sample segmented by conditions could have revealed additional significance hidden within this limited heterogenous database. While there are many parameters involved in jaw motion, only a few are usually affected by any single condition. The masticatory system is very complex and consequently, many factors can and do affect the performance of it. This group of subjects was selected without categorizing them with respect to their specific conditions except to not be considered TMD symptomatic.

Conclusions

After treatment five mean muscle parameters were found to be significantly closer to those of a previously recorded control group. Five mean chewing movement parameters also changed significantly to better match the previously established control values.


Clinical Significance

The ability to objectively evaluate masticatory function can offer the dentist and the patient a method to add functional criteria to their cosmetic criteria for what constitutes treatment success.

Disclosure of potential conflicts

Mr. Radke is the Chairman of the Board of BioResearch Associates, Inc. but receives no commission from sales. No other potential conflicts were reported.

Funding statement

No funding was received from any source for this project.

Accepted: June 08, 2021 CDT

References

1.
Ritchie CS, Joshipura K, Hung HC, Douglass CW. Nutrition as a mediator in the relation between oral and systemic disease: associations between specific measures of adult oral health and nutrition outcomes. Crit Rev Oral Biol Med. 2002;13(3):291-300. doi:10.1177/154411130201300306
Google Scholar
2.
Gallotta S, Bruno V, Catapano S, Mobilio N, Ciacci C, Iovino P. High risk of temporomandibular disorder in irritable bowel syndrome: Is there a correlation with greater illness severity? World J Gastroenterol. 2017;23(1):103-109. doi:10.3748/wjg.v23.i1.103
Google ScholarPubMed CentralPubMed
3.
Aaron LA, Burke MM, Buchwald D. Overlapping conditions among patients with chronic fatigue syndrome, fibromyalgia, and temporomandibular disorder. Arch Intern Med. 2000;160(2):221-227. doi:10.1001/archinte.160.2.221
Google Scholar
4.
Deliperi S, Bardwell DN, Congiu MD. Reconstruction of severely damaged endodontically treated and bleached teeth using a microhybrid composite resin: two-year case report. Pract Proced Aesthet Dent. 2003;15(3):221-226.
Google Scholar
5.
Schlichting LH, Resende TH, Reis KR, Magne P. Simplified treatment of severe dental erosion with ultrathin CAD-CAM composite occlusal veneers and anterior bilaminar veneers. J Prosthet Dent. 2016;116(4):474-482. doi:10.1016/j.prosdent.2016.02.013
Google Scholar
6.
Kümbüloğlu Ö, Saraçoğlu A, Bingöl P, Hatipoğlu A, Özcan M. Clinical study on the comparison of masticatory efficiency and jaw movement before and after temporomandibular disorder treatment. CRANIO®. 2013;31(3):190-201. doi:10.1179/crn.2013.030
Google Scholar
7.
English JD, Buschang PH, Throckmorton GS. Does malocclusion affect masticatory performance? . Angle Orthod. 2002;(1):21-27. doi:10.1043/0003-3219(2002)072
Google Scholar
8.
Piancino MG, Farina D, Talpone F, et al. Surface EMG of jaw-elevator muscles and chewing pattern in complete denture wearers. J Oral Rehabil. 2005;32(12):863-870. doi:10.1111/j.1365-2842.2005.01524.x
Google Scholar
9.
Radke JC, Kamyszek GJ, Kull RS, Velasco GR. TMJ symptoms reduce chewing amplitude and velocity, and increase variability. CRANIO®. 2019;37(1):12-19. doi:10.1080/08869634.2017.1365421
Google Scholar
10.
Ayinala M, Poovani S, Thumati P, Shetty G, Radke J. Mastication Analysis of patients with mandibular Kennedy’s Class I situation with or without modifications, before & after treatment partial denture insertion; an in vivo study. ADT&T.
Google Scholar
11.
Kerstein RB, Radke J. Average chewing pattern improvements following Disclusion Time reduction. CRANIO®. 2017;35(3):135-151. doi:10.1080/08869634.2016.1190526
Google Scholar
12.
Thumati P, Thumati RP, Radke J. Changes in Objective Masticatory Measurements after Prosthodontic Treatment. ADT&T. Published online 2020.
Google Scholar
13.
Al-Sulaihi K, Thumati P, Poovani S, Radke J. Masticatory Analysis of an Edentulous Patient, Case Report. ADT&T. Published online 2018.
Google Scholar
14.
Kuwahara T, Miyauchi S, Maruyama T. Clinical classification of the patterns of mandibular movements during mastication in subjects with TMJ disorders. Int J Prosthodont. 1992;5(2):122-129.
Google Scholar
15.
Kuwahara T, Bessette RW, Maruyama T. Chewing pattern analysis in TMD patients with and without internal derangement: Part I. CRANIO®. 1995;13(1):8-14. doi:10.1080/08869634.1995.11678035
Google Scholar
16.
Kuwahara T, Bessette RW, Maruyama T. Chewing pattern analysis in TMD patients with and without internal derangement: Part II. CRANIO®. 1995;13(2):93-98. doi:10.1080/08869634.1995.11678051
Google Scholar
17.
Nieisen IL, McNeill C, Danzig W, Goldman S, Levy J, Miller AJ. Adaptation of craniofacial muscles in subjects with craniomandibular disorders. Am J Orthod Dentofacial Orthop. 1990;97(1):20-34. doi:10.1016/s0889-5406(05)81705-6
Google Scholar
18.
Radke JC, Kull RS, Sethi MS. Chewing movements altered in the presence of temporomandibular joint internal derangements. CRANIO®. 2014;32(3):187-192. doi:10.1179/0886963413z.00000000028
Google Scholar
19.
Ingervall B, Thilander B. Activity of temporal and masseter muscles in children with a lateral forced bite. Angle Orthod. 1975;45(4):249-258. doi:10.1043/0003-3219(1975)045
Google Scholar
20.
Haraldson T, Ingervall B. Muscle function during chewing and swallowing in patients with osseointegrated oral implant bridges: An electromyographic study. Acta Odontol Scand. 1979;37(4):207-216. doi:10.3109/00016357909027583
Google Scholar
21.
Mohamed SE, Christensen LV, Harrison JD. Tooth contact patterns and contractile activity of the elevator jaw muscles during mastication of two different types of food. J Oral Rehabil. 1983;10(1):87-95. doi:10.1111/j.1365-2842.1983.tb00103.x
Google Scholar
22.
Ishii T, Narita N, Endo H. Evaluation of jaw and neck muscle activities while chewing using EMG-EMG transfer function and EMG-EMG coherence function analyses in healthy subjects. Physiol Behav. 2016;160:35-42. doi:10.1016/j.physbeh.2016.03.023
Google Scholar
23.
Hiraba K, Hibino K, Hiranuma K, Negoro T. EMG activities of two heads of the human lateral pterygoid muscle in relation to mandibular condyle movement and biting force. J Neurophysiol. 2000;83(4):2120-2137. doi:10.1152/jn.2000.83.4.2120
Google Scholar
24.
Mushimoto K, Mushimoto E, Kakutani H, Nishimura I. Pilot study of the heterogeneous patterns of masticatory muscle coordination in nonpatient population. J Prosthet Dent. 1995;74(6):637-643. doi:10.1016/s0022-3913(05)80317-8
Google Scholar
25.
Thumati P, Thumati RP, Radke J. Changes in objective masticatory measurements after prosthodontic treatment. ADT&T. Published online 2020.
Google Scholar
26.
Velasco GR, Radke J, Kadamati P. Silent periods during mastication reveal interfering tooth contacts. ADT&T. Published online 2020.
Google Scholar
27.
Jefferson Y. Facial esthetics--presentation of an ideal face. J Gen Orthod. 1993;4(1):18-23.
Google Scholar
28.
Jefferson Y. Skeletal types: key to unraveling the mystery of facial beauty and its biologic significance. J Gen Orthod. 1996;7(2):7-25.
Google Scholar
29.
Sierpinska T, Kuc J, Golebiewska M. Morphological and Functional Parameters in Patients with Tooth Wear before and after Treatment. Open Dent J. 2013;7(1):55-61. doi:10.2174/1874210601307010055
Google ScholarPubMed CentralPubMed
30.
Makarova OM, Kuroiedova VD, Rud YV. Vertical dimension of occlusion characteristics in patients with different types of malocclusions by the Shimbashi Index in the age aspect. Ukranian Dental Almanac. 2021;(1):69-73. doi:10.31718/2409-0255.1.2020.10
Google Scholar
31.
De Luca CJ, Gilmore LD, Kuznetsov M, Roy SH. Filtering the surface EMG signal: Movement artifact and baseline noise contamination. J Biomech. 2010;43(8):1573-1579. doi:10.1016/j.jbiomech.2010.01.027
Google Scholar
32.
Nazmi N, Abdul Rahman M, Yamamoto SI, Ahmad S, Zamzuri H, Mazlan S. A Review of Classification Techniques of EMG Signals during Isotonic and Isometric Contractions. Sensors. 2016;16(8):1304. doi:10.3390/s16081304
Google ScholarPubMed CentralPubMed
33.
Reaz MBI, Hussain MS, Mohd-Yasin F. Techniques of EMG signal analysis: detection, processing, classification and applications (Correction). Biol Proced Online. 2006;8(1):163-163. doi:10.1251/bpo124
Google ScholarPubMed CentralPubMed
34.
Chowdhury R, Reaz M, Ali M, Bakar A, Chellappan K, Chang T. Surface electromyography signal processing and classification techniques. Sensors. 2013;13(9):12431-12466. doi:10.3390/s130912431
Google ScholarPubMed CentralPubMed
35.
Jankelson B, Sparks S, Crane PF, Radke JC. Neural conduction of the Myo-Monitor stimulus: A quantitative analysis. J Prosthet Dent. 1975;34(3):245-253. doi:10.1016/0022-3913(75)90100-6
Google Scholar
36.
Frucht S, Jonas I, Kappert HF. Muscle relaxation by transcutaneous electric nerve stimulation (TENS) in bruxism: An electromyographic study. Fortschr Kieferorthop. 1995;56(5):245-253.
Google Scholar
37.
Eble OS, Jonas IE, Kappert HF. Transcutaneous electrical nerve stimulation (TENS): its short-term and long-term effects on the masticatory muscles. J Orofac Orthop. 2000;61(2):100-111. doi:10.1007/bf01300352
Google Scholar
38.
Monaco A, Cattaneo R, Marci MC, Marzo G, Gatto R, Giannoni M. Neuromuscular diagnosis in orthodontics: effects of TENS on maxillo-mandibular relationship. Eur J Paediatr Dent. 2007;8(3):143-148.
Google Scholar
39.
Cooper BC, Kleinberg I. Establishment of a temporomandibular physiological state with neuromuscular orthosis treatment affects reduction of TMD symptoms in 313 patients. Cranio. 2008;26(2):104-117.
Google Scholar
40.
Jankelson B. Neuromuscular aspects of occlusion. Effects of occlusal position on the physiology and dysfunction of the mandibular musculature. Dent Clin North Am. 1979;23(2):157-168.
Google Scholar
41.
Thompson JR. The rest position of the mandible and its significance to dental science. J Am Dent Assoc. 1946;33(3):151-180. doi:10.14219/jada.archive.1946.0034
Google Scholar
42.
Jankelson B, Swain CW, Crane PF, Radke JC. Kinesiometric instrumentation: a new technology. J Am Dent Assoc. 1975;90(4):834-840. doi:10.14219/jada.archive.1975.0164
Google Scholar
43.
Howell PGT, Ellis S, Johnson CWL, Watson IB, Klineberg I. The recording and analysis of EMG and jaw tracking. II. Reproducibility of jaw tracking. J Oral Rehabil. 1993;20(1):33-43. doi:10.1111/j.1365-2842.1993.tb01512.x
Google Scholar
44.
Higashi K. A clinical study on the relationship between chewing movements and masticatory muscle activities. Osaka Daigaku Shigaku Zasshi. 1989;34(1):26-63.
Google Scholar
45.
Ayinala M, Poovani S, Thumati P, Shetty G, Radke J. Mastication Analysis of patients with mandibular Kennedy’s Class I situation with or without modifications, before & after treatment partial denture insertion; an in vivo study. ADT&T. Published online January 4, 2021.
Google Scholar
46.
Thumati P, Thumati RP, Radke J. Changes in objective masticatory measurements after prosthodontic treatment. ADT&T. Published online January 15, 2020.
Google Scholar

Appendix I (Supplementary)

Panoramic X-rays were used to evaluate the structures supporting the remaining teeth and the extent of the previous treatments. Figure A.

Figure A
Figure A.Panoramic X-Ray of a patient prior to treatment. Extensive degradation of the oral structures, numerous root canals and previous dental treatments are evident suggesting a complete mouth rehabilitation would be justified.

Electrode placement is best when the line between the two bipolar contacts is parallel to the direction of the muscle fibers as in Figure B.31 The masseter activity recorded is weighted toward the superficial fibers, not accepting as much from the deep masseter. The temporalis activity is from the anterior fibers, which is a common placement simply because of the difficulty of placing electrodes in areas covered in hair.

Figure B
Figure B.Electrode placements for masseter and anterior temporalis muscles.

Anterior guidance or cuspid protection has been repeatedly shown to be a valuable addition to an occlusion and it can be measured with the T-Scan (Tekscan, Inc. South Boston, MA USA). Figure C is an example of the measurement of Disclusion Time (DT), the time required to compete a lateral excursion from centric occlusion. The reduction of the disclusion time and the removal of posterior (molar and premolar) interfering contacts is termed Disclusion Time Reduction (DTR), originally referred to as Immediate Complete Anterior Guidance Development (ICAGD).

Figure C
Figure C.A pre-treatment disclusion time from C to D in the time graph of 3.04 seconds that ends in the left posterior dentition.

After the restoration was completed and the occlusion adjusted for a short Disclusion Time the excursion could be accomplished in 0.41 seconds and terminated at the cuspid. See Figure D.

Figure D
Figure D.Post treatment disclusion time from C to D in the time-graph of 0.41 seconds and termination at the cuspid