Introduction
There are two general criteria that are used to justify a full mouth reconstruction; 1) to create a more cosmetically pleasing smile, including restoring a more physiologic occlusal vertical dimension (OVD), and 2) to restore a patient’s ability to masticate more effectively when their natural dentition is severely damaged. The first reason is more often considered because cosmetic issues are clearly visible to both the patient and the dentist, but the second reason is actually critical to maintaining good health. In general, masticatory dysfunction reduces the extraction of nutrients from food,1 especially from all those healthy raw vegetables, and it can lead to the development of irritable bowel syndrome (IBS).2,3
When individuals have not maintained their dentitions for decades at some point a major reconstruction can be the best option to restore effective masticatory function and simultaneously their cosmetic appearance. Missing teeth, chipped teeth, eroded teeth, rampant decay, the extensive failing of previous restorations and posterior bite collapse are all factors that indicate reconstruction may be functionally beneficial.4,5 Although perfect restoration of function may not be possible, improvement in masticatory function is a reachable goal. Although it may or may not be possible, it is not necessary to achieve perfect masticatory function. Even though patients are often not aware of extent of their dysfunction, a significant improvement to the patient’s ability to function will usually be recognized and very satisfying.
With modern computer technology it is now possible to measure the quality of masticatory function and identify any improvements that are achieved. This is important because asking the patient “how well can you chew” suffers from the fact that the process of degradation is usually so gradual that it is not even perceived by the patient. The patient with severe degradation adapts very gradually to their condition over a very extended period of time and consequently cannot precisely evaluate the extent of their current limitations. Thus, the patient cannot provide much guidance for what needs to be restored.
There are two current approaches used to evaluate masticatory function; 1) particle size measurement of a bolus chewed for a fixed number of cycles6,7 or 2) the analysis of the combined recording of the chewing motions and muscle activity.8–11 The first method is messy, time consuming to apply and does not evaluate the quality of muscle function. However, by simultaneously recording the motions and comparing the muscle activity of a patient while chewing to control values, a reliable indication of a patient’s masticatory restrictions can easily be obtained.9–11
Measurement of Chewing Motions
There are thirty-four measurable movement parameters that are associated with incisor-point motions that are utilized for mastication.12,13 See Figure 1. Many of these parameters can be altered by temporomandibular disorders (TMDs), but they can also be changed in non-TMD subjects when the occlusion and/or the maxillo-mandibular relationship have been altered by damaged and or missing teeth. Tracking all of these parameters from pre-treatment through final treatment can be an effective way to evaluate the efficacy of treatment with respect to function. Since the nature of mastication is complex, only some of these parameters are altered within a specific case.
There are many combinations of changes and they vary greatly among dysfunctional subjects. These 34 parameters can all be calculated automatically by software, reducing the effort required to analyze each patient. In addition, software can quickly graph mean patterns of a patient’s incisor-point chewing motions in frontal, sagittal, horizontal and velocity planes superimposed over mean normal patterns that have been well established.14–16 See Figure 2.
The ability to recognize the significance of these patterns was contingent upon measuring a substantial control group to establish norms for comparison.17 Previous work has indicated that TMJ internal derangements slow the cycle time, increase variability and reduce the vertical component of masticatory patterns.18 The most comprehensive and innovative normal movement studies occurred in Japan nearly 30 years ago led by Professor Takao Maruyama.14 His group found that the shape of the patterns is more important than the absolute values of the parameters. Because the shapes of the patterns in Figure 2 mimic the mean normal shapes, one can see that this subject has good masticatory function without even looking at the numerical values. Achieving an ideal ACP is not a requirement, but it can be used as a target for indicating the extent of masticatory improvement towards ideal function.
Measurement of Muscle Activity
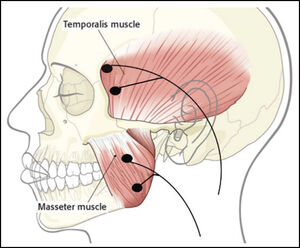
There are nine EMG muscle activity parameters that can be recorded electromyographically while a subject is chewing a soft or hard bolus to evaluate the quality of muscular function during mastication.12,13 See Figure 3. The muscles most commonly recorded bilaterally are the anterior temporalis and the masseter muscles since they are active during the crushing of the bolus.19–21 An indication of the opening activity can be recorded from the anterior digastric in the suprahyoid area,22 but the lateral pterygoid is not accessible using non-invasive surface electrodes.23 The importance of working masseter function was revealed 25 years ago by comparing the EMG activity of dysfunctional subjects to normal controls.24 Recently, a definitive comparison of the changes in the combined masticatory EMG and incisor-point motions from before to after routine prosthodontic treatments also revealed normative control group values.25
A graphic display of the Average Chewing Pattern (ACC) of the anterior temporalis and masseter muscles can give a visual indication of the relative normality of the muscular function.25 See Figure 4. This ACC graph indicates that the working masseter is expected to be the most active and the non-working masseter the least active. This graphic can reveal an adapted-compromised condition where the subject does produce a normal appearing ACP, but does so with a non-normal appearing ACC.
Masticatory muscle activities are commonly recorded with two distinct bolus types, gum and a hard bolus. The gum bolus is very easy to chew and works best to detect the presence of interfering tooth contacts that elicit silent periods within the EMG burst when occurring frequently within cycles.26 The hard or tough bolus increases he stress the masticatory system and often reveals difficulty with mastication that gum chewing does not disclose.
Vertical Dimension of Occlusion
A number of clinical parameters have been developed to judge the aesthetic restoration of a collapsed OVD such as the Golden Vertical Proportion of 1:1.618.27,28 See Figure 5. This proportion seems to hold true regardless of whether the facial skeletal structure is mesofacial, brachyfacial or dolichofacial. However, it does seem to define the mesofacial type when applied to the complete facial pattern. See Figure 6.
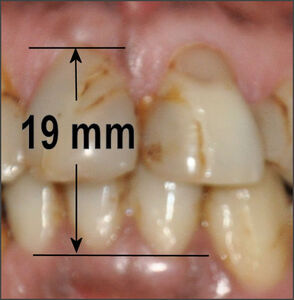
The Median Shimbashi Measurement (MSM) is between 17-18 mm from the cementoenamel junction (CEJ) of the upper central incisors to the cementoenamel junction of the lower central incisors with the teeth in centric occlusion.29 See Figure 7. Some have confused the first set of measurements by Dr. Hank Shimbashi, which in a Class I control group averaged 19 mm at rest position, with the same distance later averaged between 17 mm and 18 mm in centric occlusion. While these are not absolute values, they are useful guidelines to re-establishing a comfortable vertical dimension and it has been widely reported that patients with worn dentitions and severe malocclusions often measure well below 17 mm.30
Objective
The objective of this study was to document improvements in masticatory function that are objectively observable after a full mouth reconstruction that is functionally focused.
Methods
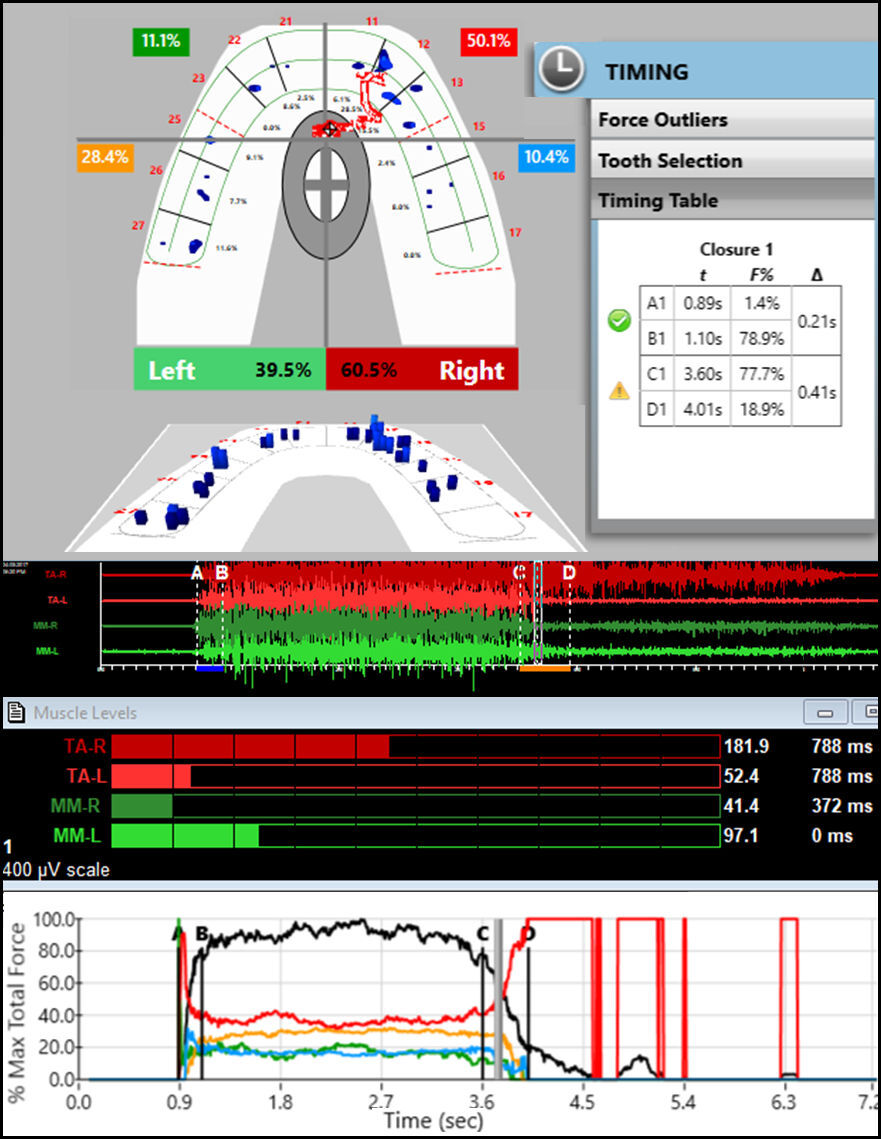
A series of 38 patients seeking extensive dental restorations due to severely damaged dentitions were evaluated from medical histories, clinical examinations, and panoramic x-rays. See Figure A in the appendix. Prior to any treatment each subject was fully informed and agreed to participate in this study. Each subject was recorded using a magnet-based incisor-point jaw tracker coupled to an eight-channel surface electromyograph (JT-3D connected with BioEMG III, Bioresearch Associates, Inc. Milwaukee, WI USA). See Figure 8. Bipolar electrodes were placed bilaterally over the anterior fibers of the temporalis and the superficial fibers of the masseter muscles with the electrode’s long axis parallel to the direction of the fibers. See Figure B in the appendix.
Records were taken first while chewing gum on the left and right sides (2 separate records). 2 additional records were taken while the subject masticated a hard bolus, consisting of Chikki (a peanut based candy). Precisely the same recording procedure was repeated 1 month post treatment. During each recording session, three-dimensional incisor-point motions were captured simultaneously along with the activities of the bilateral superficial masseter and anterior temporalis muscles at a more than adequate sample rate of 2000 samples/second/channel. See Figure 8.
The inclusion criteria: Good general health, an extensive need for restorative dental prostheses, a willingness to participate and a signed informed consent.
The exclusion criteria: Any systemic disease, severe temporomandibular disorders, inability to chew gum or a hard bolus prior to treatment or a beard preventing masseter electrode placements.
The frequencies of interest for surface EMG recordings of masticatory activities are from about 30 Hz to about 500 Hz because higher frequencies consist mainly of baseline noise and contribute little to the clinically relevant amplitude. Using a frequency cutoff lower than 30 Hz allows artifacts to contaminate the muscle data.31 Frequencies between 0 and 20 Hz are particularly unstable because they result primarily from the highly variable firing rates of muscles, which are continuously changing during all masticatory function.32–34
Statistical Analysis
The data of this study were analyzed clinically and statistically within the Mastication Analysis portion of the BioPAKTM computer program (Version 8.8, BioResearch Associates, Inc. Milwaukee, WI USA) and again after transferring these datasets into Excel (Microsoft, Inc. Woodinville, WA USA) for additional statistical analysis. After determining that the data were normally distributed, Student’s t test was used to compare the pre-treatment values to the one-month post-treatment values. After calculating the ACP and the ACC, only the parameters that changed significantly for the whole group are reported here. A value of p < 0.05 was chosen for statistical significance and p < 0.10 for indicating a trend if the change was directionally the same.
Bite Registration
After the tooth preparations were completed, the subjects received 45 to 60 minutes of ULF-TENS applied to the Vth and VIIth cranial nerves bilaterally through the coronoid notch to relax all the muscles innervated by them.35–37 (QuadraTENS, Model QT-42, BioResearch Associates, Inc. Milwaukee, WI USA). ULF-TENS was followed by a bite registration at a neurophysiologic position of the mandible in relation to the maxilla, which was used to fabricate all prosthetic solutions. Although this procedure was originally established more than 50 years ago to prosthetically correct a fully collapsed maxillo-mandibular relationship in patients exhibiting symptoms of temporo-mandibular disorders, it has subsequently been found to be useful for planning a variety of restorative and orthodontic treatments for patents without extensive muscular TMD symptoms.38–40
Results
Muscle Activity Parameters
Of the nine EMG parameters, five were found to be significantly changed within this group one month after treatment when compared to the pre-treatment values. See Table 1. The Mean Area, which is a measure of intensity, increased significantly for 3 of the 4 conditions (p < 0.05), but not for the right side chewing of a hard bolus, which did however trend in the same direction (p = 0.0786). The coefficients of variation decreased significantly for all conditions (p < 0.05). The peak amplitudes increased for all, but only significantly for the Right gum bolus (p < 0.05). The time from beginning of opening to 50 % of the peak values was significantly reduced for 3 of the 4 conditions, but not for the right gum bolus, which did trend in the same direction (p = 0.0981). The time from the peak intensity to the end of closure increased significantly for 2 of the 4 conditions (p < 0.05) and trended in the same direction for the other two conditions (p < 0.10).
Left Chewing Timing Parameters
This group was specifically asymptomatic of severe TMDs symptoms and therefore presumably adapted to their damaged dentitions. Thus, of the 34 potential movement parameters, only seven were most often significantly changed from pre-treatment to 1 month post treatment. See Table 2. The Opening Time was reduced for both Gum and the Hard Bolus, but only the Gum changed enough to achieve significance (p < 0.05). The opening standard deviation (variability) was reduced with both boluses, but the change was significant only for the Hard Bolus (p < 0.05). The complete Cycle Time was reduced for both bolus types (p < 0.05). The Standard Deviation of the Cycle Time was reduced for both bolus conditions, but only reached a level of significance for the Hard Bolus (p < 0.05). The hard bolus is more challenging and therefore is a more definitive test of good function.
Left Chewing Positional Parameters
The Turning Point (TP) is the point at which the opening movement transitions to closing and it is the point farthest from the intercuspal position in the three dimensions of vertical, antero-posterior and lateral. The Vertical Turning Point increased slightly but not enough to indicate significance (p > 0.05). Note: This vertical parameter is more affected by the size of the bolus than by any change in the occlusion, which requires standardizing the bolus size. However, the Antero-Posterior Turning Point did increase significantly for both conditions (p < 0.0046), indicating a definitive change in the position of the TP. See Table 2.
The Terminal Chewing Position (TCP) is the point at which the bolus is maximally crushed or the closest point to the intercuspal position. The Vertical TCP was reduced with both boluses, but only decreased enough to reach significance with the hard bolus (p < 0.05). The antero-posterior and lateral values of the TCP are usually restricted by the occlusion to small values and are only variable when the dentition is severely worn. See Table 2.
Right Timing Chewing Parameters
The Right Opening Times did decrease slightly for both bolus conditions, not significantly, but suggestive of a possible trend for the hard bolus condition (p = 0.0746). The Opening Standard Deviation decreased for both conditions (reduced variability), but significance was only reached for the gum bolus (p = 0.0485), while the Hard Bolus suggested a possible trend in the same direction (p = 0.0601). The Cycle Times were reduced under both bolus conditions (p < 0.05). The cycle Time Standard Deviations were reduced under both bolus conditions, but the change was significant for the hard bolus (p = 0.0114), not significant for the Gum bolus data. See Table 3.
Right Chewing Positional Parameters
The Vertical Turning Point (VTP) increased for both bolus conditions but only showed a trend for Gum chewing (p = 0.0581). The Antero-Posterior Turning Point (ATP) did increase significantly for both conditions (p < 0.03), indicating a definitive change in the position of the ATP. See Table 3. In contrast, the Vertical Terminal Chewing Position was reduced significantly only for the Hard Bolus (p = 0.0427).
Discussion
When statistically analyzing the database of a heterogenous group like this one, it is important to realize it is probable that some of the subjects had rather normal function on one side and dysfunction only on the other side. Thus, for the analysis of each side, some normal data was likely mixed with the dysfunctional data diluting it somewhat. If the data were limited to only dysfunctional motions the differences could have been be greater.
Surface Electromyography has been developed for use in dentistry for the past 70+ years.41 Magnetic incisor-point jaw tracking has also been continuously utilized and further developed for many decades prior to the present.42 However, the application of incisor-point tracking combined with EMG applied to masticatory function has been a more recent approach. The reproducibility of combined EMG muscle activity and incisor-point masticatory motion data have been shown to be very good, especially with respect to timing.43 An early combined study found that joint and muscle dysfunctions alter both the movement and muscle activity during chewing.44
Average Chewing Cycle
The Average Chewing Cycle (ACC) graphically reveals the average activity pattern of the masseter and anterior temporalis muscles during chewing.45,46 Figure 4 revealed the mean muscle activity patterns of a large control group with no symptoms and Class I occlusions. Although the mean pattern is altered somewhat for Class II and Class III, those differences are readily recognized. The ideal mean ACC, just like the mean ACP, is a target to pursue but it is not necessary to match it exactly to achieve acceptable function. All patients have some degree of adaptive capacity, reducing any requirement to achieve perfection. However, any improvement that moves the patient closer to the ideal pattern may indicate an improved functional capability. The ACC pattern in Figure 9 is not the worst possible by any means, but the pattern in Figure 10 changed closer to the mean normal pattern (Figure 4) and it also changed to a completely normal (1 – 2 – 3 – 4) hierarchy.
One month after the treatment was finalized a recording was made to check the progress. See Figure 10.
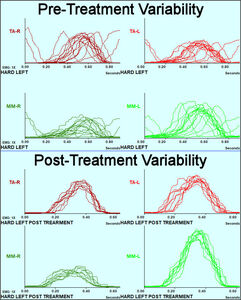
In this patient example the variability in the ACC was also reduced after treatment as well. Figure 11 is a view of the muscle activity cycles superimposed, which visually shows precisely the extent of the variation from cycle to cycle (top half) and the reduced variability after the finalization of treatment (bottom half). A moderate level of variation is required to masticate a bolus as it is changing, but dysfunction adds significantly to the extent of the variation.9,12,13
This group of subjects exhibited severe damage to their dentitions, but did not complain of TMD-like symptoms, indicating that they were able to tolerate their unfavorable conditions with high adaptability. Other individuals with similar conditions, but less adaptability, could become TMD symptomatic. Figure 12 is an example of a pre-treatment ACP. The frontal view indicates a worn-flat occlusion and a very flat sagittal angle of opening/closing. The size of the pattern is abnormally small (< 10 mm vertical opening) and the velocity is consistently interrupted, both in opening and in closing. The opening movement is anterior and lateral with minimal vertical change, which indicates a complete lack of any anterior guidance. In Figure 12 the patient’s movement patterns are nothing like the mean normal patterns, a clear indication of masticatory dysfunction.
One month after restoration of the dentition the ACP (red/cyan) of the patient from Figure 12 has dramatically changed and exhibits patterns more like the mean normal patterns (black shapes). See Figure 13.
Visually Assessing Cosmetics
When visually assessing the changes in the patient’s appearance, the cosmetic aspects of the case can be readily seen by both the patient and the dentist. Figure 14. Cosmetic changes have therefore been the main drivers of reconstructive services. In contrast, changes in the functionality are not obvious to the observer. Consequently, the importance of good masticatory function has mostly been ignored by dentistry until recently. Poorly functioning patients are often unable to express a need for improved masticatory function as they have no reference for what is good function. It is only through the objective measurement of function that the extent of any dysfunction can be accurately disclosed. While the changes in the appearance of the dentition in Figure 14 is obvious, nothing about its appearance indicates whether the quality of masticatory function has improved.
Limitations
Due to the large number of variables included in this study the sample of 38 subjects may have been somewhat less than sufficient to maximize the significance of all of them. A larger sample segmented by conditions could have revealed additional significance hidden within this limited heterogenous database. While there are many parameters involved in jaw motion, only a few are usually affected by any single condition. The masticatory system is very complex and consequently, many factors can and do affect the performance of it. This group of subjects was selected without categorizing them with respect to their specific conditions except to not be considered TMD symptomatic.
Conclusions
After treatment five mean muscle parameters were found to be significantly closer to those of a previously recorded control group. Five mean chewing movement parameters also changed significantly to better match the previously established control values.
Clinical Significance
The ability to objectively evaluate masticatory function can offer the dentist and the patient a method to add functional criteria to their cosmetic criteria for what constitutes treatment success.
Disclosure of potential conflicts
Mr. Radke is the Chairman of the Board of BioResearch Associates, Inc. but receives no commission from sales. No other potential conflicts were reported.
Funding statement
No funding was received from any source for this project.

_in_three_dimensions_from_.jpeg)

_shows_the_in.jpeg)


_.jpg)
_one_month_after_treatment_has_been_finalized._t.jpg)

.jpg)
_and_velocity_of_chewing_a_hard_bolus_is_dramatically_greater_in.jpg)


_in_three_dimensions_from_.jpeg)

_shows_the_in.jpeg)


_.jpg)
_one_month_after_treatment_has_been_finalized._t.jpg)

.jpg)
_and_velocity_of_chewing_a_hard_bolus_is_dramatically_greater_in.jpg)


