Processing math: 100%
1.
Matos M, Thumati P, Sutter B, et al. Are Temporomandibular Disorders Really Somatic Symptom Disorders? Part III – Masticatory Function as Revealed by EMG and EGN. Adv Dent Tech. Published online November 22, 2021.
Download all (17)
  • Figure 1. The PHQ-15 questionnaire
  • Figure 2. Interpretation chart for PHQ-15 scores
  • Figure 3. Symptom Pain Scale questions and scoring
  • Figure 4. Symptom Frequency questions and scoring
  • Figure 5. Functional Restrictions questions and scoring
  • Figure 6. A graphic depiction of the symptom reductions and left chewing movement change that occurred as treatment progressed.
  • Figure 7. A graphic depiction of the symptom reductions and the right-side chewing changes that occurred as treatment progressed.
  • Figure 8. Correlation between symptoms and PHQ-15 median scores Vs left-side chewing values of timing and jerkiness.
  • Figure 9. A correlation between the symptoms and right-side chewing values of reverse A/P and jerkiness.
  • Figure 10. Normalized left-sided EMG activity parameters of the 4 muscles combined.
  • Figure 11. Normalized right-sided EMG activity parameters of the 4 muscles combined.
  • Figure 1A. Normal Average Chewing Pattern (ACP) shows the cycle shape and the Turning Point at the most open position.
  • Figure 2A. The timing and position parameters that are associated with EGN in a Class I control subject example. Mean normal cycle time is 750 milliseconds, with Opening Time > Closing Time > Occlusal Time. Terminal Chewing Position falls between 0.0 and 0.1 mm for chewing gum. Maximum Closing velocity > Opening velocity > 100 mm/second
  • Figure 3A. Average Chewing Cycle (ACC) of an Angle’s Class I control subject exhibiting the normal hierarchy of muscle function during chewing: working masseter > working temporalis > balancing temporalis > balancing masseter.
  • Figure 4A. Ideal smooth chewing by control subject. The Jerk function includes just 2 peaks in opening and 2 in closing (purple line).
  • Figure 5A. One cycle of chewing from a dysfunctional subject with a very jerky chewing motion.
  • Figure 6A. An example of an asymptomatic control group compared to a dysfunctional group chewing gum

Abstract

Objectives: The objectives of this research were; 1) to compare the changes in PHQ-15 scores to the changes in the EMG and EGN
chewing data 2) to compare the progression of pain intensity, frequency of symptoms and functional restriction scores to the
progression of EMG and EGN measurements.
Methods: 6 TMD treatment centers recruited 82 TMD patients willing to answer PHQ-15 questions prior to treatment, 3 weeks post
treatment and 3 – 4 months post treatment. Pain Intensity, Symptom Frequency and Functional Restrictions were surveyed and
masticatory function was recorded at each time point. TMD patients diagnosed with “muscular” symptoms were treated with DTR via
Immediate Complete Anterior Guidance Development coronoplasty. TMD patients with TMJ internal derangements revealed by JVA
and imaging included application of ULF-TENS, orthotic TMD appliances, NSAIDs, exercises and/or orthodontics or prosthetics for
final restoration. Student’s t test was applied to measured data, Wilcoxon Signed Rank test to survey data.
Results: After 4 months of treatment the group’s PHQ-15 score declined from a pre-treatment median of 10 to a post-treatment
median of 4 (p < 0.00001). The Symptom Pain Scale reduced from a pre-treatment median score of 20 to a post-treatment median of 6
(p < 0.00001). The Symptom Frequency Score reduced from a median of 17 to 5 (p < 0.00001) and for the Functional Restriction
score from a median of 7 to 1 (p < 0.00001). Significant changes in chewing motion and muscle function were correlated with the
reductions in pain, symptom frequency, functional restriction and the PHQ-15 scores (p < 0.05).
Conclusions: The pre-treatment PHQ-15 median group score was significantly reduced after physical treatments. Thus, a high PHQ-
15 score could be accepted as a false positive indication of SSD prior to treatment. Also, the PHQ-15 scores continued to significantly
reduce at 3 – 4 months after the end of physical treatment. The concurrent significant improvements in the masticatory timing, motion
and muscle function support a physical rather than psychological etiology for this group’s TMDs.

Introduction (from Part I)

Temporomandibular Disorders (TMDs) are a category of at least 40 distinct conditions negatively affecting the function of the stomatognathic system.1 Many TMD conditions include internal derangements of the articulating disc within the temporomandibular joint that is often followed by degenerative changes in the joint.2,3 The degenerative progression is most strongly related to disc displacement without reduction.4 Some studies have found that TMDs are likely to result from the partial or complete loss of molar dentition causing mainly muscular symptoms (orofacial pain).5–7 Others have found that occlusal interferences to function can precipitate TMDs,8–11 while divergent studies have been unable to find any etiologic relationship with occlusal variables,12 especially within short-term and pilot studies.13 A separate skeletal structural issue related to the masticatory system is Angle’s occlusal classifications. There is evidence that Class II occlusal arrangements have a greater propensity toward developing substantial TMDs symptoms, but Class II and other skeletal problems can also result from the structural consequence of TMJ damage.14–16

Congenital conditions such a cleft lip and cleft palate have been shown to reduce the quality of life and masticatory function even after treatment.17 Ehlers-Danlos syndrome is another genetic disorder that increases the propensity toward developing TMDs.18 One recent study concluded that single-nucleotide polymorphisms can aid or abet the development of TMDs after orthognathic surgery.19 Abnormal growth and development have also been identified as contributors to TMDs conditions. Bacterial infections have been found to be significantly more prevalent in TMDs patients than in healthy subjects.20–23

Psychoneuroimmunology has theorized that emotional stress can be either an etiologic factor or an exacerbating factor in precipitating or perpetuating TMD and chronic orofacial painful conditions.24–26 Somatization, recently renamed as Somatic Symptom Disorder (SSD), has been proposed as a primary etiology of at least some TMDs and orofacial pains.27 The Research Diagnostic Criteria (RDC/TMD),28 in Axis II, has recommended the Beck Depression Inventory-II to measure depression and the subscale of the SCL-90 to evaluate somatization.29 However, it is common knowledge that SSD cannot be distinguished just by symptoms from underlying physical conditions/diseases because they simply share the same symptoms. It was stated in the RDC/TMD that the SCL-90 does not measure somatization. Of course, psychiatry understands very well that all possible physical sources of symptomology must be discounted before testing for SSD is likely to be efficacious.

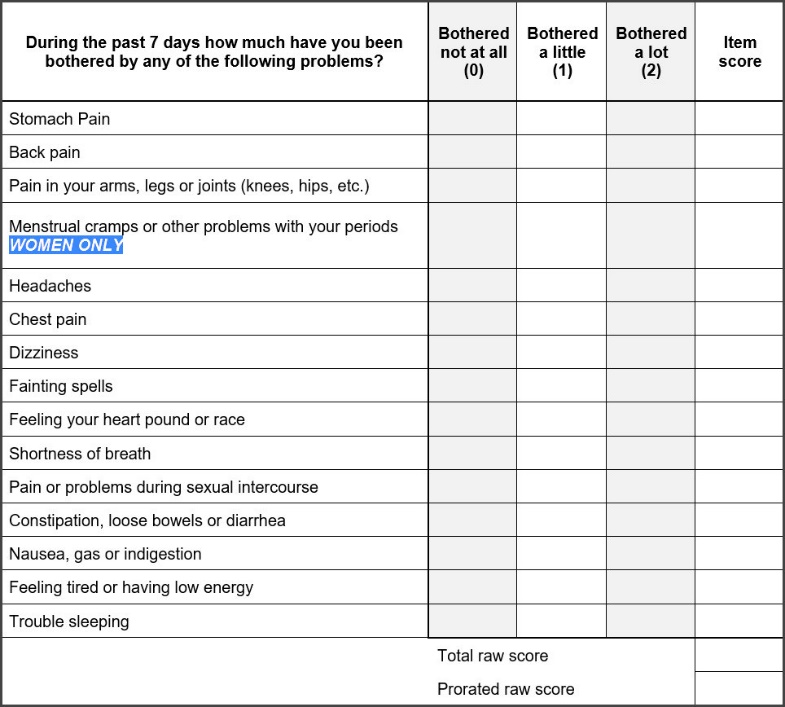
The Patient Health Questionnaire-15 (PHQ-15), validated by testing a large normal population, is a fifteen-question anamnestic instrument used by many psychiatrists and psychologists to evaluate SSD in the absence of a definite indication of any physical etiology.30 See Figure 1.

Figure 1
Figure 1.The PHQ-15 questionnaire

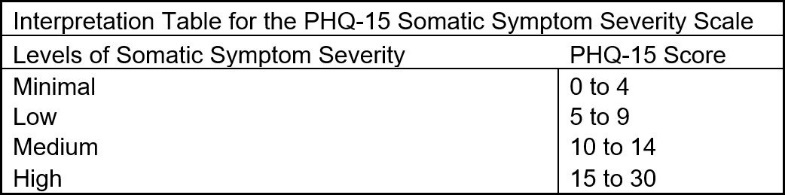
Each question is supplied with three possible answers; 1) not bothered at all, 2) bothered a little, or 3) bothered a lot (during the past 7 days). The totaled score ranges from 0 to a maximum of 30. Normative scores across the population are generally less than 5 and increase gradually with age. Moderate SSD is indicated by scores from 10 to 14, while a score of 15 indicates a percentile rank between 92.8 and 99.7.30 Higher scores = higher probability. See Figure 2.

Figure 2
Figure 2.Interpretation chart for PHQ-15 scores

With so many factors potentially contributing to TMDs it is not surprising that controversy has been the most common overall result of TMDs research. A previous study that utilized the Beck Depression Inventory-II, compared depression scores from TMDs subjects pre to post successful physical treatment. While most of the subjects had exhibited moderate to severe depression pre-treatment, successful physical treatment reduced all of their levels to within normal limits, removing depression by itself as a potential etiologic factor for the group.31

Objectives

The objectives of this report were 1) To compare the changes in the PHQ-15 scores to the changes in the masticatory function as indicated by EMG and EGN data and 2) to compare the progression of pain intensity, frequency of symptoms and functional restriction scores to the concomitant progression of masticatory function. The Null hypothesis = No correlation between the PHQ-15 scores or any of the symptom mean scores and the masticatory motion and muscle activity parameters.

Methods

For this study six highly experienced private practices specializing in the treatment of TMDs patients were

recruited from four countries (U.S.A., Mexico, Brazil and India). Two of the practices (PT & BS) focused specifically on treatment of TMDs patients without serious TMJ involvement, which could also be termed Orofacial Pain patients with a preponderance of orofacial, painful, muscular symptoms and an absence of TMJ pain. Their treatments were limited to adjusting the occlusion using a well-established protocol for the T-Scan (Tekscan, Inc. South Boston, MA USA) linked to the BioEMG-III (Bioresearch Associates, Inc. Milwaukee WI USA) commonly referred to as Immediate Complete Anterior Guidance Development (ICAGD) or Disclusion Time Reduction (DTR).32–39

The other four practices were focused on arthrogenous TMD patients, most of whom had some stage of Internal Derangements of the TMJ from relatively acute to end-stage chronic conditions. Their treatment methods were varied and included the individualized application of ULF-TENS, a mixture of orthotic appliances, NSAIDs, exercises and selected orthodontic and/or prosthodontic restorative treatments for the final restoration of normal function.40–44 These four private practices were thoroughly dissimilar, geographically separated and not linked in any manner, with distinct treatment philosophies and methods. This was intentional to include a variety of treatment methods from a non-uniform group of practitioners.

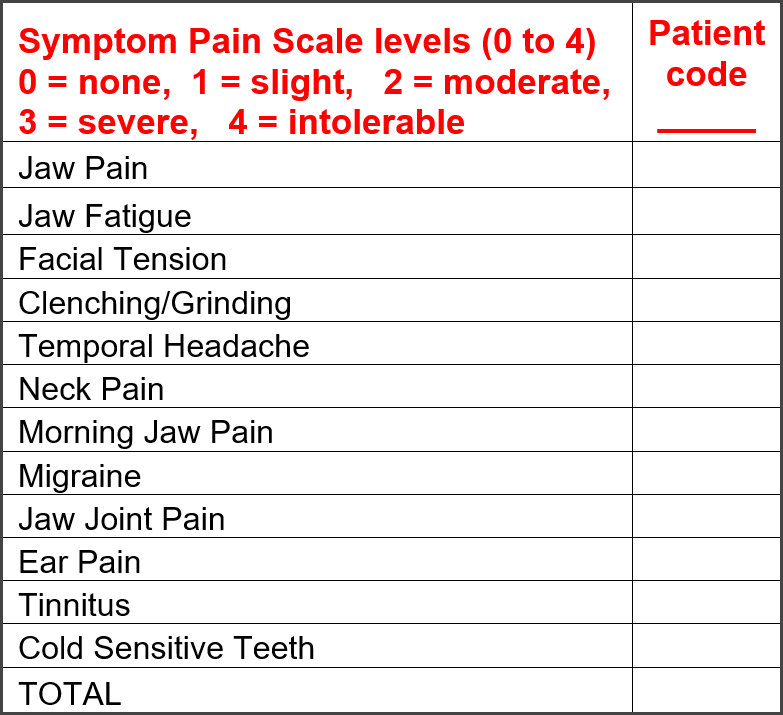
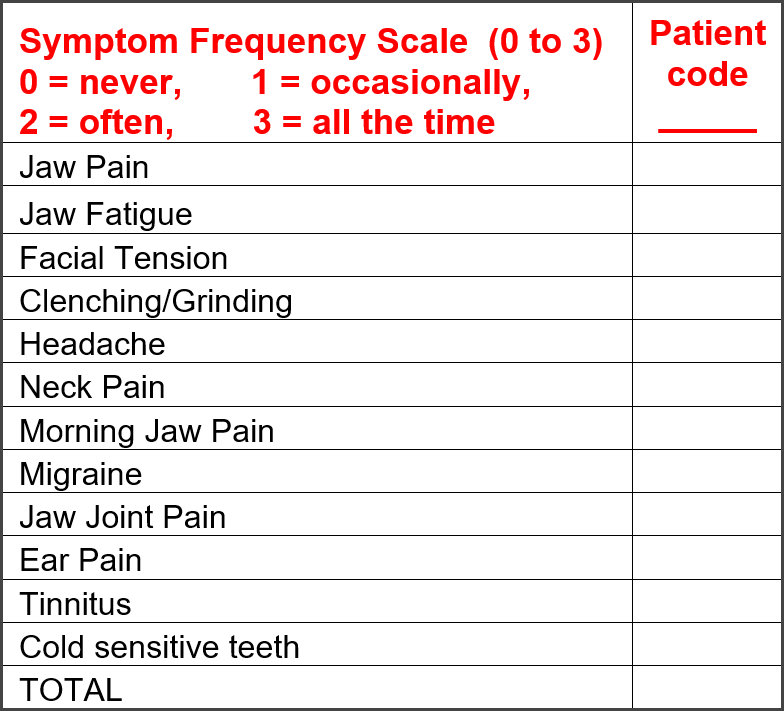
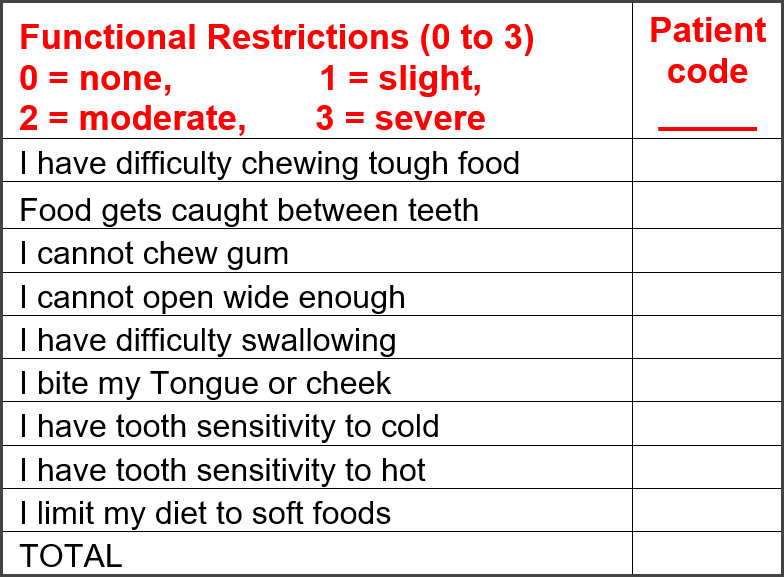
To document the symptom levels prior to treatment each practice agreed to record an anamnestic survey of each patient’s Pain Intensity, Symptom Frequency and their Functional Restrictions. See Figures 3 to 5. The questions used were taken from popular symptom surveys (e. g. RDC/TMD). After each patient had signed informed consent and agreed to treatment, they were also given the PHQ-15 instrument to respond to. All four of these anamnestic instruments were re-utilized approximately 3 weeks after initiation of treatment and at 3 to 4 months post-treatment at a follow-up appointment.

Figure 3
Figure 3.Symptom Pain Scale questions and scoring
Figure 4
Figure 4.Symptom Frequency questions and scoring
Figure 5
Figure 5.Functional Restrictions questions and scoring

All patients were recorded pre-treatment, post-treatment and at follow-up with Joint Vibration Analysis (JVA) to evaluate TMJ function.45–59 At the same appointments masticatory function was also assessed with combined electrognathography (EGN) and electromyography (EMG) recordings of gum chewing.60–71 This was done to evaluate; 1) the function of the TMJ and 2) the quality of mastication of a soft bolus (gum) using BioPAK software (BioResearch Associates, Inc. Milwaukee, WI USA). The recordings were repeated at each appointment and at the follow-up appointments. The analysis of the masticatory function data is reported in this Part III.

Student’s Paired t test was applied to the measured intra-patient EGN and EMG data, making each subject his or her own control. Consequently, no separate control group was enlisted because the purpose was simply to correlate the masticatory function data with the symptom levels and PHQ-15 scores. Wilcoxon Signed Rank test was applied to the survey data (Pain, Symptom Frequency, Functional Restriction and PHQ-15 scores) to detect significant improvements. In this third report, Spearman Correlation was used to compare the EMG and EGN data to the PHQ-15 scores, the Pain scores, the Frequency of Symptoms scores and Functional restriction reports. Alpha = 0.05.

A total of 82 patients participated, 61 females and 21 males at a ratio of 2.9:1. The mean age was 43.4 (+/- 17.2) years with a range from 14 to 76 years and a median of 42. While the age distribution was not a normal one, it does represent a range of likely candidates. This is a little older group than many previous TMD studies, which have had their mean ages in the mid to late 30s. Patients were selected sequentially as they agreed to participate. Although not a random process it fairly represents the TMD population both for patients with TMJ involvement (43) and those without TMJ involvement (39). An IRB Exemption for this study # BIRB/100Z/2019 was received.

Results

Significant improvements were observed in all symptom categories. Total pain intensity scores were extracted from the Symptom Pain Scale levels that were reported pre-treatment, 3 weeks post treatment and again at 3 – 4 months post treatment. See Table 1.

Table 1.Pain Scores reported at the three time points (6.65 is equivalent to 1.4 on a 10-point scale)
Symptom Pain Scale Scores (0 to 48)
Pre-Treatment Post Treatment 3 months follow-up
mean 21.00 9.32 6.65
SD 8.07 8.08 6.44
median 20 6 6
minimum 3 0 0
maximum 45 37 32
Wilcoxon Signed-Rank test - Pre to Post p < 0.00001
Wilcoxon Signed-Rank test - Pre to 3 mo. p < 0.00001
Wilcoxon Signed-Rank test - Post to 3 mo. p = 0.0002

In addition to their recording of pain scores, each patient was required to record the frequency of their symptoms, which was tracked prior to and throughout treatment. See Table 2.

Table 2.Symptom Frequency scores at the three time points (5.88 is equivalent to 1.6 on a 10-point scale)
Symptom Frequency Scale (0 to 36)
Pre-Treatment Post Treatment 3 months follow-up
mean 17.55 8.88 6.50
SD 6.75 6.23 5.99
median 17.5 8 6
minimum 1 0 0
maximum 34 32 26
Wilcoxon Signed-Rank test - Pre to Post p < 0.00001
Wilcoxon Signed-Rank test - Pre to 3 mo. p < 0.00001
Wilcoxon Signed-Rank test - Post to 3 mo. p < 0.00001

The group’s Functional Restriction median scores were significantly reduced by the treatments. See Table 3.

Table 3.Functional Restriction scores at the three time points
Functional Restrictions (0 to 27)
Pre-Treatment Post Treatment 3 months follow-up
mean 7.80 3.29 2.46
SD 4.78 4.27 3.33
median 7 2 1
minimum 0 0 0
maximum 25 21 19
Wilcoxon Signed-Rank test - Pre to Post p < 0.00001
Wilcoxon Signed-Rank test - Pre to 3 mo. p < 0.00001
Wilcoxon Signed-Rank test - Post to 3 mo. p = 0.00069

A dramatic reduction in PHQ-15 scores occurred post treatment. See Table 4.

Table 4.PHQ-15 scores pre-treatment, 3-weeks and 3 -4 months post treatment. n < 82 indicates some data were lost.
PHQ-15 Somatization Test (0 to 30)
n = 80 Pre-Treatment Post Treatment 3-4 months follow-up
Total Mean Score 11.6 5.6 4.7
Standard Deviation 5.07 4.60 4.14
Median Score 10 5 4
minimum 2 0 0
maximum 26 19 16
Pre-Treatment to 3 weeks Post Treatment p < 0.00001
Pre-treatment to 3 Months Post Treatment p < 0.00001
3 weeks to 3 Months Post Treatment p = 0.0039

A comparison between DTR and orthotic treatments showed no significant difference in scores prior to treatment but a significant difference post treatment. See Table 5.

Table 5.Comparison between the outcomes for occluso-muscular cases or TMJ internal derangement cases.
PHQ-15 scores between DTR and Orthotic Treatments
Orthotics n = 43 DTR n = 37 Pre-Treatment 3 weeks Post Treatment 3-4 months follow-up
Orthotic Mean 12.1 6.8 6.0
Orthotic SD 5.86 4.57 3.98
Wilcoxon Signed-rank Intra-group (orthotic) Pre to Post
p <0.00001
Pre to 3-4 mo.
p < 0.00001
Post to 3-4 mo.
p = 0.0290
Mann-Whitey U test Between Groups 0.5029 0.0053 0.0008
Wilcoxon Signed-rank Intra-group (ICAGD) Pre to Post
p < 0.00001
Pre to 3-4 mos
p < 0.00001
Post to 3-4 mos
p = 0.0287
ICAGD Mean 11.1 4 3.2
ICAGD SD 3.97 4.21 3.85

A comparison of the results of treatment between the two groups manifesting either; 1) occluso-muscular or 2) TMJ internal derangement symptoms is shown in Table 5. Those cases that had primary occluso-muscle symptoms and no substantial involvement of the TMJ had their Disclusion Times Reduced (DTR) with Immediate Complete Anterior Guidance Development (ICAGD).31–34 The TMD subjects with substantial TMJ involvement (Internal Derangements) were treated with orthotics, TENS, NSAIDs, exercises and other commonly applied methods. Most of these primarily arthogenous patients also had secondary muscular pain complaints that were significantly reduced by treatment as well. It can be seen from this comparison that the orofacial pain patients responded to a greater extent and more quickly within 3 weeks and at the 3 to 4 months timepoint.

EGN & EMG Data

(See appendix for more details)

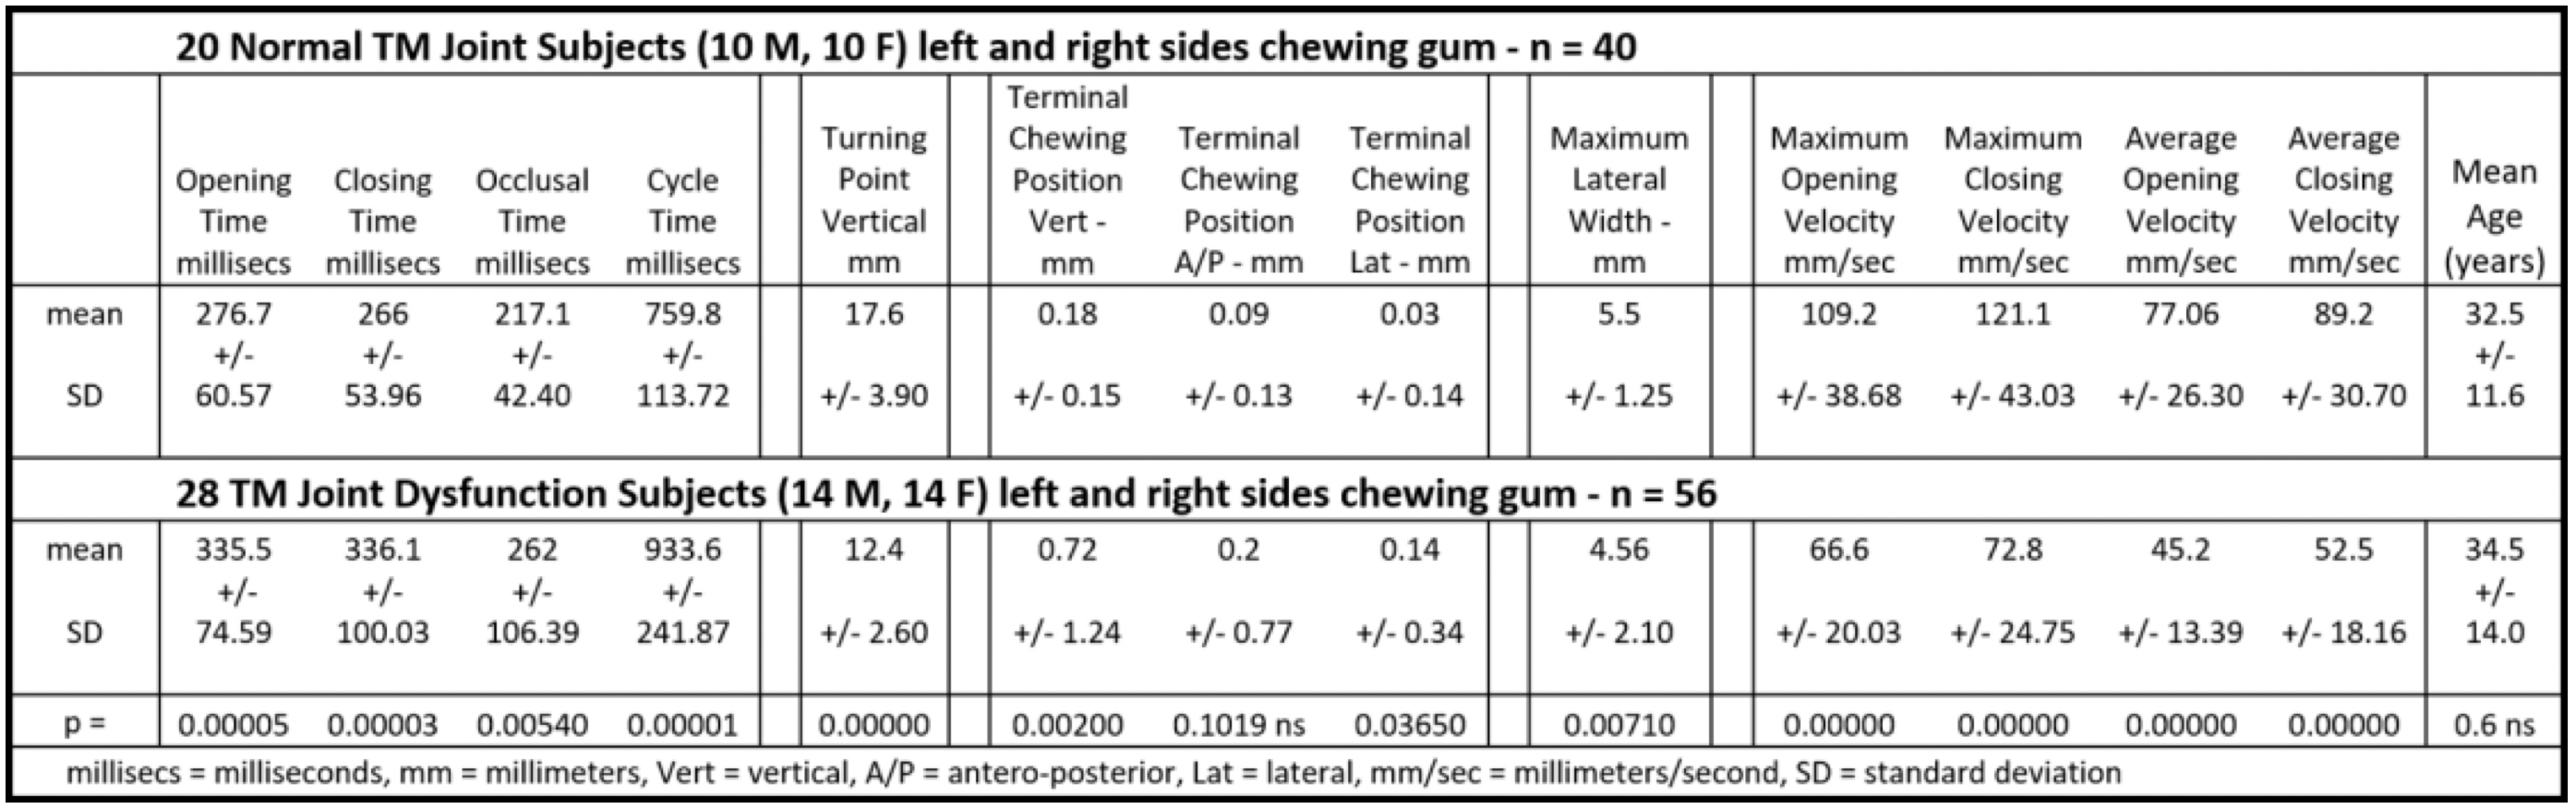
EGN (motion) & EMG (muscle activity) were recorded bilaterally simultaneously and analyzed together. Five of ten parameters from the analysis of the left side EGN data were found to be significantly improved towards normal values at 3 weeks post treatment. See Appendix for normal values. This increased to eight of ten parameters by 4 months after the start of treatment. Tables 6 & 7.

Table 6.Timing of left side chewing comparing pre-treatment to 3 weeks and 3 – 4 months post treatment. The vertical dimension of chewing did not change at any stage. n < 82 indicates some data were lost.
Timing of Mastication Vertical
Left Side Chewing Opening Time (msec) Closing Time (msec) Occlusal Time (msec) Cycle Time (msec) Vertical Turning Point (mm)
n Pre-Treatment Vs 3 Weeks into Treatment
77 Prior to Mean 337.0 284.0 257.0 844.0 13.5
treatment SD (+/-279) (+/-101) (+/-99.2) (+/-228) (+/-3.71)
Student's t test - p = 0.0877 T 0.0189 0.1993 ns 0.0092 0.3480 ns
77 3 weeks Mean 303.2 267.0 247.8 790.0 13.3
Post Tx SD (+/-129) (+/-82.1) (+/-99.1) (+/-143) (+/-3.50)
Pre-Treatment Vs 4 months Post Treatment
74 Prior to Mean 311.8 291.0 257.5 853.1 13.4
treatment SD (+/-209) (+/-113) (+/-96.3) (+/-234) (+/-3.66)
Student's t test - p = 0.0322 0.0237 0.0054 0.0037 0.4110 ns
74 4 mos Post Mean 287.5 268.5 223.8 783.2 13.2
Treatment SD (+/-73.6) (+/- 114) (+/-83.7) (+/-150) (+/-4.19)

Red = significant (p < 0.05), T = trending towards significance (p < 0.10), ns = not significant, SD = Standard Deviation, Tx = Treatment, mm = millimeters, msec = milliseconds

Table 7.The left chewing Turning Point of the antero-posterior dimension was significantly increased post treatment as were the velocities. The jerkiness decreased significantly for the closing motions and showed a trend toward the same response in opening. N < 82 means some data were lost.
A/P Velocities Jerkiness
Left Side Chewing Turning Point A/P (mm) Maximum Opening Velocity (mm/sec) Maximum Closing Velocity (mm/sec) Opening Jerkiness (# Accel. Changes) Closing Jerkiness (# Accel. Changes
n Pre-Treatment Vs 3 Weeks into Treatment
77 Prior to Mean 5.10 83.8 92.8 4.73 4.34
treatment SD (+/-4.11) (+/-43.0) (+/-36.0) (+/-1.78) (+/-1.68)
Student's t test - p = 0.0440 0.0730 0.0134 0.0859 0.0105
77 3 weeks Mean 5.98 89.6 99.1 4.43 3.99
Post Tx SD (+/-4.19) (+/-41.1) (+/-32.5) (+/-1.58) (+/-1.29)
Pre-Treatment Vs 4 Months Post Treatment
74 Prior to Mean 4.99 81.3 90.7 4.80 4.47
treatment SD (+/-4.01) (+/-38.9) (+/-35.2) (+/-1.79) (+/-1.92)
Student's t test - p = 0.0118 0.0073 0.0019 0.0890 0.0289
74 4 mos. Post Mean 6.34 94.6 103.5 4.51 4.10
Treatment SD (+/-4.27) (+/-41.0) (+/-39.9) (+/-1.26) (+/-1.37)

Red = significant (p < 0.05), T = Trending towards significance (p < 0.10), ns = not significant, SD = Standard Deviation, Tx = Treatment, mm = Millimeters, msec = milliseconds

The vertical dimension was determined by the size of the bolus and was stable as expected. The significant decrease in the durations of opening, closing, the occlusal times and the cycle times approached normal values (See appendix for normal values). Note: Five subjects did not record chewing at three weeks and eight were missed at follow-up. For the left side, five additional parameters were analyzed. See Table 7.

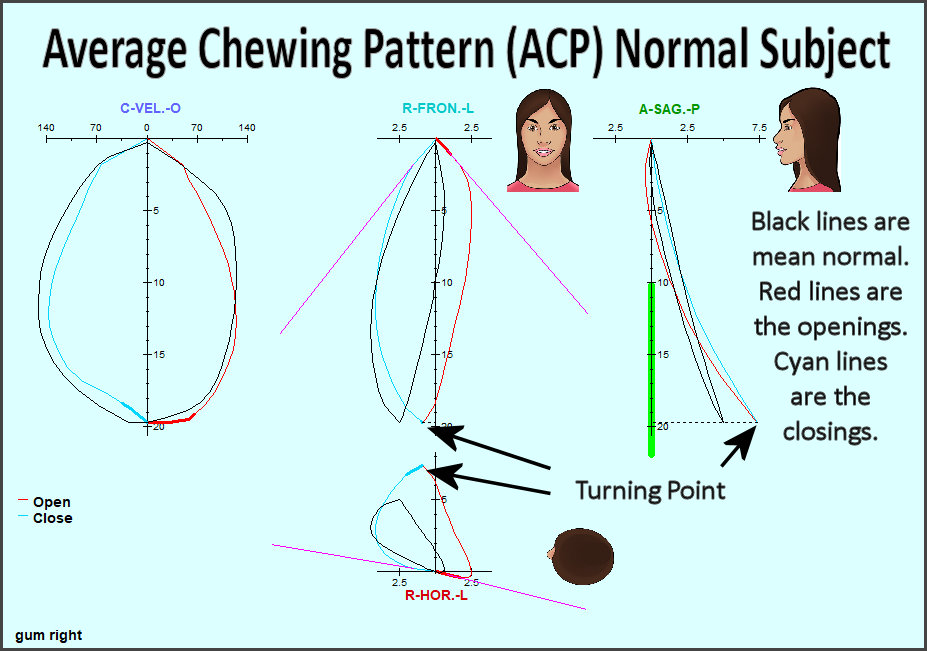
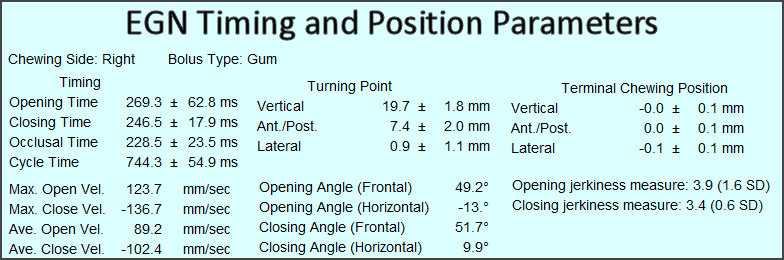
The A/P Turning Point is the antero-posterior position of the most open point in the chewing cycle. Although the vertical dimension of the Turning Point did not change, the A/P dimension increased significantly. The opening and closing velocities both increased significantly by follow-up, one indication of increased confidence. The closing jerkiness of chewing decreased significantly (smoother motion) and the opening jerkiness showed a similar trend.

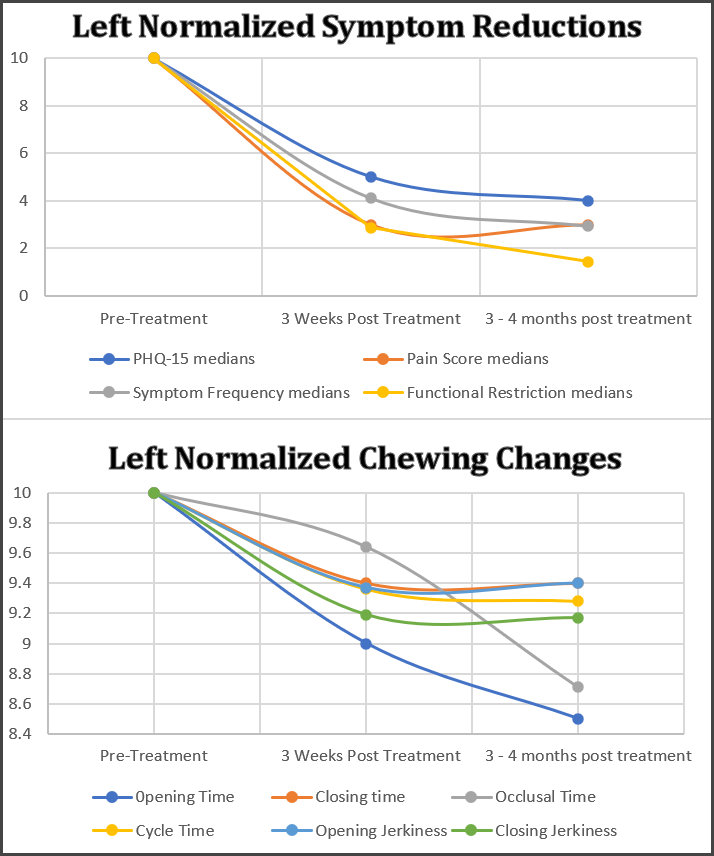
The Opening Time and the Occlusal Time changed the most between the 3 weeks and the 3 – 4 months. Figure 6.

Figure 6
Figure 6.A graphic depiction of the symptom reductions and left chewing movement change that occurred as treatment progressed.

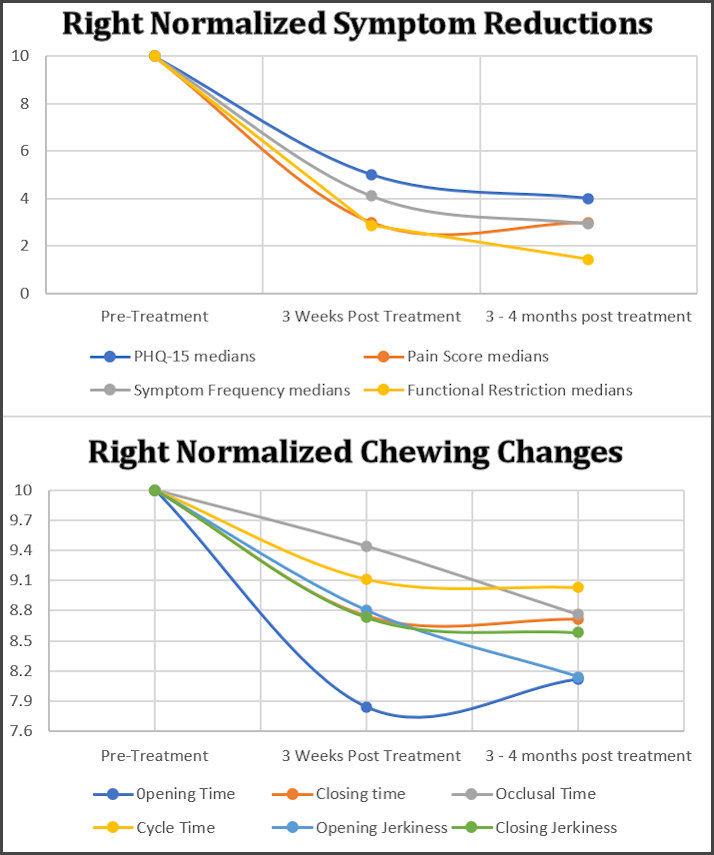
Significant decreases were found in the timing of the opening, closing, occlusal and cycle times during right-side chewing. See Table 8. Like the left side chewing, no change was recorded in the vertical dimension of the right-side chewing.

Table 8.Right side chewing timing was significantly improved. The vertical Turning Point did not change significantly because it was determined primarily by the size of the bolus.
Timing of Mastication Vertical
Right Side Chewing Opening Time (msec) Closing Time (msec) Occlusal Time (msec) Cycle Time (msec) Vertical Turning Point (mm)
n Pre-Treatment Vs 3 Weeks into Treatment
68 Prior to Mean 372.1 321.6 258.0 894.7 13.3
treatment SD 409.9 180.0 91.3 387.4 4.3
Student's t test - p = 0.0272 0.0080 0.0988 0.023 0.3023 ns
68 3 weeks Mean 291.8 281.0 243.5 815.4 13.0
Post Tx SD 102.8 104.5 86.8 172.7 3.5
Pre-Treatment Vs 4 months Post Treatment
73 Prior to Mean 342.2 332.9 251.1 893.1 13.1
treatment SD 199.3 185.1 87.6 366.9 3.8
Student's t test - p = 0.0456 0.0016 0.0167 0.0208 0.3777 ns
73 4 mos Post Mean 302.2 280.2 226.0 808.3 13.2
Treatment SD 94.1 81.10 94.40 180.2 3.9

Red = significant (p < 0.05), T = trending towards significance (p < 0.10), ns = not significant, SD = Standard Deviation, Tx = Treatment, mm = millimeters, msec = milliseconds

Five additional right-sided chewing parameters were significantly changed in a very similar way to the left-sided chewing with increased A/P Turning Point, increased opening and closing velocities and reduced jerkiness. See Table 9. Figure 7 graphically relates the reduction in symptoms to the changes in the movement parameters.

Table 9.The right chewing Turning Point of the antero-posterior dimension was significantly increased post treatment as were the velocities. The jerkiness decreased significantly for the closing motions and showed a trend toward the same response in opening.
A/P Velocities Jerkiness
Right Side Chewing Turning Point A/P (mm) Maximum Opening Velocity (mm/sec) Maximum Closing Velocity (mm/sec) Opening Jerkiness (# Accel. Changes) Closing Jerkiness (# Accel. Changes
n Pre-Treatment Vs 3 Weeks into Treatment
68 Prior to Mean 2.96 83.9 91.6 5.16 4.80
treatment SD 5.47 46.9 43.5 3.36 2.88
Student's t test - p = 0.0069 0.0282 0.0442 0.0422 0.0112
68 3 weeks Mean 4.54 91.7 98.1 4.54 4.19
Post Tx SD 5.32 39.0 34.7 1.76 1.67
Pre-Treatment Vs 4 Months Post Treatment
73 Prior to Mean 4.21 80.5 88.1 5.26 5.71
treatment SD 3.73 37.4 36.8 3.53 7.91
Student's t test - p = 0.0112 0.0305 0.0235 0.0363 0.0423
73 4 mos Post Mean 5.48 91.0 99.0 4.51 4.12
Treatment SD 3.52 34.9 34.90 1.48 1.35

Red = significant (p < 0.05), T = Trending towards significance (p < 0.10), ns = not significant, SD = Standard Deviation, Tx = Treatment, mm = Millimeters, msec = milliseconds

Figure 7
Figure 7.A graphic depiction of the symptom reductions and the right-side chewing changes that occurred as treatment progressed.

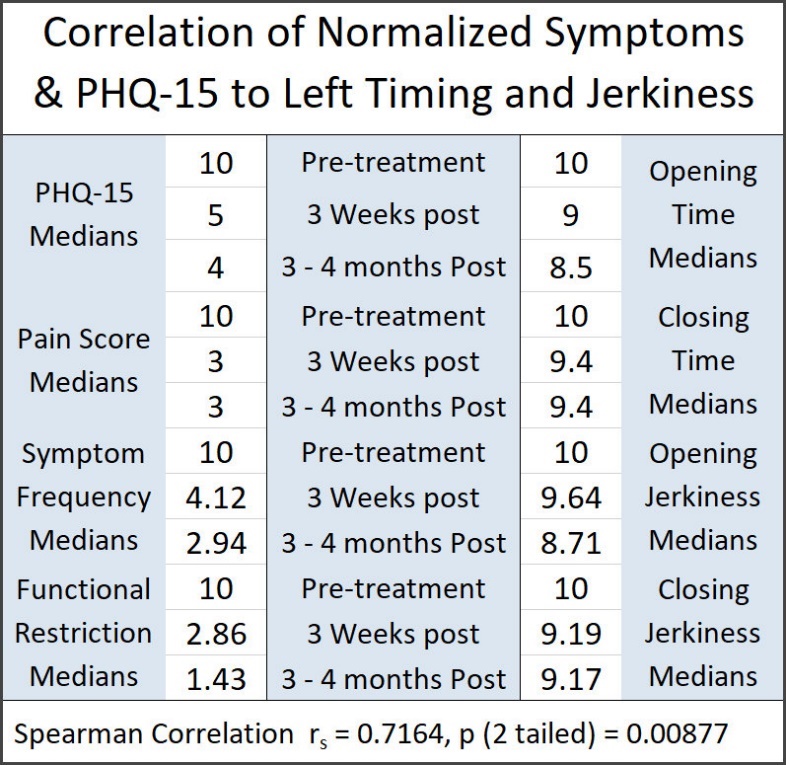
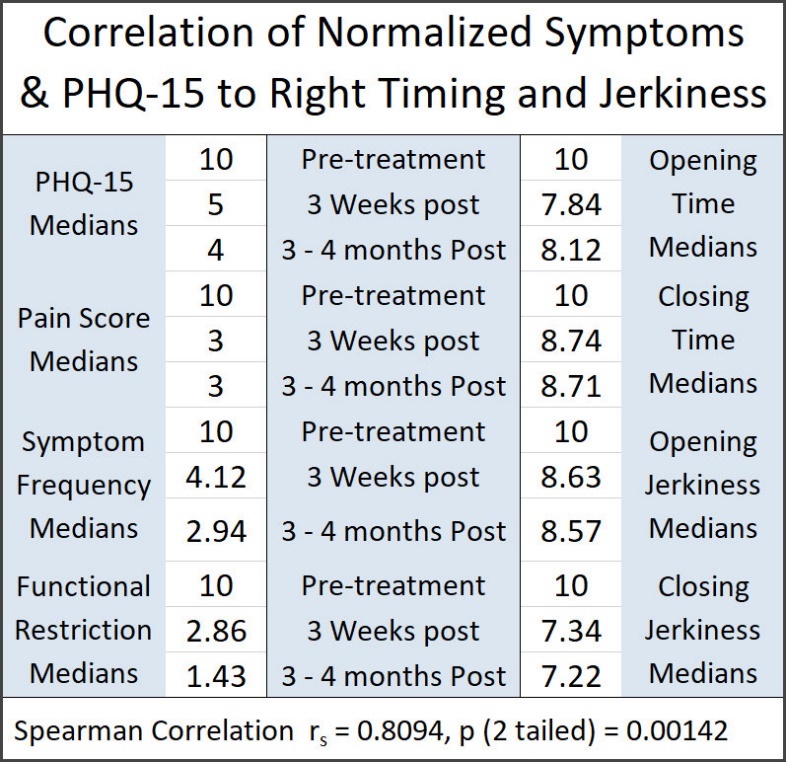
Correlations were found using the Spearman correlation coefficient as a suitable non-parametric statistic. Figure 8.

Figure 8
Figure 8.Correlation between symptoms and PHQ-15 median scores Vs left-side chewing values of timing and jerkiness.

A significant strong correlation (0.767 – p = 0.0159) was found between the progression of the symptoms and the progression of the changes in the A/P Turning Point, the opening Jerkiness and the closing Jerkiness for left-side chewing. The A/P Turning Point progression was reversed because it was determined to be inversely proportional rather than directly proportional like the jerkiness. A very similar correlation was also found between the symptoms and the right-side chewing parameters of reverse A/P and jerkiness (rs = 0.728, p = 0.02615). See Figure 9.

Figure 9
Figure 9.A correlation between the symptoms and right-side chewing values of reverse A/P and jerkiness.

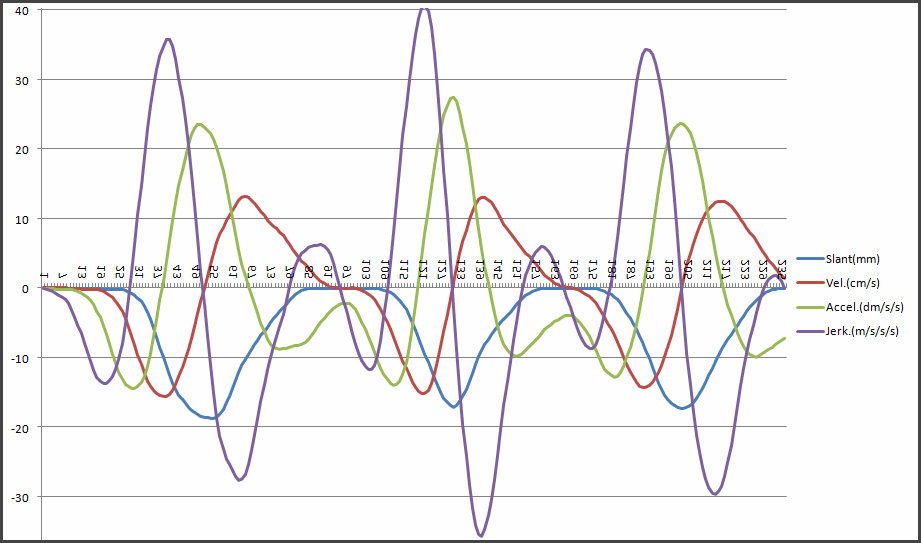
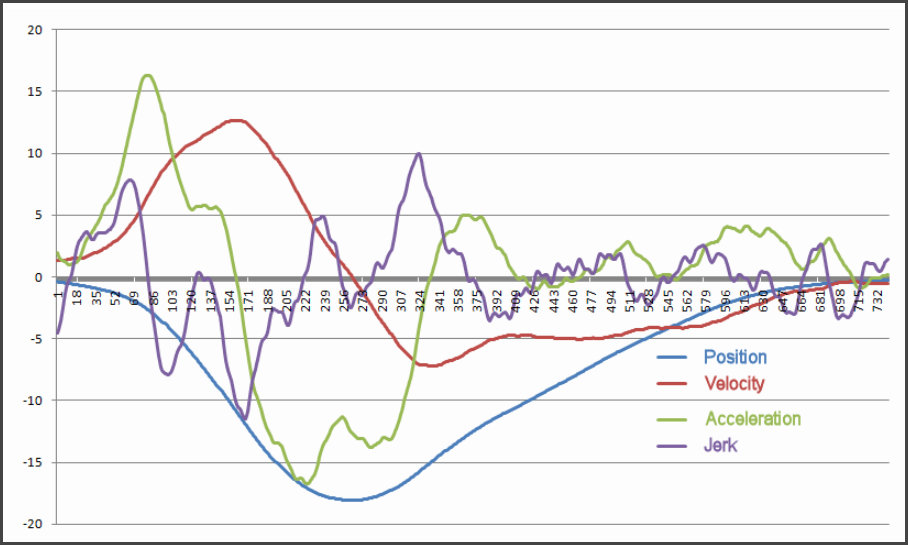
While the A/P Turning Point is a function of the opening and closing chewing pathways, the jerkiness is directly related to the smoothness of the chewing function. For additional explanation of the Turning Point and how the jerkiness is measured see the appendix.

EMG Chewing Activity

Muscle activity was recorded and evaluated during left and right-side chewing. Five parameters were calculated for each subject.

  • Mean Area under the rectified average activity

  • Coefficient of Variation (the standard deviation of the Mean Area divided by the mean)

  • Peak Amplitude of the averaged chewing burst

  • Time to Peak (from onset of the chewing cycle to the peak of the averaged activity)

  • Peak to Occlusion (peak activity to end of closure)

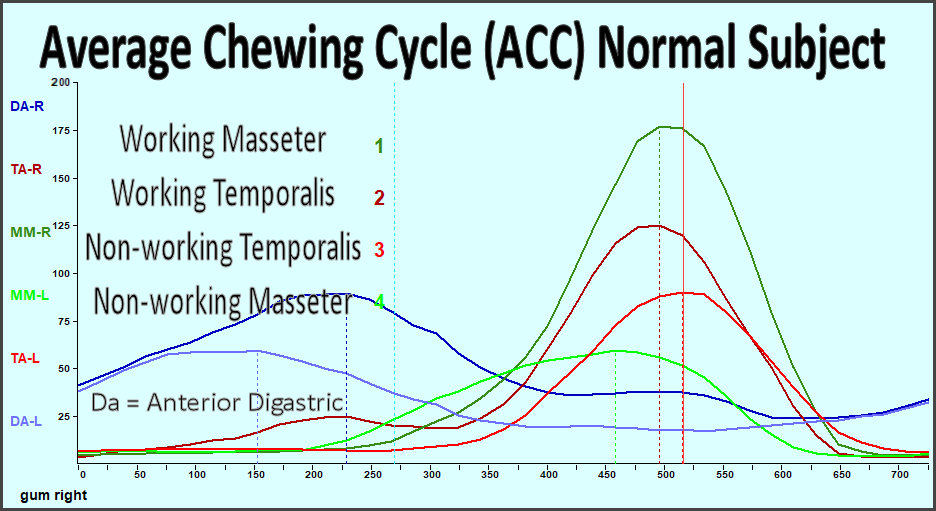
The EMG activities in Tables 10 and 11 were recorded along with the EGN movement data, which was used to segment the cycles for averaging. The averaged cycles from each subject were then used to create the group means for each muscle. The significance was calculated between pre and post treatment using Student’s Paired t test after checking all of the data for sufficient normality.

Table 10.Bilateral masseter and anterior temporalis muscle activity recorded during left-sided chewing and averaged for comparison of pre-treatment to 4 months post treatment.
n = 64 Mean Area (μVSec) CV (SD/Mean)
Left EMG Chewing 4 months post TA-R MM-R MM-L TA-L TA-R MM-R MM-L TA-L
mean 33.08 29.44 46.64 67.00 0.35 0.34 0.35 0.34
SD 47.50 34.04 56.60 89.17 0.16 0.17 0.16 0.20
Student's t test p = 0.0123 0.0073 0.0139 0.0005 0.0375 0.0398 0.1569 0.1592
Prior to Treatment ns ns
mean 18.92 17.93 29.36 27.17 0.39 0.47 0.40 0.45
SD 9.96 12.91 18.57 15.82 0.14 0.52 0.16 0.33
Peak Amplitude (μV) Time to Peak (mSec.) Peak to Occlusion (mSec.)
TA-R MM-R MM-L TA-L TA-R MM-R MM-L TA-L TA-R MM-R MM-L TA-L
98.98 83.36 142.70 166.00 541.28 518.30 529.70 508.93 75.03 71.30 68.00 77.23
78.15 68.02 102.19 126.69 161.97 175.44 154.82 164.39 102.13 86.52 68.63 79.12
0.0163 0.0395 0.0450 0.0027 0.0850 0.0287 0.0216 0.0066 0.0810 0.0051 0.0017 0.0012
T T
76.25 65.36 117.83 119.45 595.23 596.04 612.15 605.03 97.51 116.59 119.69 128.13
49.81 53.55 76.59 76.29 328.32 327.05 329.34 316.25 150.14 145.70 160.11 159.90
Table 11.Bilateral masseter and anterior temporalis muscle activity recorded during right-sided chewing averaged for comparison of pre-treatment to 4 months post treatment.
n = 64 Mean Area (μVSec) CV (SD/Mean)
Right EMG Chewing 4 months Post TA-R MM-R MM-L TA-L TA-R MM-R MM-L TA-L
mean 39.9 51.3 31.7 38.8 0.39 0.39 0.40 0.40
SD 55.4 107.0 61.2 72.6 0.20 0.20 0.19 0.21
Student's t test p = 0.0802 0.102 0.0666 0.0404 0.262 0.3056 0.3936 0.4032
Prior to Treatment T T ns ns ns ns
mean 29.7 33.8 20.4 22.8 0.41 0.41 0.41 0.41
SD 18.7 25.8 14.0 15.6 0.17 0.17 0.17 0.16
Peak Amplitude (μV) Time to Peak (mSec.) Peak to Occlusion (mSec.)
TA-R MM-R MM-L TA-L TA-R MM-R MM-L TA-L TA-R MM-R MM-L TA-L
128.3 146.4 85.9 118.5 491.8 498.2 488.8 506.8 72.3 56.1 44.4 58.9
99.6 120.7 74.6 153.9 163.7 165.7 172.6 163.2 84.9 67.3 62.6 106.4
0.0977 0.0935 0.0277 0.0325 0.0179 0.0086 0.032 0.0296 0.0022 0.0005 0.1824 0.0082
T T ns
112.8 125.5 70.4 82.7 543.3 554.5 533.7 559.6 32.4 17.2 35.1 12.0
74.6 84.9 46.8 56.3 186.6 176.2 186.4 185.9 78.5 68.8 76.4 78.9

mVSec = microvoltseconds, Sec. = second, SD = Standard Deviation, mSec. = milliseconds, Red = significant (p < 0.05), Green T = trend towards significance (p < 0.10), ns = not significant (p > 0.10)

Discussion

One important stand out general finding of this study in agreement with previous work was that both the physical and emotional responses to treatment in this group required several months’ time to achieve the maximum effects.31,36–38 This was seen for the PHQ-15 scores, the reported symptoms, the chewing motions and the muscle activity, even for those patients that experienced an initial rapid reduction in symptoms.

Spearman’s Correlation Coefficient is non-parametric and appropriate for survey data because it does not require the assumptions of the Pearson correlation. Its formula is:

p=16nk=0d2 n(n2 1)

p = Spearman’s rank correlation coefficient

di = difference between the two ranks of each observation

n = number of observations

EGN Chewing Motions

Spearman’s Correlation Coefficient was calculated for the relationship between the Pain scores, the Frequency of Symptoms scores, the Functional Restrictions scores and the PHQ-15 scores Vs the EGN Opening and Closing Times, the Opening Jerkiness and the Closing Jerkiness. See Figures 8 & 9.

rs = 0.7164 for the left chewing, 0.8094 for right chewing

These were relatively strong correlations.

The mean and median PHQ-15 scores of the group were reduced significantly as treatment was provided and they continued to significantly reduce four months later at the follow-up appointments along with the changes in the EMG and EGN parameters. From the graphs in Figures 6 & 7 it appears that neither the PHQ-15 scores nor some of the EGN parameters have reached their absolute minimums at four months after the onset of treatment for all subjects. Additional time may be needed for some in this group to achieve maximum medical improvement.

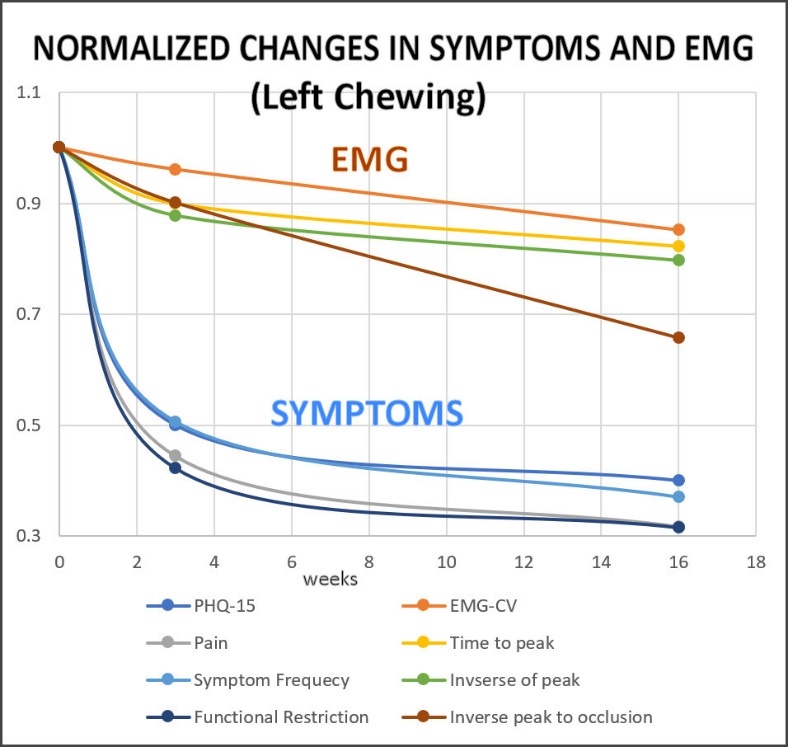
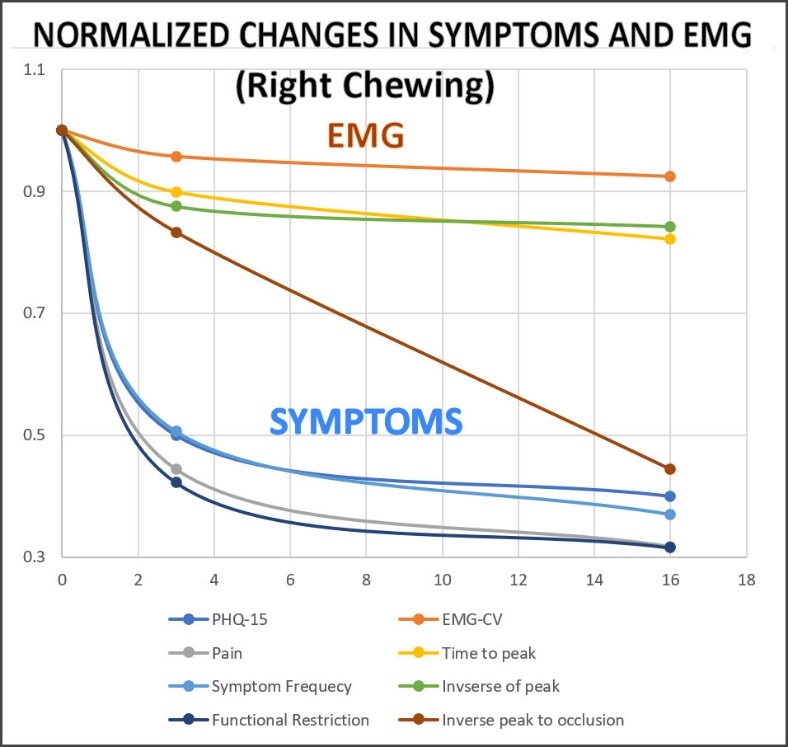
To graph five of the EMG parameters together, the post treatment values were normalized to pre-treatment values of 1.0. These graphs show the changes as either increasing or decreasing over time. See Figures 10 & 11.

Figure 10
Figure 10.Normalized left-sided EMG activity parameters of the 4 muscles combined.
Figure 11
Figure 11.Normalized right-sided EMG activity parameters of the 4 muscles combined.

EMG Chewing Activity

Note in Table 10 that the Mean Area (the total of the left side EMG activity) and the Mean Peak Amplitude were increased substantially in both over the 4-month interval. This suggests an increase in the forcefulness of mastication. Simultaneously, the timing durations and the variability were reduced (faster mastication with more consistent muscle activity). In this group the mean time from Peak EMG to the End of Closure (Occlusion) was not negative pre-treatment, but for very dysfunctional TMD patients it often is, indicating a hesitancy to close forcefully into occlusion.

The right-sided mastication produced similar changes in the EMG activity during mastication. See Table 11. The one difference between left and right mastication was that the time from the Mean Peak of the EMG Activity to Occlusion increased during right-sided chewing. This difference was due to an earlier peaking of the muscle activity. The increase in right-sided chewing rate can be seen in Table 8 as the cycle time was reduced from a pre-treatment mean of 895 milliseconds to a post treatment mean of 808 milliseconds, which is closer to a mean normal value. The increase in the time from the Peak to the Occlusion from a pre-treatment value of 32.4 milliseconds to a post treatment value of 72.3 milliseconds replicates a more normal value and indicates greater confidence in chewing, whereas the 32.4 milliseconds value was abnormally small. See the appendix for normal values.

A significant change was recorded in the mean position of the antero-posterior Turning Point. This is the most open point in space where the end of opening transitions into the beginning of closure. The mean amount of the change was greater with right-side chewing than with left side chewing, which suggests the right-sided function may have been more restricted pre-treatment. In the patients treated occlusally it is possible that their muscle action was freer after removal of the occlusal restrictions. In those patients with joint involvement, the gradual healing of those TMJ structures may have ultimately allowed freer motion post treatment.

TMD and Orofacial pains that are associated with occluso-muscular TMD symptoms have previously been shown to be significantly reduced up to five years and longer after ICAGD treatment.72,73 Some reduction in symptomology can occur instantaneously, but to reach maximum medical improvement (MMI) requires some extended time-period for full recovery. Treatment by appliance also usually requires six to twelve months to achieve complete MMI.74

This time is required for healing and tissue adaptation, especially in avascular tissues as in those parts of the TMJ with slow metabolite infusion.75 A period of up to six months or more to successfully reduce painful symptoms in TMJ involved (arthrogenous) cases has been commonly observed. This suggests that attempting to diagnose SSD within TMD patients prior to the completion of physical treatment and recovery could produce a false positive SSD diagnosis. Pain is purely subjective, and the etiology can only be determined if the pain can be relieved by some controlled means. Removing the pain pharmacologically does not reveal the etiology but masks it. Based upon the results of this investigation we reject our null hypothesis of no correlation between the PHQ-15 scores or any of the symptom median scores in relation to the masticatory motion and muscle activity parameters.

The Symptom Frequency scores improved significantly after treatment and continued to improve significantly even up to the follow-up appointment three to four months later. This supports the concept that the group responded to all the treatments by reducing the frequency of their symptoms significantly, but symptom reduction is not instantaneous. Three to four months of physical treatments and gradual recovery were required before the symptom frequencies subsided, which is a common finding in many TMD treatment studies.76,77

The goal of evaluating functional restrictions is to reveal whether the subject is experiencing difficulty chewing, swallowing, has excessive tooth sensitivity or has been avoiding any tough foods. Although the term functional restriction is often applied just to a limited range of motion, it would be a more appropriate indicator if applied to masticatory capacity. When capacity is only based upon the subjective reporting from the patient, it is a weaker measure than when an objective method is used.78 Masticatory function as reported here is an objective measurement of the degree of normality. Although one does not need to function exactly as the mean normal parameters, they do represent reasonable targets for the purpose of assessing improvement.

Comparing one obvious difference between the 2 methods of treatment, the ICAGD is focused on the occlusion, specifically occlusal interferences to masticatory function. The orthotic approach is usually focused on arthrogenous conditions and the correction of a existing maxillo-mandibular mal-relationship, whether due to TMJ internal derangements, any developmental abnormality such as crossbite, orofacial trauma or simply missing molars. The occlusion is more readily corrected by ICAGD when no serious TMJ condition is present but can sometimes also improve an arthrogenous TMD patient’s condition enough to reduce symptoms to a tolerable level. There does not appear to be a downside to ICAGD when it is done carefully and with expertise.

Since muscular symptoms can also result from a maxillo-mandibular mal-relationship, an orthotic can often reduce muscular symptoms as well, especially if existing internal derangements are well adapted. However, the success of an orthotic may need to be maintained with some form of permanent correction (prosthodontic or orthodontic) if a gradual “weaning” of the patient from the appliance does not suffice. Under some economic circumstances a durable “permanent” orthotic appliance may alternatively be prescribed.

The PHQ-15 median score of this group of TMD subjects dropped from 10 (medium SSD) pre-treatment to 4 (within normal limits) after physical treatments. Within this group 46 had pre-treatment PHQ-15 scores > 10. A premature attempt to establish an SSD diagnosis using PHQ-15 would have misclassified 58 % of the group as medium level or higher SSD. At the three to four months timepoint 15 % of the group had a PHQ-15 score > 10 (median score 11). The fact that even these resistant cases had significantly reduced their scores from a median of 20 to a median of 11 (p = 0.0116) suggests that they had physical TMD etiologies that responded positively to their physical treatments. Their mastication parameters improved in parallel with the changes in symptoms, with the changes in the PHQ-15 scores and were highly correlated. See Figures 7 and 8.

While it is plausible that the more resistant patients may also have some emotional aspect to their TMD, more time would be needed to establish that within this group. At 6 months or even at 12 months their scores may also fall to within normal limits. Those with PHQ-15 scores that remained above normal at 3 – 4 months also still had painful symptom scores and perhaps additional etiologies.

Limitations

While the ICAGD treatments are standardized and have been successfully reported from different practitioners in previous studies,35,37–39 the other four practices providing orthotic-based treatments were quite diverse and the patient populations included TMJ internal derangements that were more complicated to treat. Since this study focused on treatment outcomes with the subjects only being compared to themselves, no control or placebo group was included. This was also the design because it can be very difficult to maintain active placebo treatments for several months for TMD subjects that are in pain.

Conclusions

The pre-treatment PHQ-15 median score of the group was significantly reduced after physical treatments. Thus, it could have been considered a false positive indication of SSD prior to any physical treatment. Also, the PHQ-15 scores continued to significantly reduce at 3 – 4 months, even well after the end of physical treatment. Correlations were found between the significant improvements in the left and right-sided masticatory timing, motion and muscle function with respect to the PHQ-15 scores. This result supports primarily a physical rather than an emotional etiology for this group’s TMDs. Consequently, the null hypothesis was rejected.

Clinical Significance

The data in this report supports the theory that the diversity of TMD symptoms can best be explained as predominantly due to physical conditions and only rarely can they be attributed purely to psychosocial etiology. Along with reductions in symptomology and an improved emotional status, this measured mastication data study suggests that corrective physical treatments can also be effective at improving masticatory function, even in moderately affected cases. Oral diseases and disorders routinely have physical etiologies that need treatment prior to testing for somatization, which is the standard of care approach recommended by Psychiatry.79


Declaration of conflicts statement

John Radke is the Chairman of the Board of BioResearch Associates, Inc. No other author reported any potential conflict of interest.

Funding Statement

No funding of any kind was received in support of this research activity.

Accepted: October 29, 2021 CDT

References

1.
Okeson J. Orofacial Pain: Guidelines for Assessment, Classification and Management. 2nd ed. Quintessence; 1996.
Google Scholar
2.
Bertram S, Rudish A, Innerhofer K, Pumpel E, Grubwieser G, Emshoff R. Diagnosing TMJ internal derangement and osteoarthritis with magnetic resonance imaging. J Am Dent Assoc. 2001;132(6):753-761. doi:10.14219/jada.archive.2001.0272
Google Scholar
3.
Piper M. Temporomandibular Joint Imaging. In: Handbook of Research on Clinical Applications of Computerized Occlusal Analysis in Dental Medicine. Vol 2. 2nd ed. IGI Global; 2020:582-697. doi:10.4018/978-1-5225-9254-9.ch009
Google Scholar
4.
Cortés D, Exss E, Marholz C, Millas R, Moncada G. Association between disk position and degenerative bone changes of the temporo-mandibular joints: an imaging study in subjects with TMD. Cranio. 2011;29(2):117-126. doi:10.1179/crn.2011.020
Google Scholar
5.
Nguyen MS, Jagomägi T, Nguyen T, Saag M, Voog-Oras Ü. Occlusal Support and Temporo-mandibular Disorders Among Elderly Vietnamese. Int J Prosthodont. 2017;30(5):465-470. doi:10.11607/ijp.5216
Google Scholar
6.
Wang MQ, Xue F, He JJ, Chen JH, Chen CS, Raustia A. Missing posterior teeth and risk of temporomandibular disorders. J Dent Res. 2009;88(10):942-945. doi:10.1177/0022034509344387
Google Scholar
7.
Tallents RH, Macher DJ, Kyrkanides S, Katzberg RW, Moss ME. Prevalence of missing posterior teeth and intraarticular temporomandibular disorders. J Prosthet Dent. 2002;87(1):45-50. doi:10.1067/mpr.2002.121487
Google Scholar
8.
Xie Q, Li X, Xu X. The difficult relationship between occlusal interferences and temporo-mandibular disorder - insights from animal and human experimental studies. J Oral Rehabil. 2013;40(4):279-295. doi:10.1111/joor.12034
Google Scholar
9.
Chiappe G, Fantoni F, Landi N, Biondi K, Bosco M. Clinical value of 12 occlusal features for the prediction of disc displacement with reduction (RDC/TMD Axis I group IIa). J Oral Rehabil. 2009;36(5):322-329. doi:10.1111/j.1365-2842.2009.01942.x
Google Scholar
10.
Le Bell Y, Niemi PM, Jämsä T, Kylmälä M, Alanen P. Subjective reactions to intervention with artificial interferences in subjects with and without a history of temporomandibular disorders. Acta Odontol Scand. 2006;64(1):59-63. doi:10.1080/00016350500419867
Google Scholar
11.
Jussila P, Krooks L, Näpänkangas R, et al. The role of occlusion in temporomandibular disorders (TMD) in the Northern Finland Birth Cohort (NFBC) 1966. Cranio. 2019;37(4):231-237. doi:10.1080/08869634.2017.1414347
Google Scholar
12.
Seligman DA, Pullinger AG. The role of functional occlusal relationships in temporomandibular disorders: a review. J Craniomandib Disord. 1991;5(4):265-279.
Google Scholar
13.
Cioffi I, Farella M, Festa P, Martina R, Palla S, Michelotti A. Short-Term Sensorimotor Effects of Experimental Occlusal Interferences on the Wake-Time Masseter Muscle Activity of Females with Masticatory Muscle Pain. J Oral Facial Pain Headache. 2015;29(4):331-339. doi:10.11607/ofph.1478
Google Scholar
14.
Henrikson T, Ekberg EC, Nilner M. Symptoms and signs of temporomandibular disorders in girls with normal occlusion and Class II malocclusion. Acta Odontol Scand. 1997;55(4):229-235. doi:10.3109/00016359709115422
Google Scholar
15.
Schellhas KP, Pollei SR, Wilkes CH. Pediatric internal derangements of the temporomandibular joint: effect on facial development. Am J Orthod Dentofacial Orthop. 1993;104(1):51-59. doi:10.1016/0889-5406(93)70027-l
Google Scholar
16.
Maglione HO, Zavaleta LA, Laraudo J, Falisi G, Fernandez F. Temporomandibular dysfunction: internal derangement associated with facial and/or mandibular asymmetry. Cranio. 2013;31(4):276-282. doi:10.1179/crn.2013.31.4.005
Google Scholar
17.
Palmeiro MRL, Bronstrup MB, Durham J, Walls A, Shinkai RSA. Quality of life and mastication in denture wearers and cleft lip and palate adults. Braz Oral Res. 2018;32:e113. doi:10.1590/1807-3107bor-2018.vol32.0113
Google Scholar
18.
Diep D, Fau V, Wdowik S, Bienvenu B, Bénateau H, Veyssière A. Temporomandibular disorders and Ehlers-Danlos syndrome, hypermobility type: A case-control study. Rev Stomatol Chir Maxillofac Chir Orale. 2016;117(4):228-233. doi:10.1016/j.revsto.2016.07.009
Google Scholar
19.
Nicot R, Vieira AR, Raoul G, et al. ENPP1 and ESR1 genotypes influence temporomandibular disorders development and surgical treatment response in dentofacial deformities. J Craniomaxillofac Surg. 2016;44(9):1226-1237. doi:10.1016/j.jcms.2016.07.010
Google ScholarPubMed CentralPubMed
20.
Heir GM, Fein LA. Lyme disease: considerations for dentistry. J Orofac Pain. 1996;10(1):74-86.
Google Scholar
21.
Adachi N, Matsumoto S, Tokuhisa M, Kobayashi K, Yamada T. Antibodies against mycobacterial antigens in the synovial fluid of patients with temporomandibular disorders. J Dent Res. 2000;79(10):1752-1757. doi:10.1177/00220345000790100401
Google Scholar
22.
Learreta JA, Durst AC, Barrientos EE. Structural lesions of the TMJ in relation toMycoplasma pneumoniainfections. Cranio. 2014;32(4):260-264. doi:10.1179/0886963414z.00000000033
Google Scholar
23.
Henry CH, Pitta MC, Wolford LM. Frequency of chlamydial antibodies in patients with internal derangement of the temporomandibular joint. Oral Surg Oral Med Oral Pathol Oral Radiol Endod. 2001;91(3):287-292. doi:10.1067/moe.2001.113346
Google Scholar
24.
Gutwirth SW. Psychosomatic Dentistry and Tension Control; A Physiologic Approach. CAL. 1965;27:1-3.
Google Scholar
25.
Fourcade RL. Introduction to Psychosomatic Dentistry. Chir Dent Fr. 1965;25:61-68.
Google Scholar
26.
Schleifer SJ, Marbach J, Keller SE. Psychoneuroimmunology: potential relevance to chronic orofacial pain. Anesth Prog. 1990;37(2-3):93-98.
Google Scholar
27.
Dworkin SF, Burgess JA. Orofacial pain of psychogenic origin: current concepts and classification. J Am Dent Assoc. 1987;115(4):565-571. doi:10.1016/s0002-8177(87)54009-0
Google Scholar
28.
Dworkin SF, LeResche L. Research diagnostic criteria for temporomandibular disorders: review, criteria, examinations and specifications, critique. J Craniomandib Disord. 1992;6(4):301-355.
Google Scholar
29.
Derogatis LR. SCL-90: Administration, Scoring and Procedures Manual-II for Revised Version. Clinical Psychometric Research; 1983.
Google Scholar
30.
Kocalevent RD, Hinz A, Brähler E. Standardization of a screening instrument (PHQ-15) for somatization syndromes in the general population. BMC Psychiatry. 2013;13(1):91. doi:10.1186/1471-244x-13-91
Google ScholarPubMed CentralPubMed
31.
Thumati P, Kerstein RB, Yiannios N, Radke J, Sutter B. Changes in the Beck Depression Inventory-II scores of TMD subjects after measured occlusal treatment. Adv Dent Tech. 2018;1(1):2-13.
Google Scholar
32.
Kerstein RB, Wright NR. Electromyographic and computer analyses of patients suffering from chronic myofascial pain-dysfunction syndrome: before and after treatment with immediate complete anterior guidance development. J Prosthet Dent. 1991;66(5):677-686. doi:10.1016/0022-3913(91)90453-4
Google Scholar
33.
Kerstein RB, Chapman R, Klein M. A comparison of ICAGD (immediate complete anterior guidance development) to mock ICAGD for symptom reductions in chronic myofascial pain dysfunction patients. Cranio. 1997;15(1):21-37. doi:10.1080/08869634.1997.11745990
Google Scholar
34.
Kerstein RB, Radke J. Masseter and temporalis excursive hyperactivity decreased by measured anterior guidance development. Cranio. 2012;30(4):243-254. doi:10.1179/crn.2012.038
Google Scholar
35.
Qadeer S, Özcan M, Edelhoff D, Van Pelt H. Accuracy, Reliability and Clinical Implications of Static Compared to Quantifiable Occlusal Indicators. Eur J Prosthodont Restor Dent. 2021;29(3):130-141. doi:10.1922/EJPRD_2202Qadeer12
Google Scholar
36.
Sutter B, Teragawa S, Radke J. Trigeminal Neuralgia patients treated with disclusion time reduction (DTR): A retrospective cohort study. Adv Dent Tech. 2020;2(2):90-105.
Google Scholar
37.
Thumati P, Poovani S, Bharathi B, Mounika A, Kerstein RB, Radke J. A disclusion time reduction randomized controlled adjustment trial. Adv Dent Tech. 2020;2(2):1-23.
Google Scholar
38.
Yiannios N, Coleman T, Radke J. Digitally measured anterior guidance development reduces cold-water and air-indexing hypersensitivity. Adv Dent Tech. 2019;1(2):1-15.
Google Scholar
39.
Yiannios N, Sutter B, Radke J, Kerstein RB. TMJ vibration changes following Immediate Complete Anterior Guidance Development. Adv Dent Tech. 2018;1(1):14-28.
Google Scholar
40.
Girouard P, Stark PC, Sutter BA. Treatment of temporomandibular disorders with an oral orthotic provides postural stabilization: A retrospective cohort analysis. Adv Dent Tech. 2020;3(1):63-72.
Google Scholar
41.
Weggen T, Schindler HJ, Kordass B, Hugger A. Clinical and electromyographic follow-up of myofascial pain patients treated with two types of oral splint: a randomized controlled pilot study. Int J Comput Dent. 2013;16(3):209-224.
Google Scholar
42.
Yamashita A, Kondo Y, Yamashita J. Thirty-year follow-up of a TMD case treated based on the neuromuscular concept. Cranio. 2014;32(3):224-234. doi:10.1179/0886963413z.00000000020
Google Scholar
43.
Pietropaoli D, Cooper BC, Ortu E, Monaco A, IAPNOR. A Device Improves Signs and Symptoms of TMD. Pain Res Manag. 2019;2019:5646143. doi:10.1155/2019/5646143
Google ScholarPubMed CentralPubMed
44.
Cooper BC, Kleinberg I. Establishment of a temporomandibular physiological state with neuromuscular orthosis treatment affects reduction of TMD symptoms in 313 patients. Cranio. 2008;26(2):104-117. doi:10.1179/crn.2008.015
Google Scholar
45.
Radke J, Ruiz-Velasco G. Joint Vibration Analysis bridges the gap between clinical procedures and sophisticated TMJ imaging. Adv Dent Tech. 2020;3(1):1-19.
Google Scholar
46.
Gupta B, Thumati P, Radke J. Temporomandibular joint vibrations from totally asymptomatic subjects. Cranio. 2016;34(3):169-175. doi:10.1179/2151090315y.0000000013
Google Scholar
47.
Radke JC, Kull RS. Comparison of TMJ vibration frequencies under different joint conditions. Cranio. 2015;33(3):174-182. doi:10.1179/2151090314y.0000000019
Google Scholar
48.
Sharma S, Crow HC, Kartha K, McCall WDJr, Gonzalez YM. Reliability and diagnostic validity of a joint vibration analysis device. BMC Oral Health. 2017;17(1):56. doi:10.1186/s12903-017-0346-9
Google ScholarPubMed CentralPubMed
49.
Devi J, Verma M, Gupta R. Assessment of treatment response to splint therapy and evaluation of TMJ function using joint vibration analysis in patients exhibiting TMJ disc displacement with reduction: A clinical study. Indian J Dent Res. 2017;28(1):33-43. doi:10.4103/ijdr.ijdr_154_16
Google Scholar
50.
Huang ZS, Lin XF, Li XL. Characteristics of temporomandibular joint vibrations in anterior disk displacement with reduction in adults. Cranio. 2011;29(4):276-283. doi:10.1179/crn.2011.041
Google Scholar
51.
Zhang J, Whittle T, Wang L, Murray GM. The reproducibility of temporomandibular joint vibrations over time in the human. J Oral Rehabil. 2014;41(3):206-217. doi:10.1111/joor.12141
Google Scholar
52.
Mazzetto MO, Hotta TH, Carrasco TG, Mazzetto RG. Characteristics of TMD noise analyzed by electrovibratography. Cranio. 2008;26(3):222-228. doi:10.1179/crn.2008.030
Google Scholar
53.
Honda K, Natsumi Y, Urade M. Correlation between MRI evidence of degenerative condylar surface changes, induction of articular disc displacement and pathological joint sounds in the temporomandibular joint. Gerodontology. 2008;25(4):251-257. doi:10.1111/j.1741-2358.2008.00219.x
Google Scholar
54.
Kecik D, Kocadereli I, Saatci I. Evaluation of the treatment changes of functional posterior crossbite in the mixed dentition. Am J Orthod Dentofacial Orthop. 2007;131(2):202-215. doi:10.1016/j.ajodo.2005.03.030
Google Scholar
55.
Garcia AR, Madeira MC, Paiva G, Olivieri KAN. Joint vibration analysis in patients with articular inflammation. Cranio. 2000;18(4):272-279. doi:10.1080/08869634.2000.11746141
Google Scholar
56.
Olivieri KAN, Garcia AR, Paiva G, Stevens C. Joint vibrations analysis in asymptomatic volunteers and symptomatic patients. Cranio. 1999;17(3):176-183. doi:10.1080/08869634.1999.11746092
Google Scholar
57.
Ishigaki S, Bessette RW, Maruyama T. Diagnostic accuracy of TMJ vibration analysis for internal derangement and/or degenerative joint disease. Cranio. 1994;12(4):241-246. doi:10.1080/08869634.1994.11678028
Google Scholar
58.
Ishigaki S, Bessette RW, Maruyama T. Vibration of the temporomandibular joints with normal radiographic imagings: comparison between asymptomatic volunteers and symptomatic patients. Cranio. 1993;11(2):88-94. doi:10.1080/08869634.1993.11677948
Google Scholar
59.
Christensen LV, Orloff J. Reproducibility of temporomandibular joint vibrations (electrovibratography). J Oral Rehabil. 1992;19(3):253-263. doi:10.1111/j.1365-2842.1992.tb01100.x
Google Scholar
60.
Radke JC, Kull RS, Sethi MS. Chewing movements altered in the presence of temporomandibular joint internal derangements. Cranio. 2014;32(3):187-192. doi:10.1179/0886963413z.00000000028
Google Scholar
61.
Radke JC, Kamyszek GJ, Kull RS, Velasco GR. TMJ symptoms reduce chewing amplitude and velocity, and increase variability. Cranio. 2019;37(1):12-19. doi:10.1080/08869634.2017.1365421
Google Scholar
62.
Kerstein RB, Radke J. Average chewing pattern improvements following Disclusion Time reduction. Cranio. 2017;35(3):135-151. doi:10.1080/08869634.2016.1190526
Google Scholar
63.
Andrade KM, Alfenas BFM, Campos CH, Rodrigues Garcia RCM. Mandibular movements in older people with rheumatoid arthritis. Oral Surg Oral Med Oral Pathol Oral Radiol. 2017;123(5):e153-e159. doi:10.1016/j.oooo.2017.01.014
Google Scholar
64.
Vilanova LSR, Gonçalves TMSV, Pimentel MJ, Bavia PF, Rodrigues Garcia RCM. Mastication movements and sleep quality of patients with myofascial pain: occlusal device therapy improvements. J Prosthet Dent. 2014;112(6):1330-1336. doi:10.1016/j.prosdent.2014.07.008
Google Scholar
65.
Radke JC, Ketcham R, Glassman B, Kull R. Artificial neural network learns to differentiate normal TMJs and nonreducing displaced disks after training on incisor-point chewing movements. Cranio. 2003;21(4):259-264. doi:10.1080/08869634.2003.11746260
Google Scholar
66.
Kuwahara T, Bessette RW, Maruyama T. Characteristic chewing parameters for specific types of temporomandibular joint internal derangements. Cranio. 1996;14(1):12-22. doi:10.1080/08869634.1996.11745944
Google Scholar
67.
Kuwahara T, Bessette RW, Maruyama T. Chewing pattern analysis in TMD patients with unilateral and bilateral internal derangement. Cranio. 1995;13(3):167-172. doi:10.1080/08869634.1995.11678063
Google Scholar
68.
Kuwahara T, Bessette RW, Maruyama T. Chewing pattern analysis in TMD patients with and without internal derangement: Part I. Cranio. 1995;13(1):8-14. doi:10.1080/08869634.1995.11678035
Google Scholar
69.
Sfondrini G, Schiavi A, Mandurino M, de Rysky C. Electromyographic and electrognathographic analysis of patients with juvenile rheumatoid arthritis. Mondo Ortod. 1991;16(5):535-555.
Google Scholar
70.
Radke J, Ruiz-Velasco G, Kadamati P. Measuring the jerkiness of gum chewing: Verified TMJ internal derangement patients Vs control Subjects. AdvDent Tech. 2020;2(2):77-84.
Google Scholar
71.
Ayinala M, Poovani S, Thumati P, Shetty G, Radke J. Mastication analysis of patients with mandibular Kennedy’s Class I situation with or without modifications, before & after treatment partial denture insertion; an in vivo study. Adv Dent Tech. 2020;3(1):73-86.
Google Scholar
72.
Thumati P, Poovani S, Ayinala M. A retrospective five-year survey on the treatment outcome of disclusion time reduction (DTR) therapy in treating temporomandibular dysfunction patients. Cranio. Published online February 9, 2021:1-7. doi:10.1080/08869634.2021.1887609
Google Scholar
73.
Kerstein RB. Treatment of myofascial pain dysfunction syndrome with occlusal therapy to reduce lengthy disclusion time--a recall evaluation. Cranio. 1995;13(2):105-115. doi:10.1080/08869634.1995.11678053
Google Scholar
74.
Nilsson H, Vallon D, Ekberg EC. Long-term efficacy of resilient appliance therapy in TMD pain patients: a randomised, controlled trial. J Oral Rehabil. 2011;38(10):713-721. doi:10.1111/j.1365-2842.2011.02210.x
Google Scholar
75.
Ekberg E, Vallon D, Nilner M. Treatment outcome of headache after occlusal appliance therapy in a randomised controlled trial among patients with temporomandibular disorders of mainly arthrogenous origin. Swed Dent J. 2002;26(3):115-124.
Google Scholar
76.
Costa YM, Porporatti AL, Stuginski-Barbosa J, Bonjardim LR, Speciali JG, Rodrigues Conti PC. Headache Attributed to Masticatory Myofascial Pain: Clinical Features and Management Outcomes. J Oral Facial Pain Headache. 2015;29(4):323-330. doi:10.11607/ofph.1394
Google Scholar
77.
Wahlund K, List T, Larsson B. Treatment of temporomandibular disorders among adolescents: a comparison between occlusal appliance, relaxation training, and brief information. Acta Odontol Scand. 2003;61(4):203-211. doi:10.1080/00016350310003891
Google Scholar
78.
Ahn HJ, Lee YS, Jeong SH, Kang SM, Byun YS, Kim BI. Objective and subjective assessment of masticatory function for patients with temporomandibular disorder in Korea. J Oral Rehabil. 2011;38(7):475-481. doi:10.1111/j.1365-2842.2010.02179.x
Google Scholar
79.
Enck P, Mazurak N. The “Biology-First” Hypothesis: Functional disorders may begin and end with biology—A scoping review. Neurogastroenterol Motil. 2018;30(10):e13394. doi:10.1111/nmo.13394
Google Scholar

Appendix (supplement)

Figure 1A
Figure 1A.Normal Average Chewing Pattern (ACP) shows the cycle shape and the Turning Point at the most open position.

Note: This patient’s ACP very closely matches the mean normal pattern (black lines) from a large group of normal subjects recorded without any TMD symptoms and with Class I skeletal relationships. An exact overlap is not important, but the shape of the pattern is. The ACP is usually calculated from 15 cycles (2 – 16 in this case) and any cycles including a swallow are intentionally omitted. The first cycle in a chewing sequence is often unusual due to excessive bolus manipulations.

The masticatory movements can be analyzed by calculating a number of parameters. See Figure 2A.

Figure 2A
Figure 2A.The timing and position parameters that are associated with EGN in a Class I control subject example. Mean normal cycle time is 750 milliseconds, with Opening Time > Closing Time > Occlusal Time. Terminal Chewing Position falls between 0.0 and 0.1 mm for chewing gum. Maximum Closing velocity > Opening velocity > 100 mm/second
  1. The Opening Time, the Closing Time, Occlusion Time and overall Cycle Time can be extracted easily from the data. The opening time is normally slightly longer than the closing time, which is longer than the occlusion time.

  2. The Turning Point (TP) is the most open point at which opening changes over to closing.

  3. The Terminal Chewing Position (TCP) is very close to the Maximum Intercuspal Position (MIP) within a fraction of a millimeter, usually around 0.1 mm for all three dimensions.

  4. The Opening Velocity is normally a bit slower than the Closing Velocity (> 100 mm/second for both)

  5. The Frontal Opening Angle (45 to 90 degrees) and the Frontal closing Angle (35 to 65 degrees) are measured downwards from the plane of occlusion.

  6. The Opening Jerkiness and Closing Jerkiness for normal subjects fell between 2.0 and 3.6.

The working side masseter normally contracts hardest followed by the working side anterior temporalis at about 70 % of the masseter. The non-working temporalis contracts at about 50 % while the non-working masseter is usually limited to about 30 % of the activity of the working masseter. The Anterior Digastric muscles never really relax, but are more active prior to reaching the Turning Point than they are later in the cycle, especially on the working side. All of the muscle activities normally reach a peak before the End of Closure (Occlusion, the solid orange vertical line in Figure 3A). A delay in reaching the peak activity in closing indicates a hesitancy on the part of the subject. The mean normal cycle time is about 750 milliseconds, as is this control subject’s case. An exception must be Allowed for Class II subjects since the working temporalis replaces the working masseter as the dominant muscle producing a 2, 3, 1, 4 hierarchy instead.

Figure 3A
Figure 3A.Average Chewing Cycle (ACC) of an Angle’s Class I control subject exhibiting the normal hierarchy of muscle function during chewing: working masseter > working temporalis > balancing temporalis > balancing masseter.

How Jerkiness is measured

Jerkiness is the result of repetitive transitions from acceleration to deceleration and back to acceleration.

Figure 4A
Figure 4A.Ideal smooth chewing by control subject. The Jerk function includes just 2 peaks in opening and 2 in closing (purple line).

The Blue line is the opening and closing vertical component of motion during chewing with a pause in occlusion. The red line is the velocity, the rate of change of position, as it increases negatively during opening and positively during closing. Note that there is just one peak in the velocity occurring during opening and one peak during closing. The green line is the acceleration, the rate of change of velocity, which increases and then decreases during opening, producing two peaks. The same two peaks occur during closing. The purple line is the Jerk function, the third derivative. It represents the rate of change of acceleration. It also shows a minimum of two peaks in opening and two in closing for smooth function. Any disruption of smooth function will increase the number of peaks in the acceleration and even more so in the jerk.

A single cycle of chewing is recorded in Figure 5A. This is from a dysfunctional subject and can be seen as containing many peaks in the acceleration line (green) and even more peaks in the jerk line (purple). Although the Blue line of vertical motion looks reasonably smooth, there are a lot of changes occurring in the acceleration. Each peak in the jerk line represents a transition between acceleration and deceleration and aligns with the inflection points of the acceleration line. These inflection points can be easily detected with computer software. By counting these inflection points it is possible to get a measure of the jerkiness of the chewing motion. Thus, counting the peaks in the jerk function also represents the relative smoothness of the motion. The peaks in the jerk function are counted for the complete sequence and then the average number/cycle can be indicated. The minimum number is 2 for perfectly smooth function, but control subjects usually exhibit values between 2 and 3.5.

Figure 5A
Figure 5A.One cycle of chewing from a dysfunctional subject with a very jerky chewing motion.

For the sake of reference a set of normative values are provided here in Figure 6A. As can be seen in this table the asymptomatic control subjects chew faster, with larger motions and with less variability than TMD subjects. In general, Temporomandibular Joint Dysfunction significantly slows the chewing rate, decreases the size of the chewing pattern and increases the variability.

Figure 6A
Figure 6A.An example of an asymptomatic control group compared to a dysfunctional group chewing gum

Notes: Mastication analysis using EMG and EGN data is complicated. However, a free to download book chapter describing this mastication analysis in detail is available at https://www.advdenttech.com/for-books.