Introduction
Sleep bruxism (SB) is described as the non-functional grinding or clenching of teeth during sleep that may lead to tooth damage and induce myofascial pain, with stress being advocated as the main causal agent.1 A more recent bruxism definition referred to “both diurnal repetitive or sustained tooth contact by bracing or thrusting of the mandible, and nocturnal rhythmic or non-rhythmic masticatory muscle activities”.2,3 Self-reported bruxism has been very strongly associated with TMD symptoms.4
Most authors suggest occlusion is not a factor that induces bruxism frequency and intensity, theorizing that bruxism is generated by Central Nervous System in response to emotional factors, life stressors, or from accompanying medical conditions like Sleep Apnea.5 This Biopsycho-social model advocates that TMD symptoms and bruxism have no causative relationship from occlusion, despite that Biopsychosocial literature in actuality has very little metric-based bruxism treatment research to support that contention. Importantly, successful bruxism or TMD treatment studies showing patients physically improved from the Biopsychosocial treatment methods do not exist, but instead a reversible management approach has been advised known as “SMS therapy”, where SMS stands for Self-observation, Muscle relaxation, and Splint therapy.5–7
This non-occlusion belief system has been perpetuated from a series of Systematic Reviews,1–12 in which the authors have chosen to ignore and exclude the many T-Scan-based TMD patient treatment studies, which have reported bruxism reduced in frequency and intensity following the measured occlusal adjustment treatment known as Disclusion Time Reduction (DTR) using the Immediate Complete Anterior Guidance Development coronoplasty (ICAGD).13–22 There are multiple previously published TMD treatment research studies that employed differing biometric technologies in concert (T-Scan, Electro-myography, Jaw Tracking Electrognathography, and Joint Vibration Analysis) that have documented successful resolution of muscular TMD symptoms, markedly lessened bruxism frequency and intensity and improved the emotional well-being of subjects after the resolution of ongoing chronic pain symptoms.
Computer-guided occlusal adjustment studies have employed highly precise, measured occlusal adjustment principles that were first detected and isolated in 1991 with T-Scan I13 and have subsequently been outlined, refined, tested repeatedly, and validated repeatedly in many follow-on computer-guided occlusal adjustment studies performed up to the present day.13–22 These computer-guided occlusion adjustment studies have found repeatedly that occlusion is directly causative for many muscular TMD symptoms including bruxism frequency and intensity, because of the occlusion’s afferent neurologic extension into the Central Nervous System (CNS).23 The afferent fibers from the posterior teeth pulps and from the periodontal ligament mechanoreceptors, without synapse, directly enter into the Reticular Formation, which is the waking center of the brain that monitors and autonomically controls posture, breathing, circulation, swallowing, digestion and sexual function. These same tooth-initiated afferent fibers’ signals influence the efferent motor control over the physiology of chewing and swallowing.23 As such, the occlusion and the masticatory muscle physiology are exquisitely tied together neurologically, supporting a neuroanatomic basis for the repeated finding that occlusion’s role is primary to many TMD symptoms including bruxism,13–22 and not secondary to one’s life stressors or one’s emotional state.
To date, no DTR treatment study has focused solely on bruxism for analysis, but has instead reported on bruxism improvements as part of the collective TMD symptom improvements that followed DTR therapy. Therefore, the Objective of this pilot study was to determine if bruxism frequency and intensity changed after patients underwent Disclusion Time Reduction (DTR). This was deemed a pilot study because only treated subjects were evaluated without a comparison control group. The null hypothesis: no significant change in bruxism activity occurred after measurably changing the occlusion with computer-guided DTR.
METHOD and MATERIALS
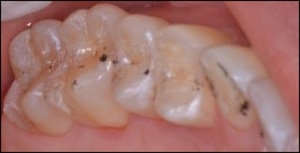
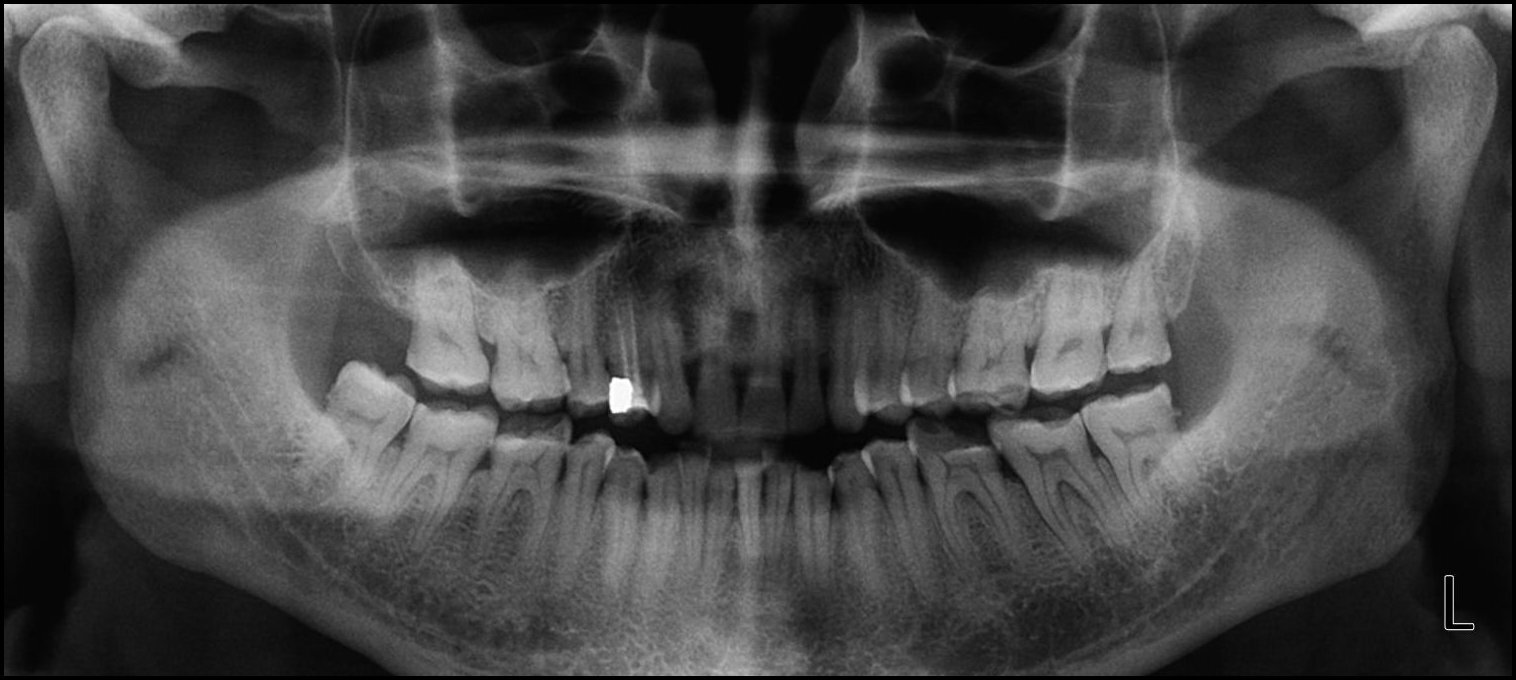
Thirty-six patients (24 F, 12 M) met the inclusion criteria from patients referred to a Prosthodontic dental office for a digital occlusion and muscle physiology evaluation, with a chief complaint of chronic bruxism. In addition to experiencing bruxing habits, many of the referred patients demonstrated chewing fatigue, chewing pain, or chewing weakness, and some experienced ongoing head, neck and facial pain, headaches around the eyes, midface and temples, and frequently noticed jaw tension, Many wore splints that were unsuccessful in arresting their bruxing frequency, but that did act to protect tooth structure from bruxing damage. All of these patients had anterior teeth that coupled or nearly coupled, presented with some worn teeth and exposed dentin, but demonstrated relatively normal occlusal relations. (Figures 1a and 1b) A further examination with Joint Vibration Analysis (JVA), radiography and patient consultation determined that these bruxing patients primarily exhibited muscular TMD symptoms, with complaints related to their tooth structure loss, but who did not present with substantial structural breakdown of their Temporomandibular Joints, discs, or condyles. (Figure 1c)
Any patients found to have serious TMJ issues or any medically diagnosed systemic conditions that could have been responsible for their symptoms, were excluded from this selected group.
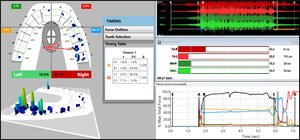
Being primary muscular TMD patients, the 36 patients were further diagnosed with the T-Scan 10/BioEMG III synchronized technologies (Tekscan, Inc. South Boston, MA, USA; Bioresearch Associates, Inc. Milwaukee, WI, USA) (Figures 2a and 2b). Each patient’s right and left excursions were recorded by closing firmly into their Maximum Intercuspal Position (MIP), holding their teeth together intercuspated for 1-3 seconds, and then commencing a right or left excursion until only anterior teeth were in contact. This specific recording method insured high quality Disclusion Time and EMG data was obtained from each bruxing patient.24
All pre-ICAGD coronoplasty Disclusion Time values and excursive electromyography levels were recorded for comparison to each individual bruxer’s post ICAGD Disclusion Time values and EMG levels detected in follow up recordings made at Day 1 post ICAGD, 1 week, 1 month and at 12 months.
The bruxing patients were fully informed they were to receive ICAGD and have their enamel adjusted and polished, guided by the T-Scan/BioEMG synchronization. They were also required to fill out a self-assessment bruxism habits questionnaire with scaled ordinal number responses (0-3) (Table 1), and a Beck Depression Inventory (BDI-II) before undergoing ICAGD, and at all recall dates after undergoing ICAGD.
Next, the ICAGD definitive occlusal adjustments were accomplished as previously described,13,14,21,25 but are only summarized here. The bruxing patient’s teeth were air dried. Patients were then asked to close into their Maximum Intercuspal Position (MIP) with articulating paper (Bausch, Arti-Fol® black 8μ, Germany) interposed between their teeth, and then to commence a right mandibular excursion out to the edges of their canine teeth, then slide back into MIP, and then make a left mandibular excursion out to the edges of the left side canine teeth, and back into MIP (Figures 3a, 3b).
The pre-treatment T-Scan/BioEMG recordings (Figures 2a and 2b) guided the clinician to the areas to adjust in the ink patterns on the occlusal surfaces as the patient moved in and out of MIP excursively. Definitive corrections were made on one side of the mouth using pear-shaped finishing burs (Mani Dia-Burs, Japan ISO no-237/021), to the excursive frictional contacts located on inclined planes and on inner/outer aspects of the molar and premolar buccal cusps (Figure 3a), leaving the central fossa, cusp tip, and the marginal ridge contact points intact (Figure 3b). These same molar and premolar excursive contacts were then eliminated on all involved surfaces on the opposite side of the mouth. In patients with excessive exposed dentin (Figure 1b), adjustments were concentrated on teeth with the most enamel, or on opposing teeth to those that were markedly worn. And when needed, some minor bonding was added to increase steepness to any shallow maxillary anterior guidance discluding surfaces.
ICAGD was considered completed when all Class I, II, and III lateral posterior excursive interferences had been visually removed, disclusion of all posterior teeth in the right and left excursions was visible, with the patient experiencing easier lateral movements than pre-ICAGD. The remaining habitual closure contacts were located on cusp tips, fossae, and marginal ridges only (Figure 3b).
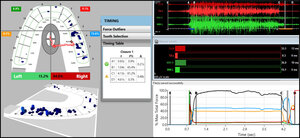
When only solid areas of contact in MIP remained and the T-Scan Center of Force trajectory rested near the T-Scan arch-half midline (indicating near equal right side-left side occlusal force arch half percentages), the habitual closure adjustments were completed, and new excursive recordings were obtained to verify the Disclusion Times had been reduced to < 0.5 seconds in each excursion. Any remaining prolonged excursive contacts were adjusted until each excursion’s Disclusion Time was less than 0.5 seconds (Figures 4a and 4b).
At all dates of recall (1 week, 1 month, and 12 months’ post ICAGD) new habitual closure into MIP and excursive T-Scan/BioEMG recordings were made, which guided further but minor, closure and excursive adjustments. A second set of T-Scan 10/BioEMG III recordings followed, that measured the final occlusal force percentage balance (High side vs. Low side), the Disclusion Times, and the EMG levels present in each excursion. Also at each recall, the bruxing patients filled out new Bruxing Habits and BDI-II questionnaires reflective of changes/no changes to their bruxing behavior and emotional well-being.
Statistics
For the subjectively reported Bruxing Habit and BDI-II data, the Paired Sign Test was selected due to the limited number of subjects in this pilot study. For the measured Disclusion Time, EMG, and sided force percentage data, the Student’s Paired t test compared the post-ICAGD measurements to the pre-ICAGD measurements.
Results
The summed group scores of the most commonly reported six signs and six symptoms of this bruxing group (20.8 +/- 1.76 years) were compared from pre-treatment to 1-day post treatment (p = 0.00408). Likewise, additional comparisons were made between 1-day and 1-week (p = 0.00078), 1-week and 1-month (p = 0.02275), and 1-month and 12-months post treatment (p = 0.00715). (Table 1) All comparison dates showed marked reductions in bruxing habit scores, indicating over time, bruxing behavior continuously lessened.
The percentages of the reductions in the pre-treatment total group scores of the six signs and six symptoms at the 12-month follow-up are displayed in Table 2. The total percentage reduction varied from a low of 69% to the maximum of 100% in four of the signs and symptoms. Although no reduction could be expected in tooth wear or facets, no increase was seen in tooth wear nor in the number of wear facets. The grand mean pre-ICAGD score of all 12 signs and symptoms was 19.6 (+/- 1.34), but declined to 3.72 (+/- 1.085) for the same 12 factors at the 12-month follow-up. Five of the twelve factors (3 symptoms and 2 signs) resolved completely to zero for all 36 subjects.
The left and right Disclusion Times were dramatically reduced at 1-day post treatment compared to the pre-treatment values (p = 0.00000) in Table 3. At one week, only the right Disclusion Time continued to significantly reduce. But at one month the left Disclusion Time caught up. The 12-month follow-up Disclusion Times were stable and remained short bilaterally.
To avoid random cancellations, the right side-to-left side force percentage reported from T-Scan were designated as the “High side” or the “Low side”, instead of right and left. The sided force percentages were tracked at each time point and compared with the Student’s paired t test. (Table 4)
The initial pre-ICAGD high side-to-low-side imbalance was significantly reduced at 1-day after treatment, showed no change at 1-week, demonstrated some regression at 1-month and 12 months, but overall measured as a significant reduction at 1-year (p = 0.00931).
The progression of EMG data shown in Table 5, illustrated that muscle activity intensity at “C” (complete occlusal intercuspation in MIP just before excursive commencement) significantly increased gradually over time. Alternatively, muscle activity intensity at “D” (measurable complete posterior disclusion bilaterally) significantly decreased over the same period of time.
The highly statistically significant reductions in the BDI-II scores (p = 0.00000) during the 12-month observation period, indicated that initially present emotional depressive symptoms were greatly relieved after ICAGD reduced the groups’ bruxing frequency and intensity. (Table 6)
Discussion
The results of this bruxism pilot study corroborate the findings of earlier ICAGD/DTR studies, where bruxism improvements were reported following ICAGD, along with other TMD symptom improvements.13–22 This pilot study tracked bruxism intensity and frequency, which began improving within one week after ICAGD was rendered and continued to improve over the 12-month period of observation. The repeated scaled self-reporting of bruxism frequency and intensity changes (Table 1) acted as its own assessment for each date of recall. Statistical treatment of the ordinal number responses (0-3) determined there was a significant patient bruxism impact after receiving Disclusion Time Reduction treatment over a 12-month time period. (Table 2)
Importantly, the results of this pilot study directly contradict the Biopsychosocial belief system that bruxism is centrally mediated rather than occlusally related. This Biopsychosocial bias to ignore the findings of prior T-Scan/BioEMG III DTR/ICAGD biometric research that corroborates this study’s findings,13–22 continues to mislead the dental profession (in many parts of the world) to believe that occlusion is not a factor in bruxism.1–12 However, in this ICAGD-treated bruxing patient pool, bruxism intensity and frequency statistically lessened within the first month after their long Disclusion Times were significantly reduced to short Disclusion Times. (Table 3) This finding suggests that a lack of posterior excursive disclusion (Disclusion Time > 0.5 seconds) when patients rub or clench their teeth together, neurologically stimulates excess masticatory muscle contractions that induce bruxism activity.
Table 4 illustrates that ICAGD statistically improved the balance of the overall occlusal force distribution, despite being primarily an excursive movement procedure focused on treating excursive frictional contacts.13,25 The secondary phase of ICAGD involves making minor closure-into-MIP adjustments, to refine and optimize the balance obtained from making all the initial excursive adjustments bilterally.25 Statistically significant improvement in the high-side to low-side force percentage towards equality was created by ICAGD at Day 1, that was maintained throughout the 12 months of observation.
Table 5 illustrates 2 key physiologic effects of ICAGD as a neurophysiologic occlusal therapy. After ICAGD the significantly increased muscle activity at the “C” suggests that the reduced left-right (High side/Low side) force percentage imbalance in MIP, increased the overall occlusal stability, and most likely increased the surface contact area the patients could occlude into. With more equally distributed forces spread over the more stabilized contacts, the patients could apply more muscle force to their contacts, more comfortably in their MIP than prior to ICAGD. As no patient instruction was given to “clench harder” as treatment progressed over the 12 months of observation, the patients became more comfortable while intercuspating more forcefully.
The opposite muscle activity response occurred at D (complete posterior disclusion bilaterally). As only a few anterior contacts made contact at D, less applied force was needed by patients to slide laterally out of MIP across their few anterior contacts. With fewer contacts present during each right and left excursion, patients required less muscular effort to accomplish their excursions post-ICAGD.
The significant reductions in the 36 patients’ BDI-II scores indicate improved emotional well-being after the ICAGD treatments. (Table 6) The pre-ICAGD BDI-II median score of 24, categorized this patient group as moderately depressed (score range = 21 – 30), resultant from living with chronic jaw pain and facial soreness that frequently accompanies ongoing clenching and bruxng.18,20–22 Within 1-week post ICAGD, the groups’ BDI II score dropped to 4, categorizing the treated bruxers as normal (score range < 10), lacking substantial depressive feelings. At 12 months, emotional depression was entirely absent from the median score of these 36 patients (12-month score = 0).
Explanation of How ICAGD Treatment Lessens Bruxism Activity
Prior to ICAGD when the patients slept or clenched during the day, the pre-treatment occlusal contours of the posterior teeth elicited high level masticatory muscle contractions, which moved the mandible across opposing occlusal surfaces that did not disclude from each other fast enough, before inducing more muscle contractions. This next set of contractions once again moved the mandible slightly, but again the opposing posterior teeth did not disclude. This induced another round of muscle contractions that again, slightly moved the mandible to where the opposing posterior occlusal surfaces again did not disclude, which again induced another round of muscle contractions that moved the opposing teeth across each other in very small distances. This cycle continues the action of clenching/grinding because the posterior teeth do not separate from each other fast enough to turn off the muscle contractions. This is the mechanism by which posterior teeth themselves cause bruxism activity, that is ongoing and self-perpetuating. Because the posterior teeth cannot rapidly separate from each other in very small distances, muscle contractions are induced that keep moving the mandible back and forth across contacting (non-discluding) opposing occlusal surfaces. And as teeth wear down, the surface area of non-discluding contact is increased.
However, after ICAGD removed the occlusal surface friction from the subject’s mandibular excursions, the posterior teeth did disclude in very small distances and very rapid time durations (< 0.5 seconds). (Table 3) Rapid disclusion limits the posterior tooth-initiated muscle contractions that occur in the movement with non-disclusion, which also interrupts the bruxism activity. (Tables 1 and 2) These physiologic changes are neurologically mediated within the Central Nervous System23 after the time-duration and volume of posterior teeth pulpal nerve fiber flexures and periodontal ligament nerve fiber compressions are both drastically reduced by ICAGD. This eliminates the posterior teeth from lateral excursive engagement, whereby the treated subjects function muscularly at or near resting state contraction levels. This short time from MIP to posterior disclusion in less than 0.5 seconds limits the bruxism activity.13–22,25 This study’s data indicated that ICAGD had a marked affect to limit the frequency and intensity of bruxism symptoms, reducing the 36 patients’ reported symptoms from 69.4% to as much as 100% after ICAGD. (Table 2)
Limitations
Although the subject group showed definitive bruxism improvements, this study’s limitations were; 1) the small number of subjects (36), 2) nocturnal bruxism was not defined using sleep studies and 3) there were no control subjects to compare the treated subjects’ outcomes against. However, the repeated use of a bruxing habits questionnaire helped to overcome the lack of controls. Each separate and repeated questionnaire acted as its own control in comparison to the pretreatment self-reported levels of bruxism frequency and intensity over the 12-month period of observation. Placebo effects are unlikely to be sustained over a 12-month period.
CONCLUSION
The results of this 36-patient pilot study support the hypothesis that long Disclusion Times and excursive posterior occlusal contacts can be an etiologic factor stimulating bruxism. ICAGD and DTR treatment positively reduced the bruxism frequency, intensity and reduced indications of depression, revealing that an occlusion-bruxism interrelationship physiologically exists. Tooth-borne trigeminal nerve inputs from contacting teeth contributed to the initiation and perpetuation of bruxism. Once removed via ICAGD, bruxism activity markedly lessened. A bruxism DTR Randomized Controlled Trial study, possibly with a sleep study component, is needed to further document occlusion’s contributory role in bruxism.
Potential conflict of interest statement
The 3rd author (RBK) is a consultant to Tekscan, Inc., but receives no monetary or other gain from the sale of product. The 4th author (JR) is the Chairman of the Board of Directors for BioResearch Associates, Inc. who receives no commissions on sales.
__with_minimal_anterior_overlap__flared_.jpeg)


__with_minimal_anterior_overlap__flared_.jpeg)


