


INTRODUCTION
Deep bite malocclusions present with decreased lower anterior facial height (LAFH), and are seen in Class I, Class II Division 1, and Class II Division 2 Angle classifications. The first and third groups are characterized by retroclined lower incisors and an increased interincisal angle.1,2 While the majority of anterior overbite malocclusions are associated with a decreased gonial angle, a decreased mandibular plane angle, and maxillary plane clockwise rotation,2 there are cases with dolichocephalic growth patterns that exhibit increased incisor overbite.3–5 The anterior (counter clockwise) rotation of the mandibular plane does not necessarily affect the development of an anterior overbite.6 Some authors have shown that anterior overbites can be related to Temporomandibular Disorders,7,8 while others were unable to find any association.9–11
T-Scan digital occlusal analysis has been used to analyze the progression of orthodontic treatment,12,13 by assessing reactive tooth movements with objective mid-treatment occlusal measurements.12,14 T-Scan occlusal analysis measures the Right side-to-Left side occlusal imbalance,15 the distribution of force in the anterior region of the dental arches,16 and the first occurring contact during the closure cycle,17 which are frequently utilized findings that evaluate progress and finishing of orthodontic treatment. T-Scan records occlusal function across time, as a patient occludes or excurses into a digital sensor that is attached to a computer via a USB cable. The T-Scan High-Definition Novus sensor (Novus HD, Tekscan Inc. S. Boston, MA USA) is a Mylar-encased, arch-shaped pressure-measuring grid-based printed electronic circuit, that fits into the patient’s mouth between occluding teeth. The large HD recording sensor contains 2200 sensel electronic force measurers and the small HD sensor contains 1500 electronic sensels. When a patient occludes upon a sensor with opposing teeth making approximating contact, the teeth compress together the upper and lower sensor surfaces, which results in a change in the electronic resistance in each of the occlusally-loaded sensels, registering up to 256 relative occlusal contact force levels. The force output data is displayed as a dynamic occlusal video in 3D and 2D ForceView windows, with a Force vs. Time graph located below on the T-Scan desktop.
The 2D ForceView can be divided into four quadrants to facilitate a more detailed force distribution analysis, with the corresponding quadrant-colored lines being displayed for analysis in the Force vs. Time graph.
This Case Report employs T-Scan data to describe and explain the changes in occlusal load distribution before, during and after orthodontic treatment of a Class II Division 2 anterior overbite patient.
CASE STUDY
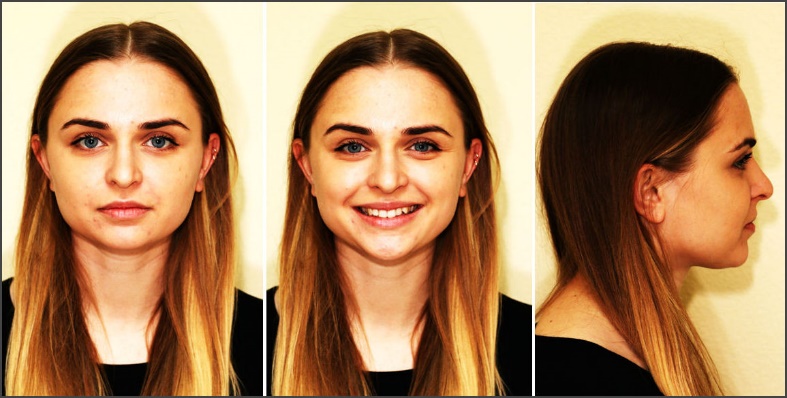
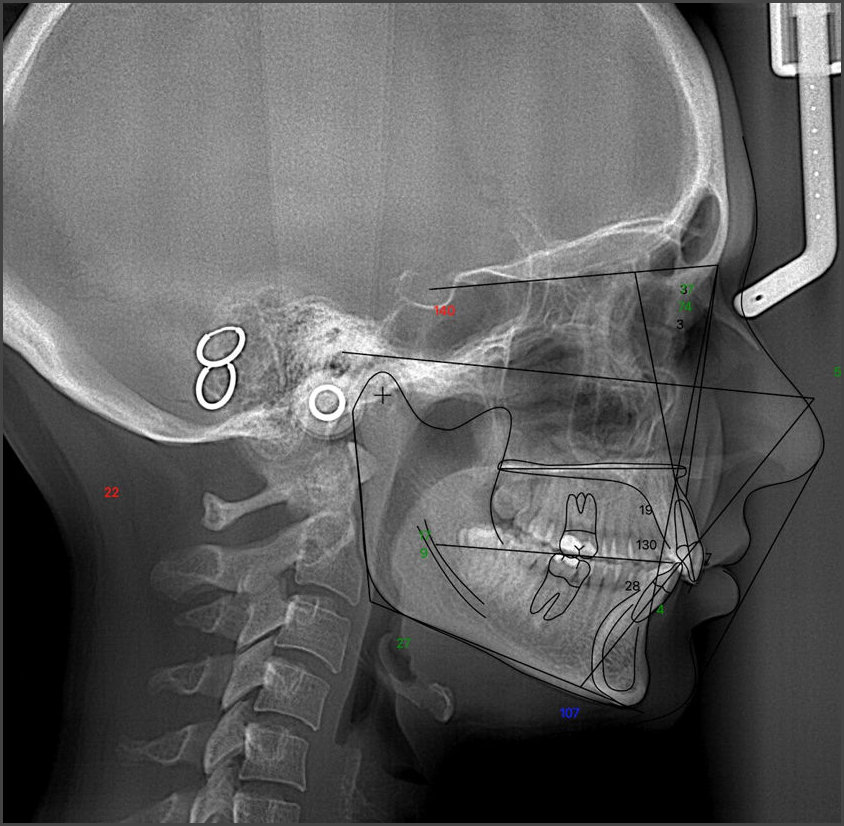
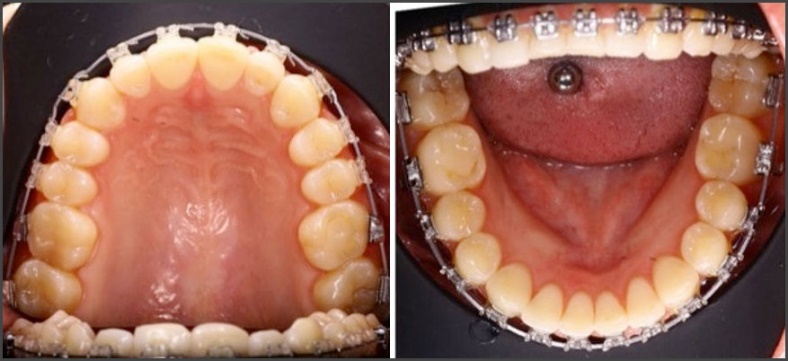
A 28-year-old female presented with requests to better align her front teeth (Figures 1a-e). The clinical and radiographic examinations revealed she was skeletal Class I and a dentoalveolar bilateral Class II, with an anterior overbite, and a brachycephalic growth pattern. She demonstrated 4 mm of overjet and 5 mm of overbite, with mild-to-moderate upper anterior crowding and mild lower anterior crowding (Table 1).


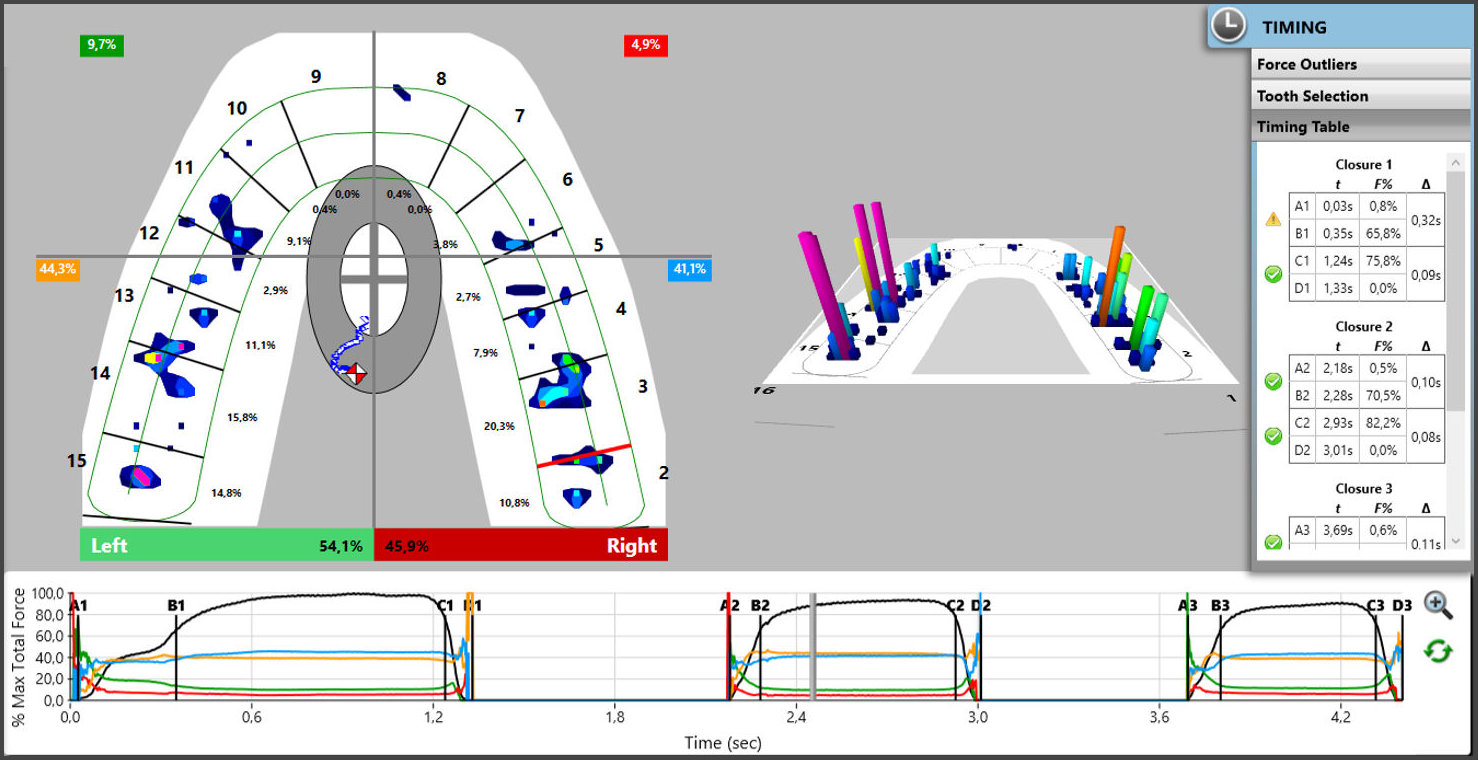
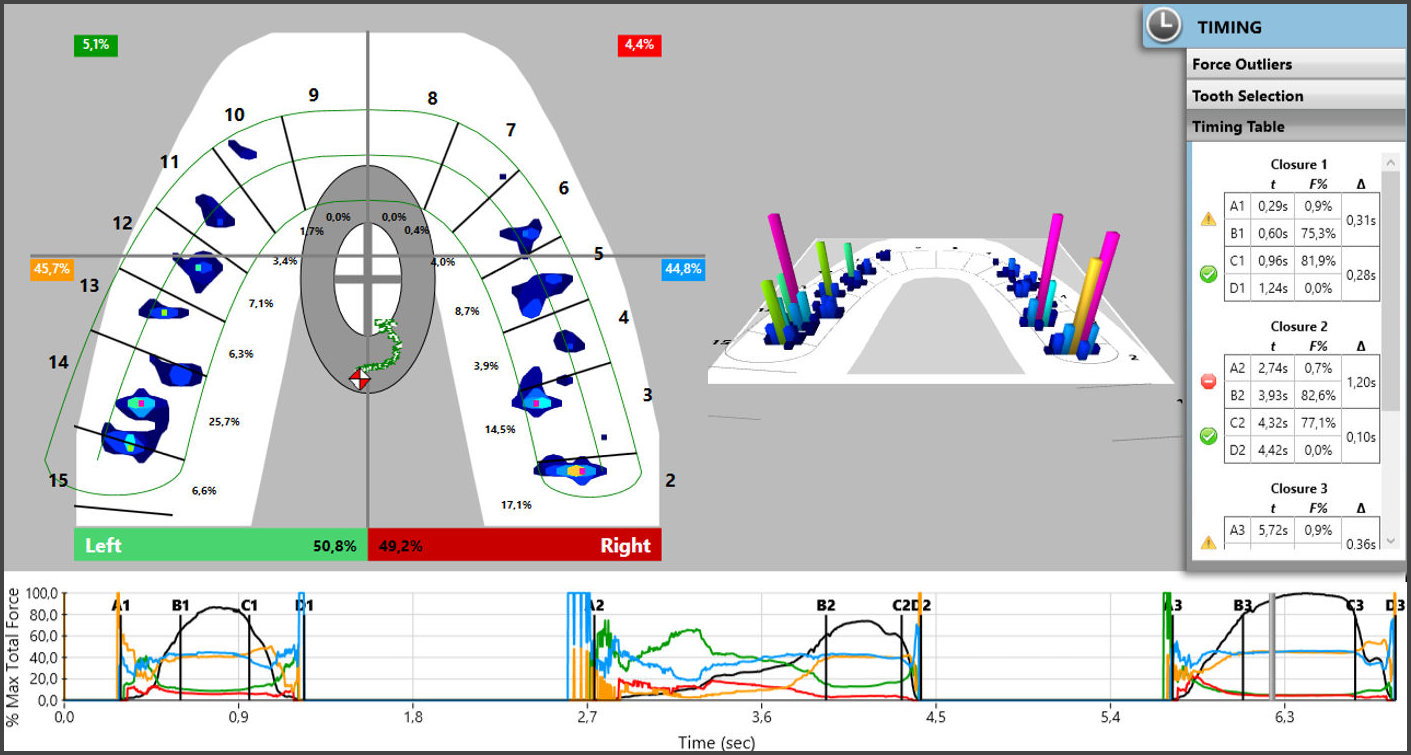
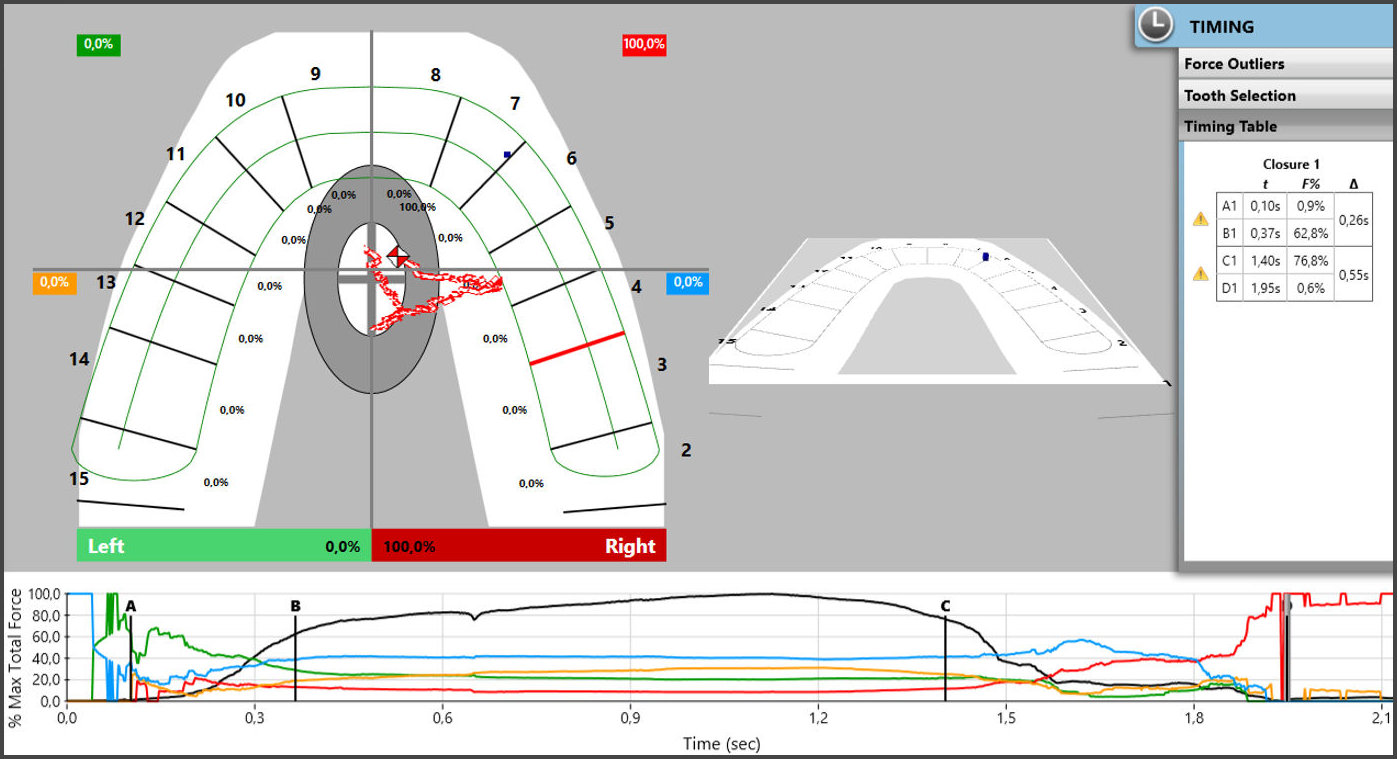
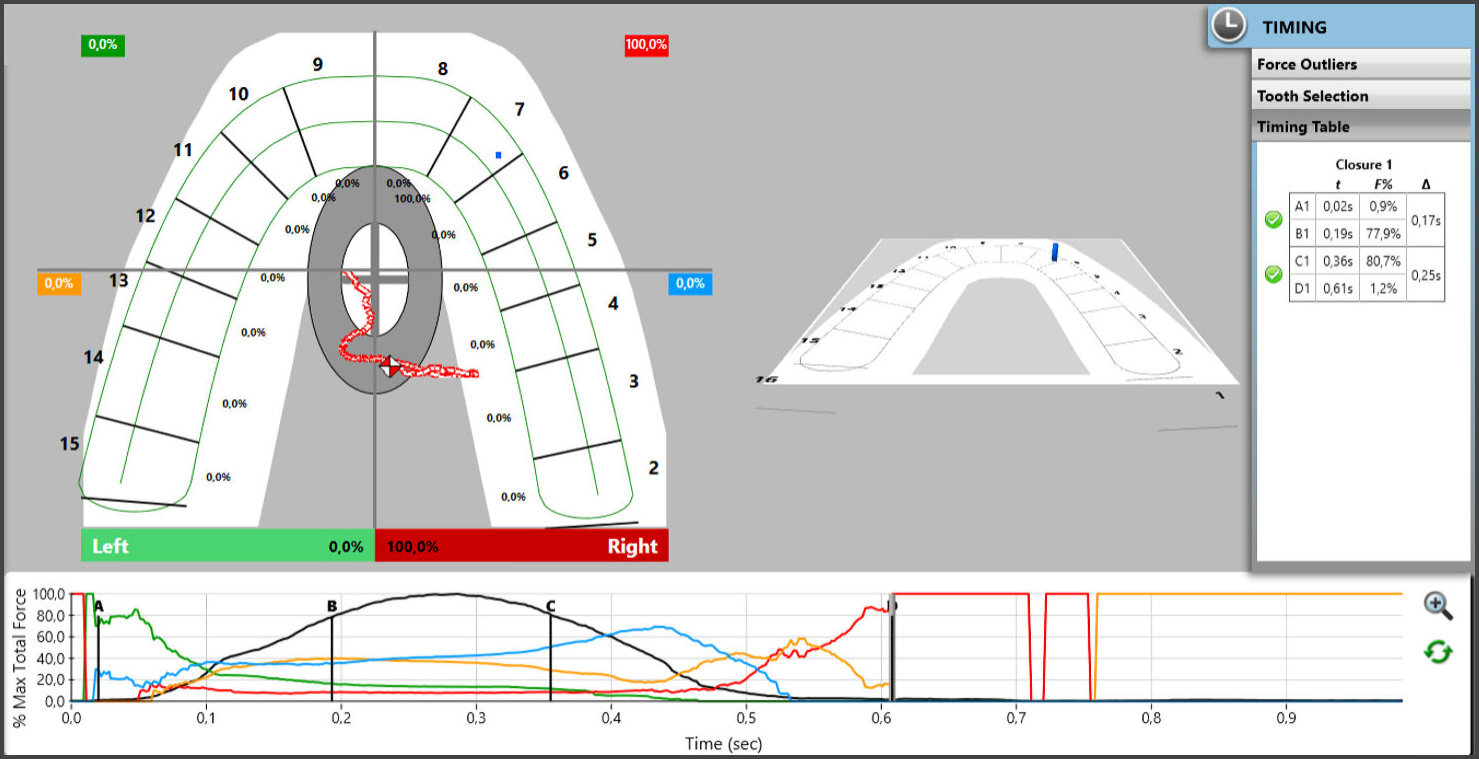
Digital occlusal measurements were recorded using T-Scan version 9 (Tekscan Inc. S. Boston, MA, USA), that assessed the Occlusion Time (OT), the Disclusion Time (DT), the Percentage of Force by quadrant (anterior right and left; posterior right and left), the Anterior/Posterior Force Ratio, and the Right side-to-Left side force percentage imbalance. The data was gathered by recording a multi-bite patient self-closure into maximum intercuspation (MIP) and a series of excursive movements (anterior, right, and left latero-trusive) (Figures 2a- 2c). The Occlusion Time (OT) is time elapsed from first contact until both arches fully intercuspate, and is visualized in the A-B time duration within the Force-Time graph (Figure 2a). The curved black line within the Force vs. Time graph represents the changing total force of all occluding teeth between both arches. The pretreatment OT values (Timing Table) of three consecutive closure movements equaled 0.32, 0.10, and 0.11 seconds respectively. The Right-side-to-Left-side imbalance was equal to 42.4 % Right 57.6 % Left. The initial quadrant force percentages equaled 6.6 % (right anterior), 16.9 % (left anterior), 35.9 % (right posterior), and 40.7 % (left posterior). The total anterior force percentage equaled 23.5%, with an Anterior-Posterior force ratio equal to 31%.


The Disclusion Time (DT) is the time elapsed from the initial excursive commencement until all posterior contacts bilaterally are discluded from all molars and premolars. The DTs of the left and right lateral excursions equaled 0.37 and 0.25 seconds, respectively (Figures 2b and 2c)
It must be noted that although this left lateral movement’s Disclusion Time was within physiologic limits (= 0.37 seconds), both working (#12) and non-working contacts (#2) were present in this excursion.
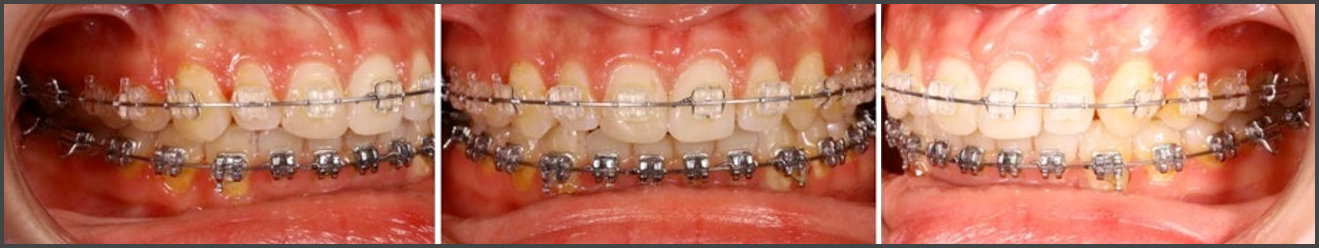
Esthetic braces (ORMCO, Brea, California, USA) were bonded to the upper teeth, and metal braces (3M Unitek, Monrovia, California, USA) were bonded onto the lower teeth using a standard bonding protocol. A Class II dentoalveolar correction was planned with upper molar de-rotation and Class II elastic use (3/16, 6 oz,, 3M Unitek, Monrovia, California, USA). Treatment progress from Class II elastic use with correction to the antero-posterior relationship can be seen in Figures 3a and 3b.


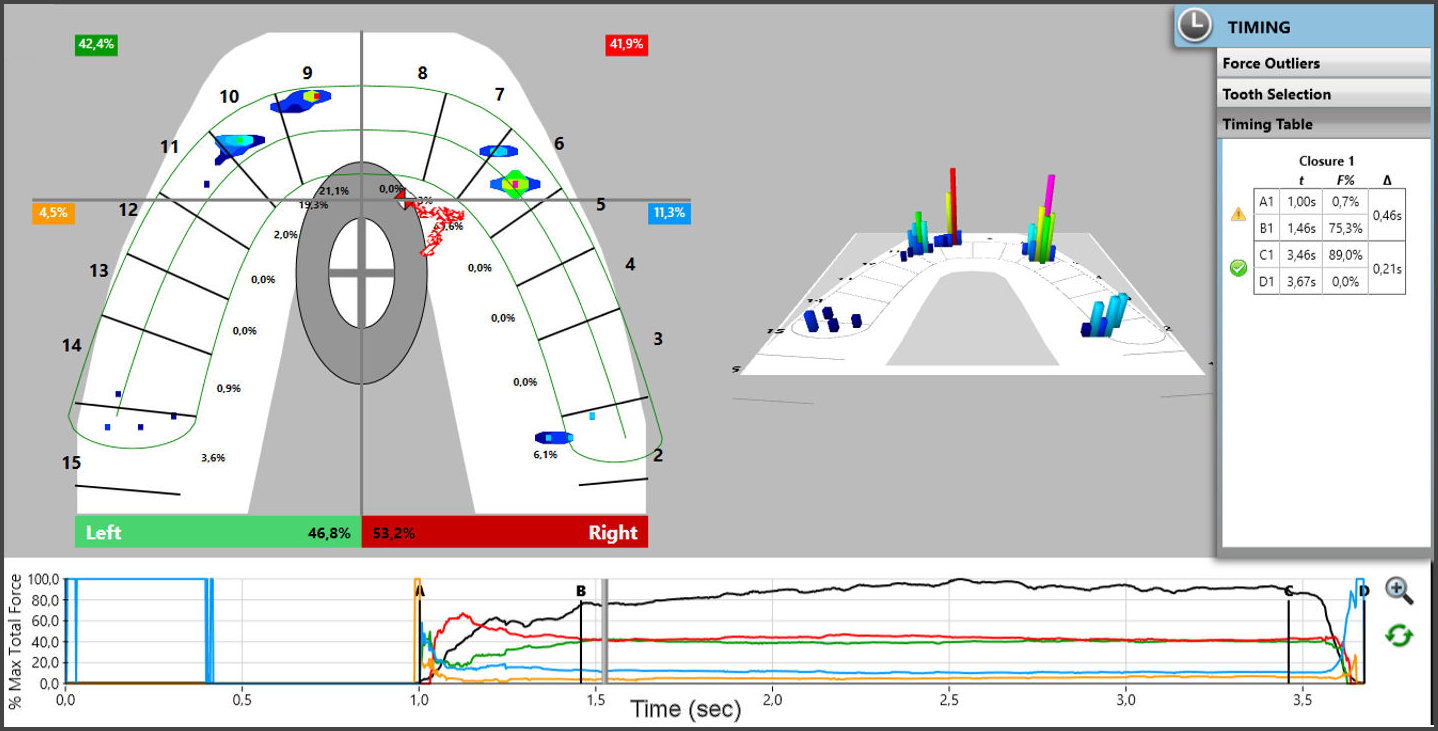
Progress with respect to the occlusal force profile can be seen in newly recorded T-Scan data (Figure 4).

The Figure 4 centric occlusion recording was made to evaluate the contact distribution within the arches, the timing of closure into MIP occlusion, the Right side-to-Left side imbalance, and the Anterior/Posterior Force ratio. The OT was prolonged measuring 0.46 seconds, indicating the patient struggled to quickly fit her teeth into MIP. The Right side-to-Left side imbalance = 53.2% right- 46.8% left, with contact forces mainly located in the anterior segments, which hosted more than 80% of total load.
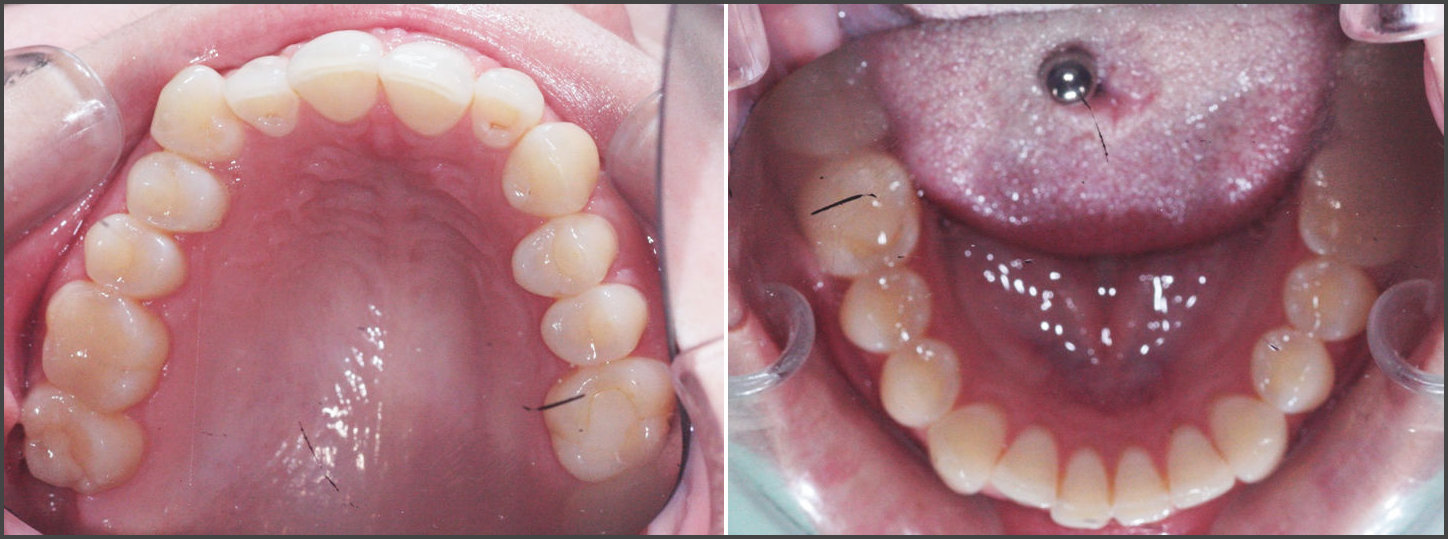
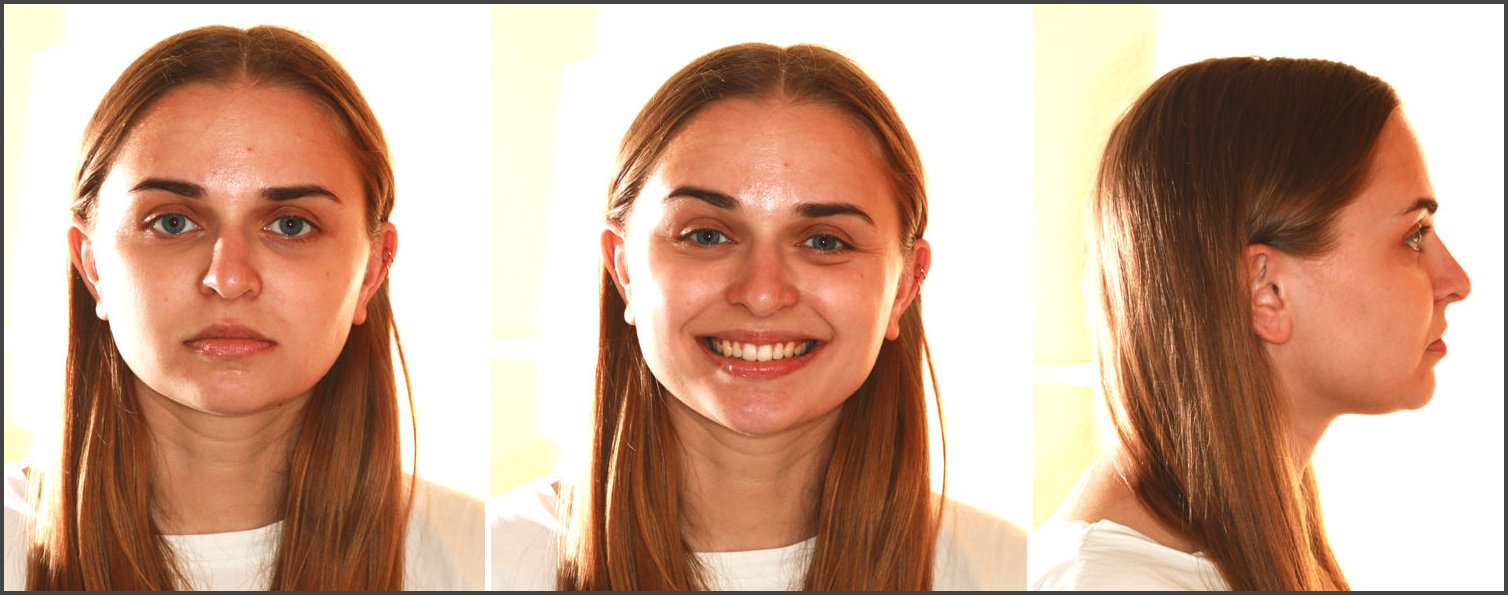
At the completion of active tooth movement and bracket debonding, final patient photographs were obtained (Figure 5a), as were the final occlusal views (Figure 5b). Both Class I molar and canine relationships were achieved along with 2 mm of overbite and 2 mm of overjet (Figure 5c).


At debonding, T-Scan multi-bite and right and left excursive movement recordings were made, that detailed the end of tooth movement occlusal force profile and timings (Figures 6a, 6b and 6c)


The comparison from before to after tooth movement T-Scan recordings show the A/P ratio decreased from 32% to 10.5%, the anterior quadrants decreased in force %, the Disclusion Times (DT) approached physiologic normal18 (0.55 sec Right DT; 0.38 sec Left DT) with both excursions demonstrating short duration working side and balancing side contacts that rapidly discluded. And the Right side-to-Left side imbalance was nearly equal (49.2% right- 50.8% left) (Table 2).
Discussion
There is emerging evidence that using the T-Scan Digital Occlusal Analysis System is a reliable alternative method for making an occlusal assessment.19 Data acquired from T-Scan was found to correlate with several orthodontic occlusal index parameters.20 Lee and Lee showed a significant correlation exists between 2 orthodontic indexes and the OT. The authors used the Peer Assessment Rating (PAR) Index that measures crowding and spacing in the maxilla and mandible, the buccal segment occlusion (anteroposterior, vertical, and transverse), the overjet (including anterior crossbite), the overbite, any edge-to-edge relationships, the presence of an open bite, any midline discrepancy, and the presence of impacted teeth. Further, the authors also employed the Objective Grading System (OGS), which was introduced by the American Board of Orthodontics as an alternative treatment outcome index.20 The better the index (lower for PAR and higher for OGS), the smaller was the OT. The better was the occlusion, the faster was the OT. This study also found that that the larger was the PAR overjet, value the worse was the OT (longer). Of note was that the OGS had nearly twice as many measured parameters significantly correlated with T-Scan measurements than did the PAR index.20
The goal of the described treatment in this Case Report was to correct the Class II molar and canine relationships to Class I, with the simultaneous correction of the increased overbite and the related crowding. Changes in the occlusal relationships improved the A/P ratio (the proportion of the total anterior percentage load to the total posterior percentage load). The A/P ratio is potentially important in assessing orthodontic treatment efficiency in anterior overbite cases. The latter presents with greater values at the beginning of treatment, as was shown in this Case Report. The occlusal plane inclination before treatment (Figure 1b; Table 1) may be the factor most associated with an increased A/P ratio. Further research is needed to support this contention.
The pre-treatment characteristics of the differing Angle Classifications have been previously described by Koval and coauthors,21 where the degree of Right side-to-Left side imbalance was similar in all Angle Classifications. But Class II had a significantly higher A/P ratio compared to Class 1 and Class II. The average Class I A/P ratio = 9.5%,and in Class II = 18.7%. Based on the notion that the aim of ideal orthodontic treatment is to correct occlusal relationships to Angle Class I, orthodontic treatment should aim to achieve ≤> 9.7% A/P ratio.
T-Scan studies involving patients with TMD have determined there exists a significant correlation between increased Occlusion Times22 and prolonged Disclusion Times and the presence of TMD symptoms.23–26 The Occlusion Time describes the degree of bilateral time-simultaneity present when a patient’s closes into MIP, and is ideal when it is ≤ 0.2 seconds in duration.27 The Disclusion Time (DT) is the elapsed time measured from the beginning of an excursive movement made in one direction (right, left, or forwards) from all teeth in complete intercuspation, through until only canines and/or incisors are in contact.28 The Disclusion Time describes the capability of a patient’s Anterior Guidance mechanism to functionally separate posterior teeth.
It has been previously described that Class II Division 2 non-extraction treatment carried out with Class II elastics, develops four-point contact, which corresponds to the sites where occlusal force is applied. The direction of force when using intermaxillary elastics extends in all three planes, including a vertical component that causes teeth to extrude, a sagittal component that causes mesio-distal tipping, and a transverse component that causes buccal tipping. Depending on the length of treatment and the strength of the elastic force, the resulting incisor relationship can be either edge-to-edge or slightly deeper. This inadvertently creates excessive anterior contact forces, as was shown in this presented Case Report in Figure 4. Importantly, the posterior contact points developed by Class II elastic wear, transferred into working and balancing side interferences that will often result in increased DT.
Several case reports12,14,29 describe the use of the DT measurement as an indication there exists posterior frictional contacts that may cause spacing between the maxillary anterior teeth. Disclusion Time Reduction (DTR) improves a patient`s laterotrusive movements by decreasing the amount of frictional interferences present, which are referred to by Silverman,8 as a potential cause of orthodontic relapse.
A comprehensive study by Cohen-Levy and Cohen30 described the implications of T-Scan data in optimizing orthodontic case-finishing and retention outcomes. In particular, these authors described in patients that wore lingual bracket appliances, the clinical implication of Force Percentage per tooth, the location of the Center of Force, the Occlusion Time when case-finishing adult patients whom had restored posterior teeth, and the presence of wear facets. The overall goals of achieving symmetrical contact distribution with the Center of Force centered and no Force Outlier contacts present on any teeth, can be achieved only with T-Scan data assessing the existing patient`s occlusion. And when necessary, making adjustments to the occlusal surfaces of worn teeth or to existing restorations, to relieve forceful contacts.
CONCLUSIONS
This Case Report described using T-Scan digital occlusion measurements before, during, and after orthodontic treatment with an Angle Class II division 2 anterior overbite malocclusion patient. Orthodontic intervention with fixed brackets and elastics were able to measurably improve the Right side-to-Left side balance, measurably decrease the A/P ratio, and measurably achieve Disclusion Time durations in the right and left excursive movements that approached the normal physiologic value (≤ 0.50 seconds/excursion).
Funding
No funding was received from any source for this project.
Conflicts of Interest
SK reported none. RBK is a consultant to Tekscan but receives no monetary or other compensation because of sales of their products.