Introduction
Deep bite malocclusions present with decreased lower anterior facial height (LAFH), are seen in Class I, Class II Division 1, and Class II Division 2 Angle’s classifications. The first and the third groups are characterized by retroclined upper incisors and an increased inter-incisal angle.1,2 While the majority of anterior overbite malocclusions are associated with the decreased gonial angle, mandibular plane angle and maxillary plane clockwise rotation,2 there are cases with dolichocephalic growth patterns that exhibit deep incisor overbite.3–5 The anterior (counter clockwise) rotation of the mandibular plane does not necessarily affect the development of an anterior overbite.6 Anterior overbites were shown to be related to temporomandibular disorders by some authors,7,8 while others found no association.9–11
Biometric studies using T-scan (Tekscan Inc. S. Boston, MA, USA) digital occlusal analysis have shown there are differences in force distribution, Occlusion Time (OT), Disclusion Time (DT) among different Angle Classifications.9 T-scan digital occlusal analysis has been used to analyze the progression of orthodontic treatment.1,10,11 T-scan occlusal analysis has been shown to measure the Right-side to Left-side occlusal bite force imbalance,12 the presence of forces in the anterior region of the dental arches,13 the first occurring contact during the closure cycle14 as well as bite timing within 1/100th of a second.13,15,16
Objectives
The objectives of the current study were to analyze occlusal characteristics (initial contacts, occlusal force ratios, Occlusion times, Disclusion times) in pre-orthodontic anterior overbite patients, and compare groups of anterior overbite patients with Class II and Class I Angle classifications. It was also a secondary objective to look for the presence of any gender differences that might be significant.
Materials and methods
A total of 57 pre-orthodontic patients with Angle’s Class I or Class II occlusions with anterior overbites were examined to assess occlusal characteristics measured with T-scan 9 digital occlusal analysis. Three groups were examined: 1) Group A, all 57 subjects, mean age 15.46 (± 7.45 years), 2) Group B, Angle’s Class I, 29 subjects, mean age 15.62 (± 5.52 years), and 3) Group C, Class II, 28 subjects, mean age 15.29 (± 9.14 years). There were no significant differences in the mean ages of the subjects between groups B and C.
The number of teeth in groups A, B, and C were 26.42 (± 2.99), 26.27 (± 3.45), and 26.57 (± 2.47), respectively. There was no significant difference in the number of teeth between groups B and C. Any overbite with more than 3mm of lower incisor overlap was considered ‘increased.’ Patients with an increased overjet (> 3mm) were also included in the study. The maximum overjet measured was 8 mm. A standard periodontal probe was used to measure both the overjet and the overbite of each patient.
Every patient underwent a standard examination protocol used in this private practice that included a clinical exam, facial and intraoral photographs, physical impressions and required radiographs. Following this examination each subject underwent T-Scan digital occlusal analysis procedure. The standard protocol in this practice comprises of a set of four recordings: 1) a multi-bite into the maximum intercuspal position (MIP), 2) right lateral excursion and 3) a left lateral excursion.
To improve patient’s understanding of the excursive movement, a demonstration of the movement was made by the practitioner with an explanation. The subject was then asked to repeat the desired movement while viewing with a hand mirror. Prior to recording with T-Scan, each subject’s tooth dimensions were measured and entered into the T-Scan’s tooth chart. Sensor conditioning was completed with 2-3 initial tooth crushes prior to starting the first T-Scan recording.
T-Scan HD sensors are fabricated in two sizes – large and small. The pressure exerted by the teeth is analyzed as a difference in the voltage output coming from the 1370 sensels (for the large) or the 1122 sensels (for the small). Sensels are located between the upper and lower layers of the sensor Mylar in the conductive layer.
T-Scan recordings were made with the subject seated in the upright position in the dental chair. The Centric Occlusion record (in MIP) was carried out with the sensor positioned in the patient’s mouth and the subject asked to occlude on the sensor, hold for 2-3 seconds and then open the mouth. For the multi-bite recording, the sensor was positioned in the subject’s mouth, the subject was asked to close-and-open three consecutive times during the same cycle of recording. The excursive recordings were carried out with the sensor positioned in the subject’s mouth, the subject instructed to close on the sensor, hold for 2-3 seconds, and then slide the mandible to the right, to the left, or in protrusive movement while keeping their teeth in contact. The excursive recordings were deemed complete when the subject moved their mandible as far as they could in the desired direction.
The following parameters were measured:
-
Occlusion Time (OT)
-
Disclusion Time (DT)
-
Anterior Total Force Percentage (Anterior %)
-
Anterior to Posterior Force Ratio (A/P ratio)
-
Frequency of each numbered tooth’s first contact
These were the definitions used.
Occlusion Time (OT): The elapsed time in seconds, measured from the 1st tooth’s contact until the last tooth’s contact, as a patient closes all their teeth together from completely open (no tooth contact) to the beginning of static intercuspation.17 Static intercuspation occurs before the patient achieves maximum intercuspation force levels (in MIP). The Occlusion Time describes the degree of bilateral time-simultaneity present in a patient’s occlusion and is ideal when the OT < 0.2 seconds in duration.17
Disclusion Time (DT): The elapsed time in seconds, measured from the beginning of an excursive movement made in one direction (right, left, or forwards), beginning with all teeth in complete intercuspation through until only canines and/or incisors are in contact.18 The Disclusion Time describes the capability of a patient’s Anterior Guidance mechanism to functionally separate posterior teeth. Both the Occlusion Time and the Disclusion Time are occlusal function parameters that cannot be detected with articulating paper alone.
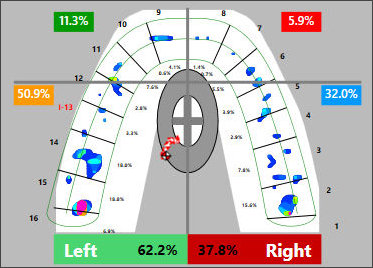
Anterior-Posterior Force Ratio (A/P ratio): The ratio created by summing the forces in the two anterior quadrants and dividing by the sum of the forces in the two posterior quadrants, as seen in a four-quadrant view of the 2D diagram of relative forces. See Figure 1. This characteristic has been shown to be of a particular interest when analyzing the outcome of orthodontic treatment.19 Initial contact is the first measured contact when teeth are coming into intercuspation. The initial contact is measured in multi-bite recording as it allows to clearly view its occurrence and repeatability.

Anterior Force Percentage (AFP): The AFP is the Anterior-Posterior Force Ratio multiplied by 100. The Anterior Forces are measured anterior to the horizontal line dividing the 2D view of the arches into four quadrants: left anterior, right anterior, left posterior, right posterior. The horizontal line is located along the distal contact point of the upper canines in the upper arch 2D view. See Figure 1.
In patients with deep overbite the T-scan sensor sensitivity test after several conditioning closures was conducted. The T-scan sensor was adapted to the arches in intercuspation prior to making any recordings. The bending effect of the sensor with teeth with acute cusp slopes, exaggerated anatomy, sharp cusp tips and in deep overbite cases requires sensor sensitivity adjustment to decrease the noise coming from the deflection of intermediate layer in between the Mylar layers.
The procedure of setting the sensor sensitivity is done using the sensor sensitivity adjustment in the lower left corner of the computer screen that consists of fourteen square cells in the current version of the program. The default sensitivity is set at seven cells and can be manually adjusted based on the number of high force columns appearing on the 3D view during the check. Previous studies20,21 suggest, that two or three high force (red and/or pink colored) 3D sensels per maximum intercuspation is the preferred setting for the sensitivity. The present study used the same measure of sensitivity adjustment (number of high force columns), regardless of the number of active sensitivity cells on the screen. Some patients were set at a sensitivity of two, three or four cells (low sensitivity) due to high occlusal forces being applied. Others required higher sensitivity settings at five and six cells due to lower occlusal forces.
The T-scan data for all patients was collected following a rigid protocol. The initial contacts were determined based upon the T-scan 10.0 software ‘first contact’ feature in multi-bite recordings. Occlusion and Disclusion times were calculated by the software and tabulated for each patient. The Anterior to Posterior Force ratio was calculated by dividing the sum of the two Anterior Force percentages by the sum of the two Posterior force percentages in the multi-bite recording four-quadrant view. The Anterior Force Percentage was calculated by multiplying the Anterior Force Ratio by 100. Standardized t-test statistics with 2.05 degrees of freedom was used to determine statistically significant differences between classes or groups. Probability density diagrams were created to demonstrate the distribution of different values in the groups, which can be later used as probability density for the respective population groups.
Results
The mean measured OT in Group A was 0.17 sec with the range of 0.04 to 0.89 seconds. The mean DT in right and left lateral excursions was 0.69 and 0.60 sec, respectively, with the range of 0.08 to 3.17 and 0.06 to 1.83 seconds for the respective movements (Table 1).
The total group was also divided into male and female subgroups for a gender comparison of OT, DT Right, DT Left, A/P ratio and AFP. Female subjects, on average showed higher DT with lower Ant% than male subjects (Table 2) but the differences were not significant (p > 0.05).
The total group (Group A) was analyzed based on the Angle Classification parameter (Cl I or Cl II). No differences were found between classes, except for the A/P Ratio (Table 3).
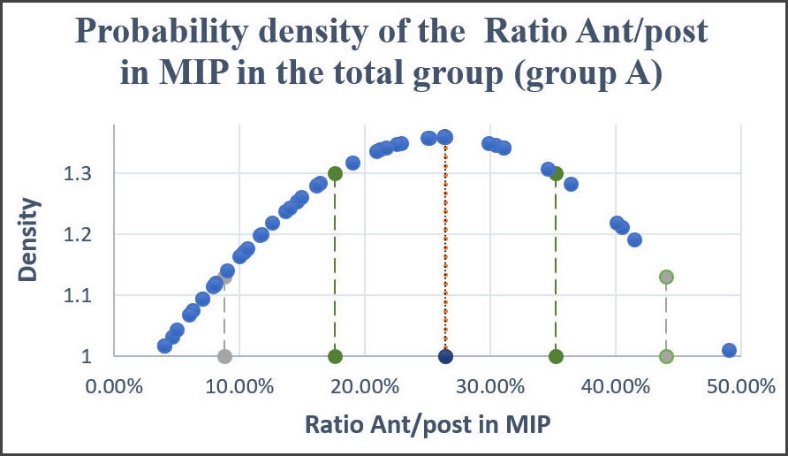
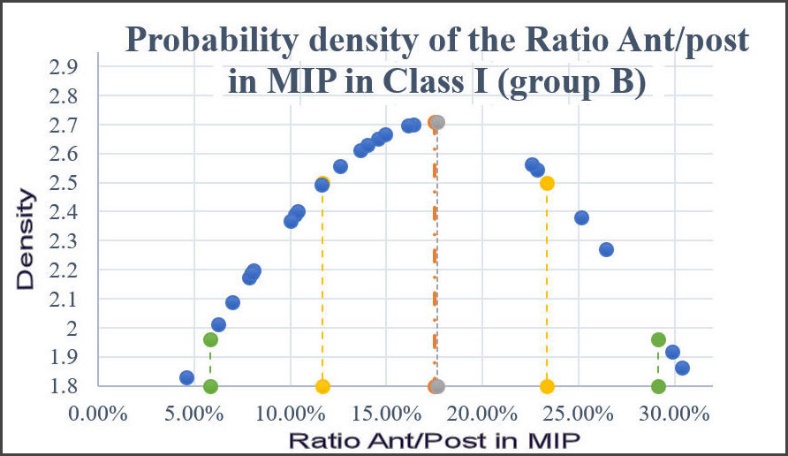
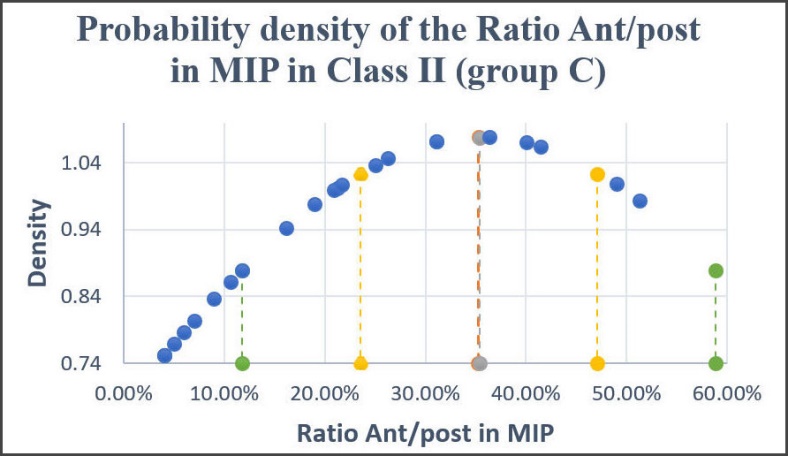
The probability density diagrams were constructed to show the probability of the A/P ratio within Group A (Figure 2), Group B (Figure 3), Group C (Figure 4). The Figures describe the average Ant/Post Ratio in the total anterior overbite group at the level of 25%, in Class I at the level of 17.5%, and the Class II group being calculated at 35%.
.jpeg)
.jpeg)
.jpeg)
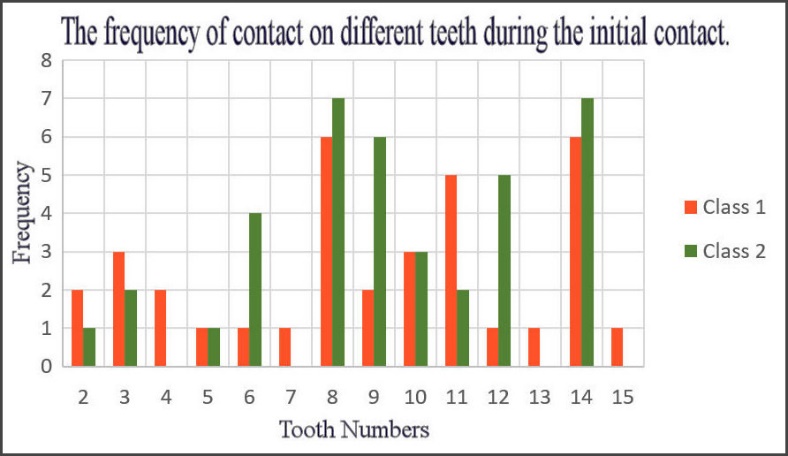
The highest occurrence of initial contacts in Class I and Class II was found on teeth #8, #11 and #14 (Class I group), and #8, #9 and #14 (in Class II group). The most frequently occurring first contact was measured on upper right central incisor and upper left first molar, followed by the upper left central incisor and the upper left first premolar. In 7 patients tooth #8 and tooth #14 was the first to contact, in 6 patients tooth #9 was the initial contact, no initial contacts were observed on teeth 4, 7, 13 & 15 in Class II anterior overbite patients. In Class I anterior overbite patients the highest occurrence of the first contact was also found on teeth 8 and 14, followed by tooth 11. Figure 5.

Discussion
The pre-treatment characteristics of the different Angle’s Classifications have been previously described by Koval and coauthors, where the degree of Right-side-to-Left-side imbalance was similar in all Angle Classifications.9 But Class II had a significantly higher A/P ratio compared to Class 1 and Class III. The average Class I A/P ratio = 9.5% and in Class II = 18.7%. Based on the notion that the aim of ideal orthodontic treatment is to correct occlusal relationships to Angle Class I, orthodontic treatment should aim to achieve < 9.7% A/P ratio,19 which was taken as a baseline for the patients without any TMD symptoms.
The case report of a Class II Div. 2 malocclusion patient showed a significant improvement in an Ant/Post % from 31% to 10.5 % with orthodontic treatment,19 which also indicates that improved occlusal contacts corrected to Class I occlusal relationship, exhibit an A/P ratio close to 9.7%.
Qadeer reported the anterior-posterior force imbalance as higher in non-orthodontic patients (22.46% total anterior force) and less in post-orthodontic patients (10.58% total anterior force).22,23 Same individual values of A/P ratio before and after orthodontic treatment were calculated in the case report.19 Current study confirms the findings by Qadeer, showing increased pre-orthodontic A/P values within the same range.
The results of this current study have shown that anterior overbite patients regardless of Angle Class have relatively higher A/P ratio, averaging at 26.37%. Class II subjects with anterior overbite were shown to have significantly higher A/P ratios than Class I subjects (35.4% compared to 17.64 %). Thus, transitional conclusion can be made that Class I subjects present with the least A/P ratio (of 9.7%), while Class I subjects with anterior overbite own, on average, higher values of A/P ratio (17.64%), and Class II subjects with anterior overbite present with the highest A/P ratio values (averaging at 35.4%).
The distribution of A/P ratio values within the group of Class II anterior overbite patients (Figure 3) indicates there is a higher probability of seeing Class II anterior overbite patients with the A/P ratios in the range of 23.53 % – 47.07 %, while there is a lower probability to encounter these patients with the A/P ratio numbers within the range of 11.77 % – 23.53 % and 47.07 % – 58.83 %, corresponding to +/- 2 SD.
Figure 3 displays the density probabilities of Class I anterior overbite patients showing that the highest density is located below 15% of A/P ratio measurements. The A/P ratio can become a descriptive parameter for different Angle’s classifications and a relative indicator of treatment quality outcome.
DT in Group A in this study (representing a total group of Class I and Class II anterior overbite subjects) was measured at 0.69 sec (Right) and 0.60 sec (Left). Previous study comparing Class I, Class II and Class III, has shown that DT Right and DT Left were the following: 0.906 sec (DT Right in Class I group), 1.071 sec (DT Left in Class I group), 0.992 (DT Right in Class II group), and 0.806 (DT Left in Class II group). Shorter DT in anterior overbite group, as shown in this study, is a clear indicator of the occlusal relationship and the anatomy of the Curve of Spee, allowing for a faster disclusion when anterior quadrants, not necessarily the canines, take over the guidance.
Initial contacts are measured contacts that first occur in early intercuspation. The incidence of initial contacts in a group of mixed malocclusions (as reported in the study by Koval and Kerstein,9 2021) was mainly found on teeth #14 and #6. Current study indicates that teeth #8, #9 and #14 also have the most numbers of initial contact occurrences.
Cohen-Levy reported 6-8% of orthodontic settling improvement within six months after completion of treatment.24
Moreover, a newly published report suggests the use of T-Scan data in conjunction with the artificial intelligence algorithms to automatically determine the Angle’s classification when diagnosing orthodontic patients.25
Limitations
Limitations of the study might include selection bias. The study sample consisted of pre-orthodontic subjects seeking orthodontic treatment, which may not accurately represent the general population. Due to the imbalanced distribution of male and female subjects, further studies would need to be conducted to support the lack of gender differences in the studied parameters. Considering fact that the p values of some of the parameters were close to 0.1000, it is possible that a substantially larger sample, especially including more females, may have revealed some additional significance.
Conclusion
T-scan digital occlusal analysis was used to analyze dynamic occlusion with a wide spectrum of parameters including initial contacts, occlusal force ratios, Occlusion times, Disclusion times in a group of Class I and Class II anterior overbite subjects. The group was analyzed based on gender and Angle’s Classification. There are no gender differences in OT, DT, Ant %, A/P ratio parameters.
A/P ratio was the only discriminate characteristic for different Angle Classification malocclusions with anterior overbite. Cl II subjects with anterior overbite shown higher values of A/P ratio than Cl I anterior overbite subjects.
T-scan data provides valuable descriptive data of various malocclusions. Malocclusion characteristics described with T-scan digital occlusal measurements serve as a reference for treatment of orthodontic malocclusions and the development of an understanding of occlusal parameters within various Angle Classifications.
Funding Source
None.
Conflicts of interest
None.