

Introduction
Gender differences have been repeatedly found in the strength of the masticatory musculature with males having the greater strength, higher maximum surface EMG output and higher force measurements during maximum voluntary clenching (MVC) recordings.1–4 Some authors have found that female subjects are more likely to experience mastication-induced oral-facial muscle pains than male subjects, suggesting a gender difference in the propensity for developing masticatory muscle pain.5 Other authors have been unable to distinguish between genders or between control subjects and Temporomandibular Disorders (TMD) patients when analyzing masticatory movements and could only conclude that the consistency of a masticated bolus can significantly influence masticatory movement an muscle activity parameters.6,7
When bite force has been measured in youthful subjects by placing a dynamometer between the teeth, differences between symptomatic and control subjects have been elusive as have differences between genders.8 However, this method removes any occlusal factors from the experiment, introduces an increase the vertical dimension and establishes a new unique set of conditions and constraints.
The long history of recording of mastication as incisor-point motion and muscle surface electromyographic activity (sEMG) suggests consistent methods and a standardized bolus are necessary to minimize extraneous results.3 The size of the bolus affects the size of the resulting movement pattern. The consistency of the bolus influences the masticatory parameters.6,7 A tough resistant bolus challenges the masticatory system and can reveal lesser dysfunctions typically not detected during gum chewing studies.9
Incisor-point tracking and sEMG can be combined as a single simultaneous recording and then analyzed separately.10 The advantage of simultaneous recording is that the movement data can precisely segment a sequence into individual cycles, which can then be averaged to characterize the subject’s mean movement pattern and each muscle’s mean contraction pattern.11 In contrast, segmenting into individual cycles directly from only sEMG records requires one muscle to be the reference and that transfers the variability of the reference muscle to all additional muscles recorded.12
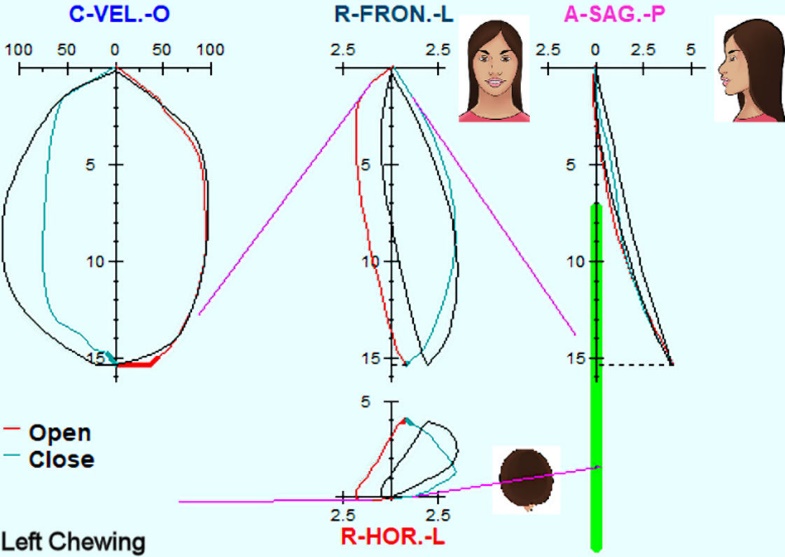
The Average Chewing Pattern (ACP) was originally proposed by Kuwahara et al when comparing subjects with various Temporomandibular Joint (TMJ) dysfunctions to a control group.13–15 The averaged frontal, sagittal, horizontal and velocity patterns calculated from sequences of directed left or right chewing cycles were used to characterize the masticatory motion profile of each subject compared to the known patterns of a control group. In Figure 1 (left chewing) the reference mean normal patterns from a large sample of normal control subjects (black lines) are scaled to fit the individual subject’s vertical size to allow a visual comparison of the pattern shapes in each plane. This example, although not a perfect overlap, would be considered a good match for pattern shape, just a little slower in closing and somewhat wider in frontal opening. A right-sided normal ACP should be the mirror image, opening to the left and closing to the right.
_for_frontal__sagittal__horizontal_and_velocity_planes_(r.jpeg)
Objectives
The objectives were to discover any statistically significant gender differences in the masticatory incisor-point movements and/or electromyographic muscle activity within a youthful asymptomatic control group of female and male subjects.
Methods
Movement analysis
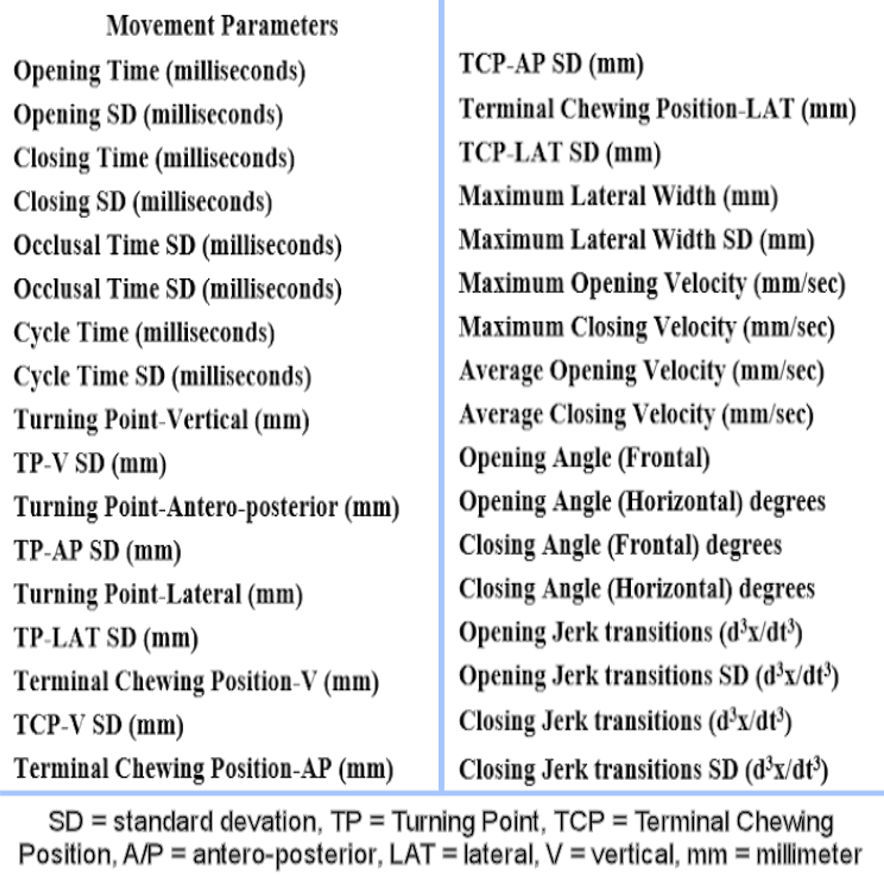
A mixed gender group of 77 youthful (mean age = 23.9 +/- 3.63 yrs.) asymptomatic subjects (41 females) was recruited to masticate a hard bolus while their incisor-point motions and muscle activities were recorded. Incisor-point movements were recorded with the JT-3D magnetic incisor-point tracker (BioResearch Associates, Inc. Milwaukee, WI USA). Simultaneously, their bilateral masseter and anterior temporalis muscle activities were recorded with the BioEMG III electromyograph (BioResearch Associates, Inc. Milwaukee, WI USA). The hard bolus was chosen (Chikki) because it challenges the masticatory system tends to reveal any minor dysfunctions that are usually not revealed when gum is the bolus. The movements were displayed as incisor-point patterns in the Frontal, Sagittal, Horizontal and Velocity planes. Figure 1. Using version 8.8 of the BioPAK software program (BioResearch Associates, Inc. Milwaukee, WI USA) each sequence was segmented into individual cycles starting at 0.3 mm of opening and continuing to same point at 0.3 mm of opening of the next cycle. The opening phase ended (and the closing phase started) at the Turning Point, the point furthest from the intercuspal position. The closing phase ended (and the occlusal phase started) 0.3 mm below (and a few milliseconds before) the point of maximum bolus crush. The thirty-four different movement parameters were calculated from each subject’s ACP dataset. See Figure 2.

Informed consent was received from each participant. Inasmuch as this protocol included control subjects, no diagnoses or treatments, an exclusion was granted from the Institutional Review Board.
The process of evaluating masticatory movements began by calculating the Averaged Chewing Pattern (ACP) as shown in the example of Figure 1. The 34 parameters listed in Figure 2 are calculated for each subject as the means and standard deviations of 15 or more cycles after rejecting any cycles that fall more than 2 standard deviations away from the individual subject’s mean pattern from all cycles. Note: Cycles rejected from the data are usually due to swallows or unusual bolus manipulations. Then all 34 averages from the 41 females were compared to the 36 male averaged values.
Surface Electromyographic (sEMG) data
The bilateral anterior temporalis and superficial masseter muscles were recorded simultaneously with the movements. After the cycle segmentations were determined from the movement data, they were used to segment the sEMG data of the complete sequence into individual cycles of bilateral masseter and anterior temporalis sEMG data. These data were used to calculate six mean muscle activity parameters for each muscle. See Figure 3.
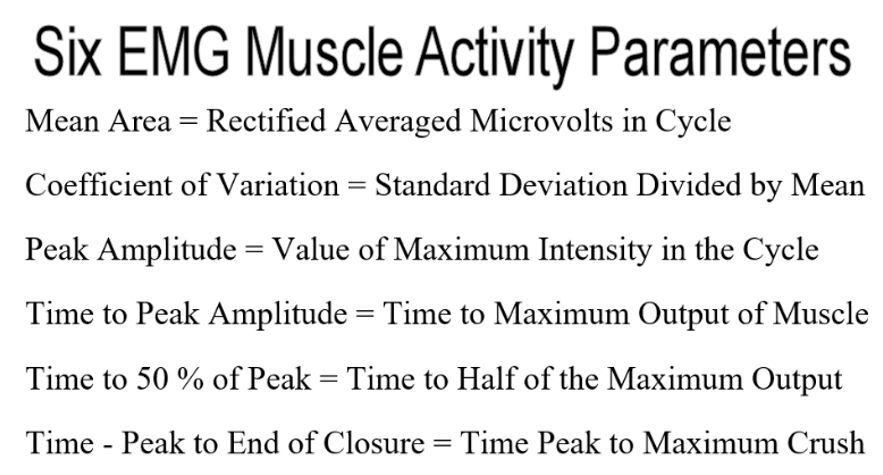
The Mean Area is a measure of intensity (microvolts) multiplied by the cycle time (milliseconds) and represents the best indication of amount of effort in units of microvolt-seconds. Thus, at a given intensity of contraction, mainly determined by the resistance of the bolus, faster chewing uses less effort.
The Coefficient of Variation is the standard deviation divided by the mean and indicates the size of variations compared to the size of the mean. A larger number indicates greater variability.
The Peak Amplitude indicates the highest average level of contraction at any point within the cycle.
The Time to Peak Amplitude is measured from the beginning of opening at precisely 0.3 mm from the maximum bolus crush position.
The Time to 50 % of Peak Amplitude indicates how the intensity rises (early or late) in closing.
Time from Peak to End of Closure is an indication of the chewing confidence of the subject where late peaking after the end of closure is an indication of less confidence.
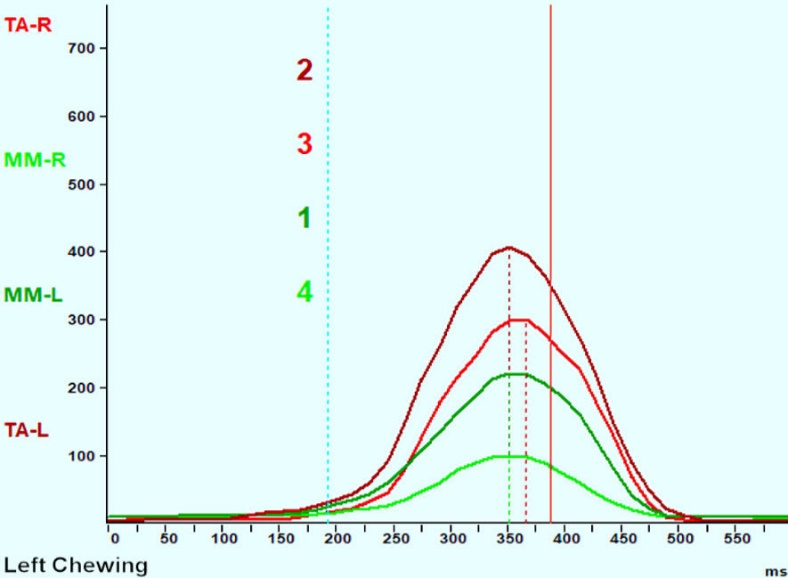
Using the segmentation from the motion data an Averaged Chewing Cycle (ACC) is calculated and graphed from the masseter and anterior temporalis (sEMG) data as shown in Figures 4 & 5. An example of a Class I asymptomatic control subject’s Averaged Chewing Cycle (ACC) for each muscle during left-side mastication is graphed in Figure 4.
_muscle_activity_for.jpeg)
Note: These muscular classes (I & II) of control subjects do not refer to occlusal classifications.
The MM-L was the working masseter and TA-L was the working anterior temporalis. The solid orange vertical line indicates the End of Closure (EOC) and marks the time (470 milliseconds after the onset of opening) at which the bolus is maximally crushed. The dotted matching color vertical lines indicate the timing of the peak amplitude for each muscle, which occurs well before the end of closure in these normal control subjects. The vertical column numbers (1 2 3 4) indicate a normal Class I muscular hierarchy of activity from working masseter (1) most active, working temporalis (2), non-working temporalis (3) and to the non-working masseter (4), which is the least active.
The Class II control subject’s muscle pattern example in Figure 5 is also associated with a normal ACP movement pattern but represents a muscular adaptation to a more retrusive intercuspal position. Note that the working side anterior temporalis and non-working side anterior temporalis muscles are dominant in Class II muscular patterns while the masseters function with a less active contribution. The dotted vertical lines all occur well before the end of closure (solid orange vertical line) in this well adapted normal asymptomatic Class II subject.
_of_a_class_ii_control_subject__which_predictably_changes_the_.jpeg)
Statistics
The Mann-Whitney U test was used to evaluate the significance of each parameter when the data were found to be not normally distributed using the Shapira-Wilk test. For normally distributed datasets Student’s unpaired t test was used.
Inclusion criteria
-
Youthful subjects (16 ≥ subjects ≤ 30 years old)
-
Full natural dentition (except third molars)
-
Clinically appearing good occlusion without any excessive wear, extensive caries or prostheses
Exclusion Criteria
-
Any TMD symptoms or complaints within the TMJ or any painful stomatognathic muscles
-
Any systemic disease or condition that might compromise their masticatory function
-
Subject declined to participate
Results
Out of the 34 movement parameters calculated for right-side hard bolus mastication, none indicated a significant difference between genders. However, for left hard bolus mastication, one movement parameter appeared to exhibit a trend toward significance, the Frontal Opening Angle for left mastication (p > 0.07346).
The other 33 movement parameters were clearly not significantly different between genders with an average p value > 0.48469. See Tables 1 & 2. Coincidentally, the mean vertical index between the males and the females was also not significantly different (p > 0.4700). For the sake of brevity only half of the left-sided movement parameters (17) are presented in detail here as examples. The right-sided results were quite the same (not significant).
Muscle Activity
Comparing the individual muscles between genders no statistically significant differences were found (p > 0.05 for all), probably because there was a wide range of different intensities from different individuals. However, when we considered the combined activity of bilateral anterior temporalis and superficial masseter muscles, some significant differences were found. Each sEMG array of four muscles for the females included 164 datapoints and 144 datapoints for the males. The larger n of the sample sizes resulted in normal datasets, which allowed the analysis to use Student’s unpaired t test.
Left Chewing EMG
To test the overall effort of each group the Mean Area of all four muscles was averaged together as one parameter (n = 164 for females, n = 144 for males) because the activity was distributed quite differently over a wide range by individuals. Likewise, overall means were calculated for the Coefficient of Variation, the Peak Amplitude and the Time to Peak Amplitude.
No significant differences were found in the Time to Peak Amplitude or in the Time to 50 % of Peak Amplitude. The Time Peak to End of Closure
A significant difference was found in the Mean Area muscle effort for the four muscles combined in left chewing, which was greater for the females (90.2 +/- 167.6 microvolt-seconds) compared to the same measure for the males (50.3 +/- 59.8 microvolt-seconds). This parameter was subjected to Student’s t test and found to be significantly different between genders (p < 0.01627). See Table 3.
The mean peak amplitude of the combined muscles was significantly greater for female group. The females produced a Mean Area of 90.2 microvolt-seconds and the males produced only 50.3 microvolt-seconds (p < 0.01627). The females produced an averaged Peak Amplitude of 210.1 μV while the males only produced a 175.5 μV average peak value (p < 0.0075). The time from the beginning of opening to the peak EMG muscle activity was greater for the female group. For the females the mean time was 430.9 milliseconds because the males as a group chewed faster and their mean time was 395.5 milliseconds, but the difference was not significant (p > 0.0532). The variability (as indicated by the coefficient of variation for the mean intensity of the four muscles) did not exhibit a significant difference between genders (p > 0.2292).
Right Chewing EMG
Using the same approach, a significant difference was found in the Mean Area muscle effort for the four muscles combined, which was greater for the females (67.0 +/- 100.6 microvolt-seconds) compared to the same measure for the males (48.2 +/- 53.5 microvolt-seconds). This parameter was subjected to Student’s unpaired t test and found to be significantly different between genders (p < 0.0224). See Table 4. The variability as indicated by the Coefficient of Variation was significantly larger for females (p < 0.0168). The Peak Amplitude was significantly larger for females (p < 0.000007) and the Time to Peak Amplitude was significantly larger for females (p < 0.02578). The differences in Time to 50 % of Peak Amplitude and the Time, Peak to End of Closure were not significant.
Discussion
The small but consistent differences in the timing of this group were related to the fact that the males tended to chew somewhat faster, making all the male times slightly shorter. The consistently similar distances were attributed to the fact that all subjects masticated the same size and texture of bolus. The similarity in the Terminal Chewing Position between genders was attributed to the constancy of the resistance of the hard bolus requiring substantial effort and multiple chewing strokes to fully crush. The consistently higher, (but not significantly so), velocities of the males were also likely due to a slightly faster chewing rate.
The significant differences in Mean Area for both left-sided (p < 0.01627) and right-sided (p < 0.0224) mastication could have been due to the recruitment of larger motor units and/or longer contraction times by females, which would have produced higher Mean Areas from the sEMG data. The significantly higher female average left-side (p < 0.0075) and right-side (p < 0.000007) Peak Amplitudes suggest that the recruitment of larger motor units may have contributed more than the slightly longer contraction times. The significantly shorter time to Peak Amplitude for males was likely just due to faster chewing. The right-side Coefficient of Variation was significantly lower for males, but the left-side Coefficient of Variation was not. This difference between sides might be resolved in the future by taking a substantially larger sample.
Kuwahara et al were the first to describe the Average Chewing Pattern (ACP) and arrive at a mean normal description from control subjects.15 They also defined several patterns representative of various dysfunctions of the TMJ. Since chewing is normally unilateral, the left-side and right-side chewing patterns appear as mirror images in the motions and the hierarchy is reversed with respect to the function of the working-side versus the non-working-side muscles.
Kerstein et al demonstrated improvements in the timing and the consistency of masticatory movements of dysfunctional subjects, as well as a reduction in the number of sEMG silent periods occurring during function after ICAGD treatments.16 Note: Each silent period occurring during mastication indicates an interfering tooth contact.17
No significant differences were found in any of the 34 movement parameters between genders within this normal group, which suggests that all the subjects were either quite normal or equally well adapted. By calculating the Jerk function (d3x/dt3), the third derivative of the movement data, it was possible to evaluate the smoothness of the chewing function.18 No significant difference was detected between genders in jerkiness. See Table 1.
It was expected that all these subjects should have relatively normal masticatory movement patterns because they are young, relatively normal asymptomatic controls (mean age of total group was 23.9 (+/- 3.63), range was 16 to 30 years). On average youthful subjects should have simply been exposed to less trauma or age-related degeneration. It was expected that the presence of a few dysfunctional subjects should tend to be washed out of a group of this size. In fact, the mean ACP pattern of this mixed group closely matched the control subjects of Kuwahara.13 However, it was likely that some of the subjects were well adapted rather than being ideal in their masticatory function. Successful adaptation was evident whenever the ACP appeared as in Figure 1, but the muscle hierarchy of the ACC did not match Figure 4.19 The ACC pattern in Figure 5 is typical of the successful adaptation of the musculature to a Class II (occlusion) in a subject with a retruded maximum intercuspal position.
Greater amplitudes of the females in sEMG activity should not be assumed to indicate more force between genders, especially when muscles on average are smaller in females.20 The power spectrum and the strength differences between genders have been previously identified.21,22 The significantly higher average peak amplitudes of the females implies that motor units with larger numbers of fibers were recruited, increasing the amplitude and the mean power frequency and the intra-subject level of force. The force that is required to masticate a bolus is dictated by the resistance of the bolus.6,7 For example, a bolus of softened chewing gum elicits far less force from a subject than a hard resistant bolus like Chikki. The greater amplitudes may indicate that the females are working relatively harder to accomplish the same activity. This difference may be a contributor to the greater susceptibility of females to dysfunction.
The greater variability of the females in right mastication suggests that on average their right sides may have functioned less than ideal. From what we know about the variability of mastication, the fact the variability of the males right-side chewing was less suggests it probably represented better function.23 If the average variability of the left-side mastication of the males was also less than ideal, that could have increased their left-sided variability and account for not finding any significant difference in variability between genders for left mastication.
Since the movement parameters were not found to be statistically dimorphic, gender must not be a significant contributor to the changes recorded previously in the movement parameters of dysfunctional subjects.23 With respect to the movement parameters, a slowing, a decrease in vertical size and an increase in variability have been revealed in dysfunctional subjects irrespective of gender.
Limitations
As much as every effort was made to select normal asymptomatic subjects, the adaptability of humans to the critical function of mastication means some or many of the selected subjects, while not complaining or showing overt symptoms, probably had some compromises in their function. The expectation was that most of the compromises would be randomly distributed and therefore tend to cancel out or have minimum affects by occurring infrequently. The two exceptions were the finding of a difference in the coefficient of variation of muscle activity between genders for right-sided mastication, but not for left-sided mastication and the trend towards a difference in frontal opening angle for left-sided mastication but not for right-sided mastication. Additional research is indicated to re-test for these possible differences.
Conclusions
These results suggest that none of these 34 mean movement parameters that were calculated from masticating a hard bolus were dimorphic with respect to gender within this normal control group. This finding suggests that a universal preferred pattern of chewing may be inclusive of both genders. However, significant differences in relative muscular effort were indicated by the significantly greater sEMG mean Peak Amplitude (larger motor unit size) and the Mean Area (relative effort) of the females. It was inconclusive whether greater variability of females may or may not also be included. Future studies using EMG should account for these gender differences.
Acknowledgements
We thank Prof. Takao Maruyama for his reference control data from 500 normal subjects.
Potential Conflicts
Radke J is the chairman of the board for BioResearch Associates, Inc. but does not receive any commissions from sales of their products.
Funding
No funding was provided from any source for this research.