


Introduction
Trigeminal Neuralgia (TN) is the most common of the cranial neuralgias, and the most common cause of non-odontogenic facial pain.1 It affects 4-5 persons per 100,000 per year,2 and occurs with a characteristic trigger zone that elicits intense shooting pain, which is uncharacteristic for the intensity of the stimulus. Actions that can set off TN pain are brushing teeth, shaving, chewing, or a cold wind blowing across the face.3
The diagnosis of TN is based on a history of shooting pain along a branch of the Trigeminal Nerve, precipitated by touching a trigger zone.1 The exact cause of TN remains controversial, because only 10% of the cases present with a vascular malformation or tumor, while the other 90% are classified as idiopathic,1 resultant from vascular compression and demyelination of the Trigeminal Nerve.3 However, in one MRI study, 10 out of 18 subjects demonstrated vessel-to-nerve contact on the non-painful side of the face, while 6 others had no neurovascular contact.4 Similarly, other authors who used MRI to examine TN patients found a lack of vessel to nerve contact in many of the TN.5 This lack of physical neurovascular compression indicates that other factors must be etiologic for TN, despite that TN pain can sometimes respond positively to microvascular decompression surgery (MVD), and TN can occur and reoccur without any neurovascular compression.6
Most authors do not consider the occlusion as a potential etiology for Trigeminal Neuralgia episodes. However, a recently published TN treatment study7 and 1 TN case report3 that employed 2 biometric technologies in concert (T-Scan 10/BioEMG III) to diagnose and treat the subjects’ occlusions with computer-guided occlusal adjustments, successfully lessened Trigeminal Neuralgia symptom frequency and intensity, and improved emotional well-being after treatment resolved the subjects’ chronic pain. This computer-guided occlusal adjustment procedure (known as Disclusion Time Reduction (DTR) with the Immediate Complete Anterior Guidance Development coronoplasty (ICAGD),8–10 employs highly precise, measured occlusal adjustments,11–16 which shortens the durations that posterior teeth contact and engage during excursive movements, to markedly lessen the occlusion’s afferent neurologic inputs to the Central Nervous System (CNS).17 This in turn lessens the efferent muscle contraction levels of the muscles involved in chewing and swallowing.17,18
To date, as only 1 computer-guided occlusal adjustment treatment study has focused solely on Trigeminal Neuralgia symptoms,7 the Objective of this study was to corroborate or refute whether Trigeminal Neuralgia frequency and intensity changed after patients underwent computer-guided occlusal adjustments, potentially determining if TN has a dental occlusal etiology. The null hypothesis was: Reducing the Disclusion Times with computer-guided occlusal adjustments will not change Trigeminal Neuralgia symptom frequency or intensity.
Methods and Materials
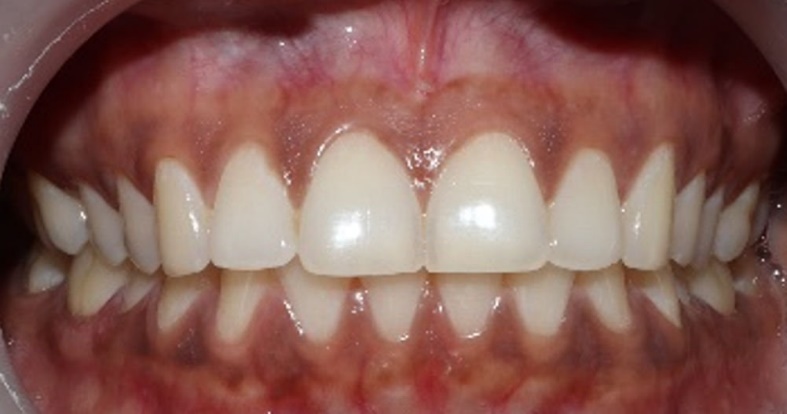
Thirty-one TN patients diagnosed at a Neurology Clinic (The National Institute of Mental Health & Neurosciences, Bengaluru, Kamataka, India), were referred to a prosthodontic dental office with chief complaints of Trigeminal Neuralgia pain to undergo a digital occlusion and muscle physiology evaluation. In addition to TN problems, some of the referred patients demonstrated chewing fatigue, chewing pain, chewing weakness, ongoing head, neck and facial pain and ongoing tension, and headaches around the eyes, midface and temples. All of these patients had anterior teeth that coupled or nearly coupled, demonstrated relatively normal occlusal relations. (Figures 1a, 1b & 1c), and presented with minimal or no Temporomandibular Joint structural breakdown.
__with_adequate_anterior_ov.jpeg)


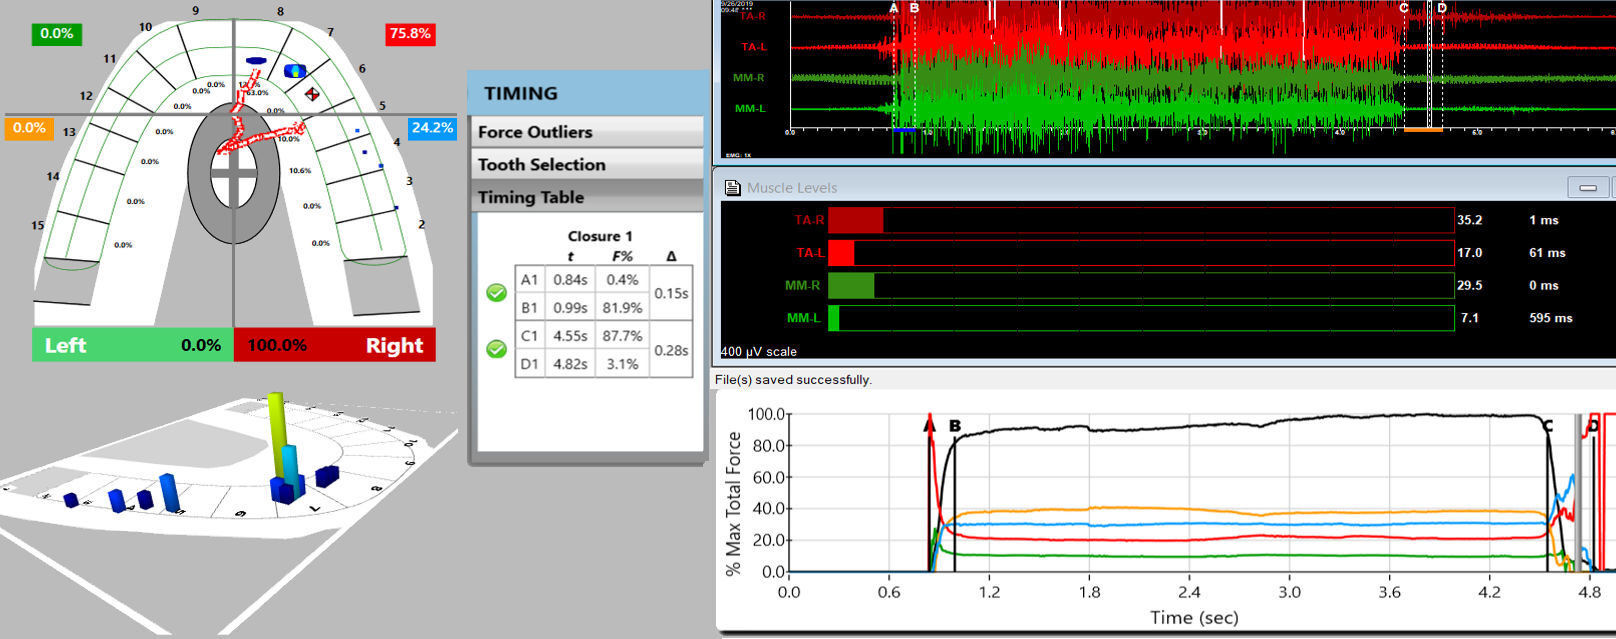
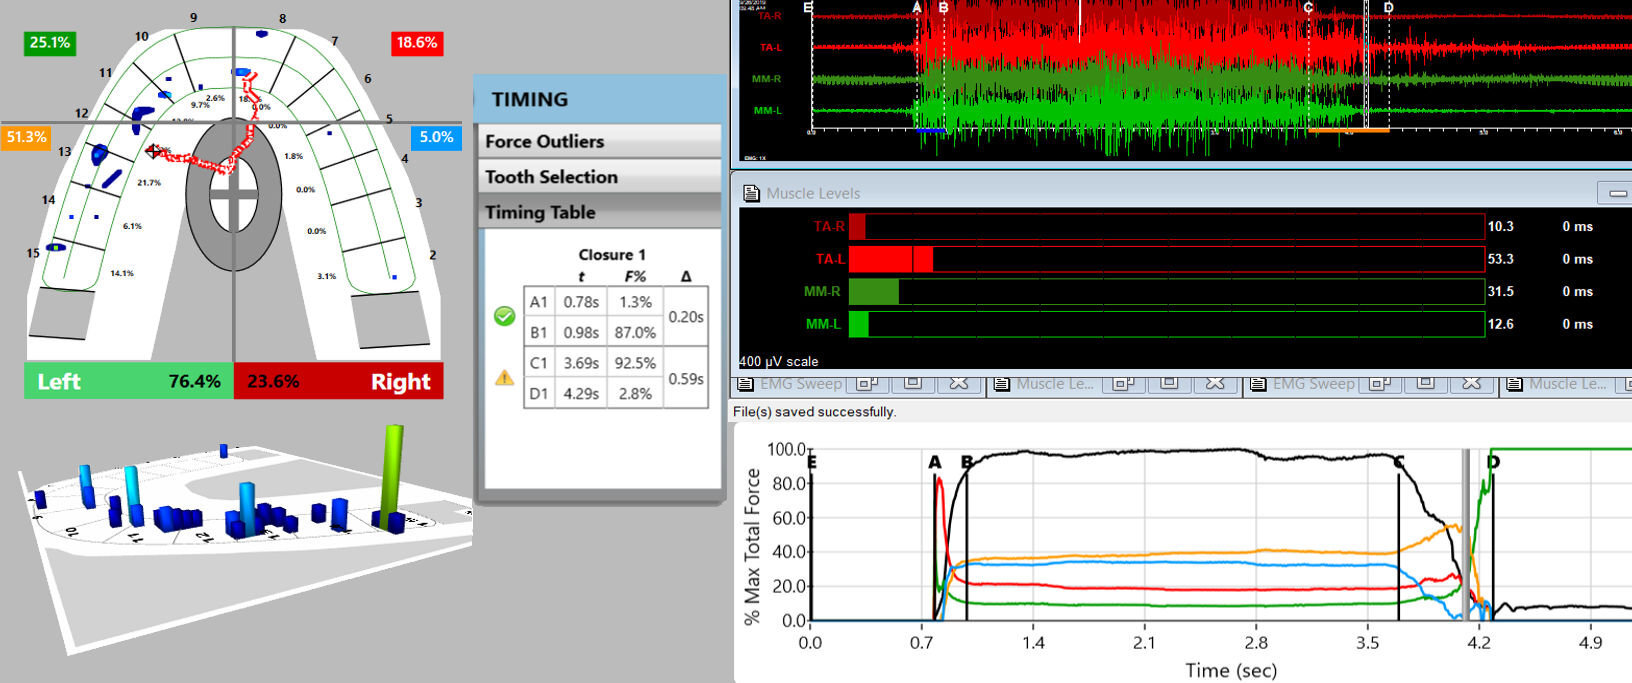
Since the 31 patients were also primary muscular TMD patients, they were diagnosed with the T-Scan 10/BioEMG III synchronized technologies (Tekscan, Inc. South Boston, MA, USA; Bioresearch Associates, Inc. Milwaukee, WI, USA), Figures 2a and 2b. The process follows a sequence of having each patient close firmly into their Maximum Intercuspal Position (MIP), hold their teeth together inter-cuspated for 1-3 seconds, and then to commence a right or left excursion until only anterior teeth were in contact. This specific recording method insured that only high quality Disclusion Time and EMG data were obtained from each TN patient.19 All pre-ICAGD coronoplasty Disclusion Times values and excursive electromyography levels were recorded for comparison to each individual TN patient’s post ICAGD.


Disclusion Time and EMG levels, detected in follow up recordings made on Day 1, at 1 week and 1 month post ICAGD.
Also, each TN patient filled out a self-assessment Trigeminal Neuralgia questionnaire (Table 1). They self-reported their emotional state with the Beck Depression Inventory-II, they answered questions related to Pain Intensity, Pain Frequency, Functional Restrictions, and Frequency of Symptoms to assess the physical limitations of their TN condition.
Subjects also completed the Patient Health Questionnaire 15 (PHQ 15) to determine if they exhibited any Somatic Symptom Disorder (SSD) prior to treatment. The 31 TN patients were fully informed they were to receive ICAGD, and have their enamel adjusted and polished, guided by the T-Scan 10/BioEMG III synchronization.
Next the ICAGD definitive occlusal adjustments were accomplished as previously described8–15 and summarized here. The TN patient’s teeth were air dried. They were then asked to close into their Maximum Intercuspal Position (MIP) with articulating paper (Bausch, Arti-Fol® blue 8μ, Germany) interposed between their teeth, and then to commence a right mandibular excursion out to the edges of their canine teeth, then slide back into MIP, and then make a left mandibular excursion out to the edges of the left side canine teeth, and back into MIP (Figure 3a).
The pre-treatment T-Scan/BioEMG recordings (See Figures 2a and 2b) guided the clinician to adjust specific ink patterns on the occlusal surfaces as the patient moved in and out of MIP excursively. Definitive corrections were made on one side of the mouth using pear-shaped finishing burs (Mani Dia-Burs, Japan ISO no-237/021), to all the excursive frictional contacts located on inclined planes and on the buccal and lingual aspects of the molar and premolar buccal cusps (Figure 3a), leaving the central fossa, cusp tip, and the marginal ridge contact points intact (Figure 3b). These same molar and premolar excursive contacts were then eliminated on all involved surfaces on the opposite side of the mouth.


ICAGD was considered completed when all Class I, II, and III lateral posterior excursive interferences were visually absent, disclusion of all posterior teeth in the right and left excursions was verified and with the patient producing easier and faster lateral movements than pre-ICAGD. The remaining habitual closure contacts were located on cusp tips, fossae, and marginal ridges only (Figure 3b).
When only solid areas of contact in MIP remained and the T-Scan Center of Force trajectory rested near the T-Scan arch-half midline (indicating near equal right side-left side occlusal force arch half percentages), and with the habitual closure adjustments were completed, new excursive recordings were obtained to verify the Disclusion Times had been reduced to < 0.5 seconds in each excursion. Any remaining prolonged excursive contacts were adjusted until each excursion’s Disclusion Time was less than 0.5 seconds (Figures 4a and b). At 1 month post ICAGD, new habitual closure into MIP and excursive T-Scan 10/BioEMG III recordings were each excursion’s Disclusion Time was less than 0.5 seconds (Figures 4a and b).At 1 month post ICAGD, new habitual closure into MIP and excursive T-Scan 10/BioEMG III recordings were made, which guided further but minor, closure and excursive adjustments. At each recall, the TN patients filled out new TN symptom, Functional Restriction, PHQ 15, and BDI-II questionnaires, reflective of changes/no changes to their TN condition and their emotional well-being from undergoing ICAGD.
Results
The objective of reducing the subjects’ Disclusion Times was clearly met as shown in Table 1. The Disclusion Time reductions were substantial and statistically significant for every subject in the TN group immediately after treatment, which further significantly reduced at 1-month post ICAGD (p < 0.00001).
The analysis of the Patient Health Questionnaire 15 data (Table 2) revealed that a low level of Somatic Symptom Disorder (SSD) was indicated for the group’s mean scores prior to treatment.
However, the mean scores were significantly reduced to minimal levels immediately post treatment and were significantly lower 1-month post treatment. No subject’s score indicated a medium level of SSD disorder (> 10) at any point in this study, and no subject’s score remained above 4 (low level SSD) post treatment. As such, Somatic Symptom Disorder was not present at any time within this group of 31 TN subjects.
Although the mean value of the BDI-II scores indicated the TN group taken as a whole, exhibited severe depression prior to treatment, with a mean score of 23.7 (+/- 2.07) out of a maximum of 63, all of the post treatment BDI-II scores immediately reverted to normal emotional levels (Table 3). This supports the contention that depression is secondary to physically painful conditions.
The mean Pain Intensity score for the group was 21.2 (+/- 5.35) out of a possible maximum of 48, or the equivalent of 4.4 on a scale from 0 - 10. A significant reduction in the mean group pain score was found immediately after treatment, and a further significant reduction was measured at 1-month post treatment (Table 3).
The mean Symptom Frequency group score was 15.8 (+/- 3.94) out of a possible maximum of 33, or the equivalent of 4.8 on a scale from 0 - 10. The frequency mean score reduced significantly immediately post treatment, and further reduced significantly at 1-month post treatment (Table 3).
The mean Functional Restriction score was 8.2 (+/- 2.96) out of a maximum of 27, or the equivalent of a score of 3.04 on a scale from 0 - 10. Immediately post treatment the score dropped significantly, and dropped again significantly at 1-month post treatment (Table 3).
The group’s mean Frequency of Pain prior to treatment was 9.6 (+/- 4.30) out of a possible maximum of 30, or the equivalent of 3.2 on a scale from 0 - 10. A significant reduction in the frequency of pain was reported immediately post treatment, to the extent that no further significant reduction was reported (or apparently needed). See Table 3.
Due to the complexity of the EMG data in this study with four muscles active at three different points in the recording sequence, and at three different times of observation, the analysis was applied to the mean activity of all four muscles as one group, because no single muscle can function alone as all activities require group contractions. At point “C,” defined as the starting point of any lateral excursion from maximum intercuspation (MIP), no significant increase was found between the mean pre-treatment value and the immediate post-treatment mean (Table 4). However, an increase in the point C mean EMG activity was significant at one month post treatment (p < 0.00001). See Table 4.
At point “D,” defined as the 1st time moment when all posterior teeth are completely discluded and only anterior teeth are in contact during a lateral excursion made from Maximum Intercuspation (beginning at “C”, then going either left or right), a significant increase in EMG activity was found between the mean pre-treatment value and the immediate post-treatment mean (p < 0.00512). Although the increase was maintained, no additional significant increase in the mean EMG activity at D was found at the one-month post-treatment follow-up (Table 4).
The mean EMG activity at MIP increased significantly and quite dramatically from the pretreatment levels in the immediate post-treatment recordings (p < 0.00001). At one-month post-treatment, the mean EMG activity level of the group retreated significantly (p < 0.01328), but the mean activity levels still maintained significant increases compared to the pre-treatment levels (p < 0.00001). These changes indicated the TN groups’ muscle strength while holding their teeth in MIP improved after the occlusal treatment (Table 4).
Discussion
The Results of this Trigeminal Neuralgia study corroborate the findings of the earlier ICAGD/DTR Trigeminal Neuralgia study7 and the TN case report.3 Significant TN symptom improvements were reported following ICAGD, along with other TMD symptom improvements. This study tracked Trigeminal Neuralgia pain intensity and frequency, which began improving within one week after ICAGD was rendered and which continued to improve over the next month’s observation. An example of the overall TN subjects’ improvements was detected by the increased “C time-point” muscle activity levels. This physiologic response resulted post-ICAGD because the subjects’ teeth fit together far easier and made contact more simultaneously (post-ICAGD the Occlusion Time shortens), which allowd all opposing intercuspating teeth to compress each other more evenly and more simultaneously into their PDLs. This in turn makes for more muscle activation in MIP. These EMG results are consistent with what has been reported when Botox has been employed with TN patients.20 But importantly with ICAGD, no toxin-induced muscle paralysis was needed, no problematic injection side effects occurred (facial asymmetry, headaches, and hematoma),20 and both pain resolution and improved muscle contractile capability resulted physiologically. Further, Botox is metabolized away. Conversely, ICAGD resolved TN in these 31 subjects in 1 month and requires minimal future occlusal intervention to maintain symptom resolution.3,7
A unique finding in the study was a small, but significant increase in the mean microvolts produced at “D.” This increase suggests that the end point of the excursion when only the anterior teeth were in contact was either more stable or more comfortable to the patients. Comfortable contacts elicit more intense contractions than less comfortable contacts in MIP and it is likely that stable and comfortable end points may have the same effect.
Importantly, the results of this pilot study directly contradict previous claims that Trigeminal Neuralgia is not occlusally related. In this ICAGD-treated TN patient pool, Trigeminal Neuralgia intensity and frequency significantly reduced immediately, and further reduced one month after their long Disclusion Times were shortened to within high tolerance Disclusion Times (Table 3). This finding suggests that posterior excursive occlusal contacts of prolonged duration (Disclusion Time > 0.5 seconds), when patients rub or clench their posterior teeth together, neurologically stimulates excessive electrical dental neural activity that can induce the “shock-like symptoms” that appear as Trigeminal Neuralgia episodes.
Of note is the fact that none of the 31 subjects were diagnosed with Trigeminal nerve neurovascular compression via MRI, but the whole group markedly responded to ICAGD treatment. This suggests that dental occlusion is important in cases without any neuro-vascular compression. Further, the occlusion may be the most significant TN etiologic factor regardless of whether neurovascular compression is present, since no MRI exams were used to show neurovascular compression was present in any of these 31 TN subjects. ICAGD removed the occlusal surface friction from the subject’s mandibular excursions to very high-precision numerical tolerance (DT < 0.5 seconds). This occlusal change eliminated the posterior tooth engagement, which then interrupted the excessive amounts of tooth initiated electrical output that stimulated TN symptom episodes. These physiologic changes were neurologically mediated within the Central Nervous System17 because the time-duration and volume of posterior teeth pulpal nerve fiber flexures and PDL nerve fiber compressions were both drastically reduced by ICAGD. Therefore short posterior disclusion in ≤ 0.5 seconds8–16 greatly reduced the frequency and seriousness of the Trigeminal Neuralgia symptoms.
Limitations
Although the subject group showed definitive Trigeminal Neuralgia improvements this study’s limitations were; 1) that there were a relatively small number of subjects (31 subjects), 2) there were no control subjects to compare the treated subjects’ outcomes against, and 3) the follow up was short at only one month. However, the use of a TN Habits questionnaire helped overcome these limitations, as did the highly significant p values (many of the assessed physical and emotional conditions had p values < 0.00001) after treatment indicating the marked degree of symptom improvements among these TN subjects.
Conclusions
In this 31-patient pool, long Disclusion Time and excursive occlusal contacts were the primary etiologic factors for Trigeminal Neuralgia symptom episodes. ICAGD and DTR treatment positively lessened Trigeminal Neuralgia symptom frequency and intensity, indicating that an interrelationship exists between occlusion and Trigeminal Neuralgia physiologically. Tooth-borne Trigeminal Nerve CNS inputs from excursively contacting teeth contributed to the electrical shock-like pains from Trigeminal Neuralgia. Once removed via ICAGD, Trigeminal Neuralgia symptoms markedly resolved. A Trigeminal Neuralgia/Randomized Clinical Trial ICAGD study, could further reveal occlusion’s primary role in Trigeminal Neuralgia
Potential Conflict of Interest Statement
The 3rd author (R.B.K) is a consultant to Tekscan, Inc., but receives no monetary or other gain from the sale of product.
The 4th author (J.R.) is the Chairman of the Board of Directors of BioResearch Associates, Inc. and receives no commission from the sales of any products.