


Introduction
The T-Scan systems have always been manufactured to record and report relative occlusal forces and were never designed to quantify absolute force in engineering units.1 T-Scan reports relative occlusal forces levels as a percentage of the maximum occlusal force obtained within a given T-Scan recording. By measuring relative occlusal force, T-Scan detects whether an occlusal force on one set of contacting teeth is greater, equal to, or less than the occlusal forces occurring on other contacting teeth all throughout the dental arches.1 Relative force can diagnose high occlusal force concentrations present in one area of the occlusion while simultaneously diagnosing where there is little, moderate, or no occlusal force in other areas of the same occlusion.1 And, detected relative occlusal force variances can be employed to precisely balance an unbalanced occlusion with time-based and force-based occlusal adjustments.1 T-Scan relative force reproduction studies have been performed since the inception of T-Scan I in 1987,2,3 which included six different T-Scan systems (T-Scan I, II, III, 7, 8, 9, 10, Tekscan Inc., S. Boston, MA USA), and five sensor generations, beginning with T-Scan I epoxy matrix sensors up to and including the T-Scan 10 Novus High Definition (HD) flexible Mylar-encased printed circuit sensors (Novus HD sensor, Tekscan Inc., S. Boston, MA, USA). See Figure 1.4–20
__t-scan_i_epoxy__t-scan_ii_red_mylar__.jpeg)
Different authors studied the T-Scan I epoxy sensors, reporting variable results mostly related to sensor inflexibility and thickness.4–9 Others studied T-Scan II, III, and the HD sensor generations,10–19 but importantly, T-Scan I epoxy sensors were the first occlusal indicator capable of recording 16 levels of relative occlusal force across 3 seconds of real-time,5 representing a major innovation in occlusal function data acquisition. Although T-Scan I, II, and III sensors are no longer manufactured and were structurally different from today’s T-Scan 10 Novus HD sensors,19,20 these early T-Scan sensor generations introduced Dental Medicine into the era of Computerized Occlusal Analysis and spawned the science of Measured Digital Occlusion.
The uncrushed T-Scan 10 Novus HD sensor is a 100-um thin, flexible, electrically conductive circuit embedded in a Mylar substrate. The sensor in real-time, converts changing applied occlusal contact loads into variable electrical output voltages (Digital Output; DO) as different levels of occlusal contact forces compress the sensor surfaces together.20 The magnitude of the relative occlusal loads is measured as differing output voltages, while the force locations are mapped by 2200 individual sensing force measurers (known as sensels) that are aligned in an arch-shaped grid pattern.20
Harty et al., in 2006 performed the first T-Scan III High Definition (HD) sensor design bench force reproduction study.10 The HD sensor had 33% increased active recording area and 50% decreased non-recording area compared to earlier T-Scan I, II and III sensor designs, by more closely packing together the 1.61 mm2 sensel force units.10 Harty reported the HD sensor repeatedly measured multiple force levels in multiple locations on the same sensor for up to 20 crushes, after four pre-conditioning intercuspated crushes.10 And seven previous time-based T-Scan occlusal adjustment treatment studies have shown that the HD sensor can accurately quantify closure contact time-sequences and excursive movement contact time durations.13,17,21–25
Throughout T-Scan’s hardware, software, and sensor evolution, the T-Scan has been repeatedly evaluated and verified for its’ force and time measurement reporting capabilities,4–19 that a recent systematic review determined definitively exceeded those of conventional, non-digital occlusal indicators.20 However, most T-Scan sensor force reproduction studies tested the sensors in different ways from how T-Scan is clinically employed, without testing the force and timing data that is used clinically to diagnose patients or make computer-guided occlusal adjustments. A few studies used low end average human bite force (≤ 50 N), that minimally activated the recording sensel response.16,19 One such analysis repeatedly compressed 5 different Novus HD sensors between titanium casts, who’s output demonstrated high intraclass correlation with a universal testing machine (ICC = 0.963). The authors stated there was “excellent” T-Scan Novus reliability and repeatability when measuring occlusal forces.19 Other bench studies tested single point sensor loading with dental burs,17 or loaded sensors onto single teeth or flat pucks.15 And a few authors did not even connect the sensor to the recording handle during testing, and did not record nor evaluate any occlusal contact force data.12,14,18
Koos in 2010 using human subjects and handholding the Evolution recording handle (T-Scan III Evolution, Tekscan Inc., S. Boston, MA USA), made 5 successive intercuspations with a single T-Scan III HD sensor per subject, and then made 5 successive recordings on the same subject after changing sensors between recordings, gathering actual patient occlusal data that was statistically analyzed. The authors reported the HD sensor demonstrated 95% force reproduction between and within subjects, while depicting the critical nature of the occlusal force distribution.11 Only Koos handheld the recording handle and sensor and recorded clinical data from patients,11,13 while all other T-Scan sensor force reproducibility studies used bench recording environments that eliminated handholding as a variable.
Proper intraoral T-Scan recording technique has been well described and constitutes a T-Scan user skill set that must be learned to effectively use T-Scan chairside.1 Handholding introduces recording variables than influence whether good quality (or non-useable) T-Scan data is obtained from patients. These are: the doctor’s sensor control as the patient occludes or excurses across it, poor sensor placement that misses capturing all occluding units, obtaining false positive data from sensor fold up, touching teeth inadvertently, or rubbing the sensor against the cheeks or ramus, and using a too high (or too low) recording Sensitivity.
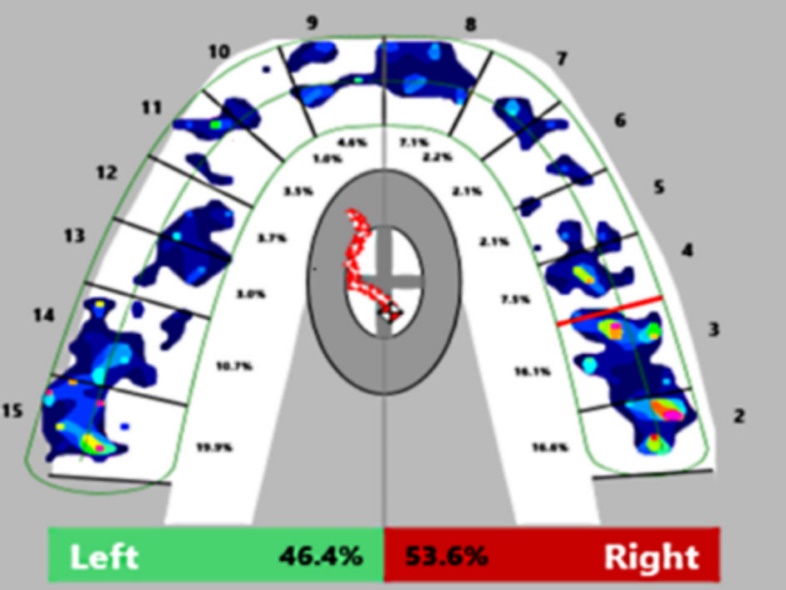
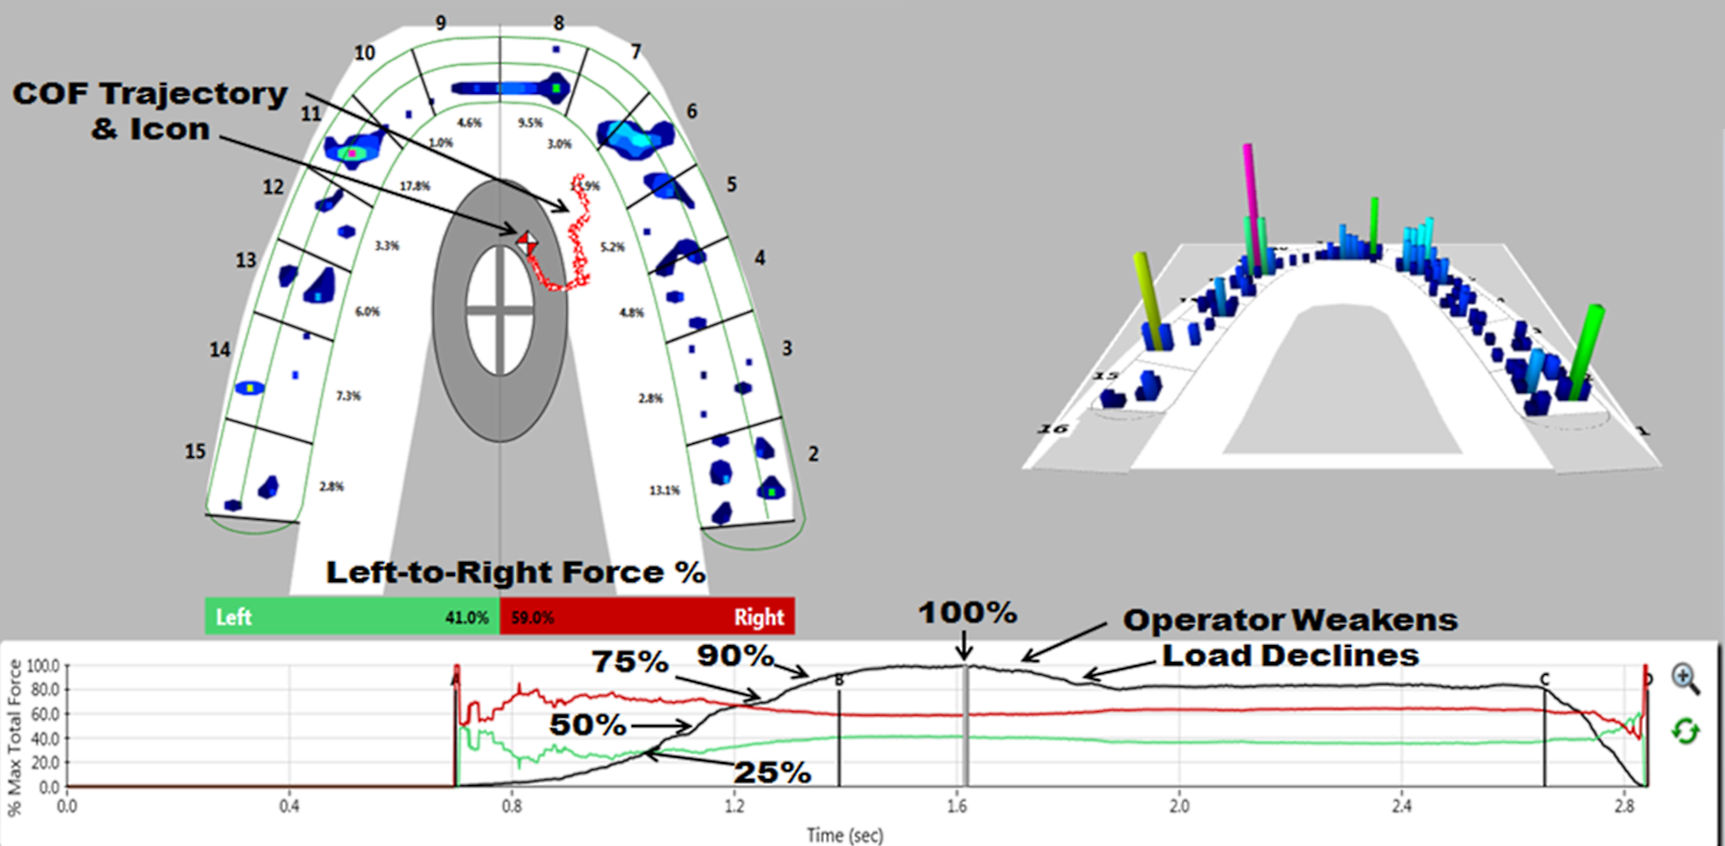
One important occlusal force distribution parameter that T-Scan measures is the left side-to-right side force percentage imbalance, that changes and evolves during an intercuspation from early in the closure when only a few teeth occlude, to the middle when most teeth have begun to occlude, to later when all teeth occlude and higher forces are generated. The cycle ends at maximum force intercuspation with all teeth completely intercuspated. The left side-to-right side force percentage imbalance is found at the bottom border of the 2D ForceView window, and is tracked across the intercuspation’s elapsed time by positional changes in the Center of Force Icon from 0% force (no contact) to 100% maximum force (complete interdigitation). See Figure 2.

This T-Scan output data illustrates the changing bilateral occlusal imbalance present during closure, and has clinical implications in many disciplines related to overall occlusal health.21–27 For example, a few orthodontic studies using T-Scan after tooth movement and retention, reported many subjects displayed marked left side-to-right side percentage imbalances that were accompanied by occlusal discomfort symptoms, despite many subjects being finished as Class I.26,27
As no prior bench T-Scan force reproduction study used patient function T-Scan clinical output data as the outcome measure, the Purpose of this study was to record the left side-to-right side force percentage imbalance of articulated casts with multiple T-Scan sensors being loaded under controlled conditions,28 to be compared to manual cast loading using a known and validated handheld recording technique.1,20
Material and Methods
A power analysis was performed to estimate the required samples that would compare the consistency of the two recording methods. Allowing for a type I error acceptable at 5% (α = 0.05), a power (1 – β) of 80% (0.80) was selected to test the sample mean and standard deviation from one pre-test iteration (right % = 56.1 +/- 4.68). A minimum of 22 samples per recording method (44 total trials) were required, which could involve 2 sensors per recording method, each being recorded 11 times. This minimum calculation was increased substantially by using 10 sensors, recorded 10 times per individual sensor, that reported 5 differing force level output measures, to total 500 trials per recording method. This volume of recording trials would determine a more precise degree of sensor force reproduction capability.
Progressive Controlled Load Recording Method
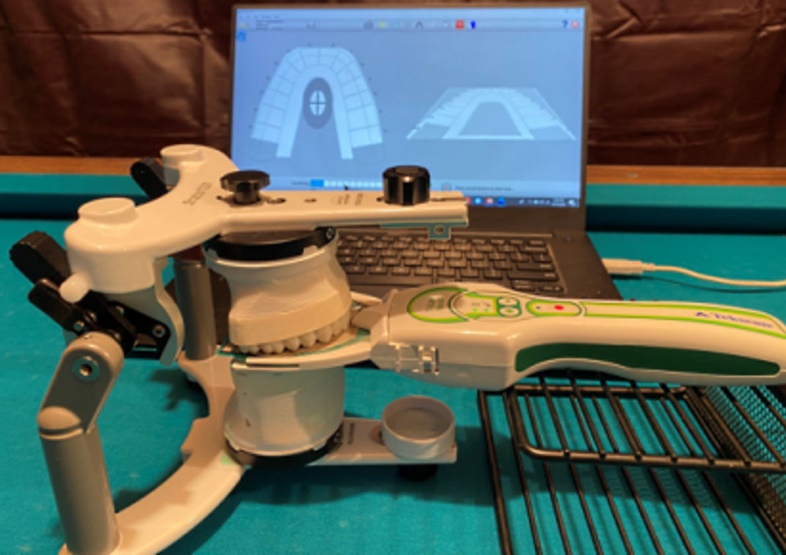
A Stratos® 100 articulator (#7503000696, Ivoclar Vivadent, Inc., Amherst, NY, USA) was placed on extremely stable and level surface (slate billiard table) in front of a T-Scan HD sensor locked in the Novus recording handpiece that sat stabile on a metallic nest, with a HD sensor located just above the mandibular Zirconia cast made from a patient’s natural occlusion. The casts were unadjusted to improve the likelihood that the occlusion was unbalanced.
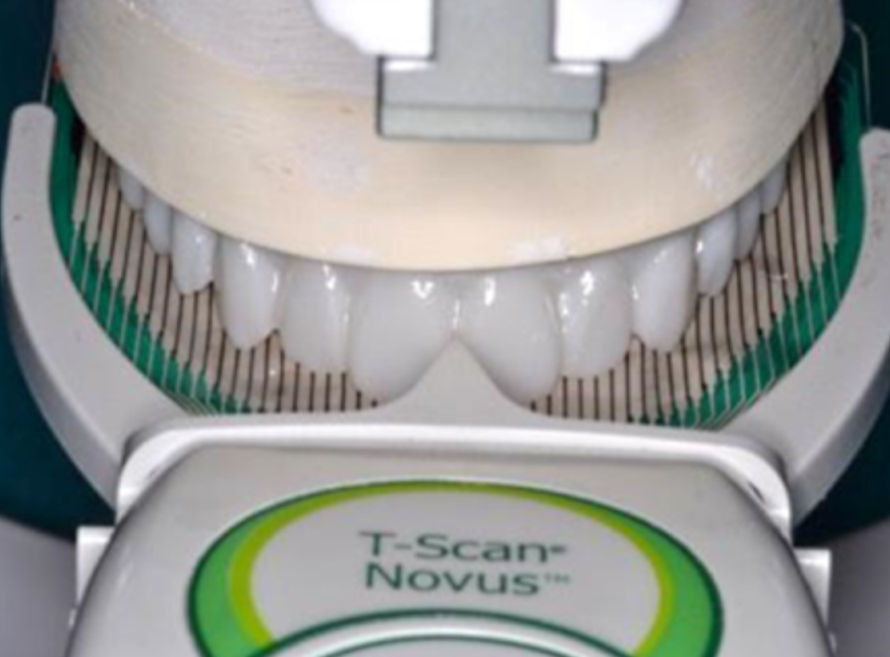
The articulator was then gently closed to rest the upper cast on the sensor surface, with the Sensor Support incisor prong resting in the mid-central incisor facial embrasure (as is done intraorally). Next, the sensor’s mediolateral position was checked relative to all upper and lower occluding units before each recording (also performed intraorally). If need be, the sensor was slightly adjusted mediolaterally to encase all contacting units (Figures 3A & 3B).


Setting sensitivity and conditioning the sensors
To set the correct recording Sensitivity (the sensor’s amount of electrical charge that controls its responsiveness to loading) before gathering actual study data, four 10 1b. weights were placed all at once onto the articulator’s upper member (described in detail below), after which the electronic charge within the sensor was adjusted to report only 1-3 pink sensels with all 40 lbs. (178 Newtons) loading the casts/sensor complex.
Setting the Sensitivity to report 1-3 pink sensels is necessary because pink sensels contain an unknown amount of electronic Digital Output that represents the upper limit of contact forces. Limiting pink sensels to 1-3 at maximum applied load (40 lbs.) ensured the sensor’s output response would report the full 256 relative force spectrum when the full study load was applied, without electronically oversaturating many sensels. To precondition the sensor, the four 10 lb. weights were removed and replaced 3 more times, crimping the sensor matrix around the cuspal anatomy, which prior studies have shown results in near-linear T-Scan force reproduction.10,15,20 Removing and replacing all 4 weights simulated the four, pre-conditioning sensor intercuspations that all patients perform before recording intraoral occlusal data.
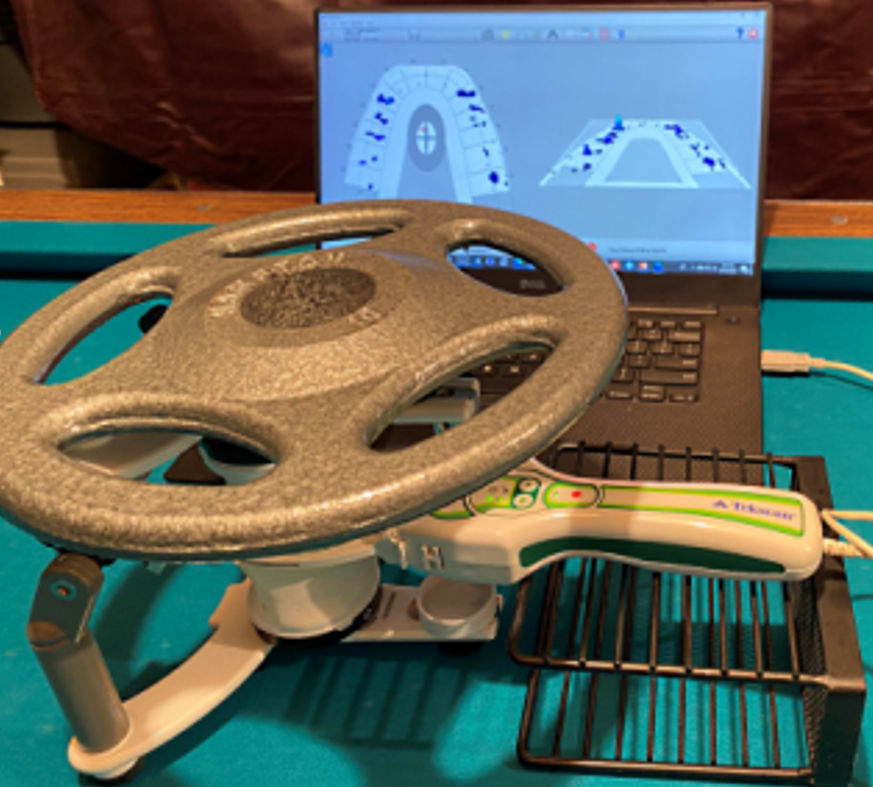
All progressive load recordings were initiated from the T-Scan desktop to not disturb the test apparatus. Then, the single operator loaded one 10 lb. plate onto the articulator’s mounting plate set screw, the incisal pin set screw, and onto 2 flat regions of the upper member bilaterally located above each mechanical condyle’s assembly. These flat engagement points provided stability when three more weights were concentrically added (Figures 4A & 4B).


After each plate was loaded, and before the next plate was loaded, the operator visually determined on the T-Scan desktop when the applied load was accommodated by the casts/sensor complex. This occurred when the 3D column data stopped rising, and the COF icon’s location stabilized. The next plate was then placed until the data stabilized again, with each successive plate placed directly over the center hole of the previous plate. The recording was complete when the four plate T-Scan data stabilized with a full spectrum of visible forces. The recording was then terminated, the weight plates removed, and the articulator opened out of contact for the sensor to relax and rebound for 3 minutes before the next loading cycle (Figure 5).
_illustrate.jpg)
Each successive recording made with the same sensor followed the same protocol, being repeated 10 times/individual sensor to yield 100 full spectrum, progressive controlled load recordings from 10 sensors. Each recording was played back to isolate the left side-to-right side force percentage imbalance at five different force levels within the load cycle (at 25%, 50%, 75%, 90%, and 100% maximum force).
Combining the 10 trials at the 5 force levels from each controlled load recording yielded 50 controlled load left side-to-right side force percentage imbalance data points per sensor (Table 1). Combining all 10 controlled load sensors’ 50 left-side to right-side force percentage imbalances, yielded 500 total left side-to-right side percentage imbalance data points (Table 2).
Handheld Loading Recording Method
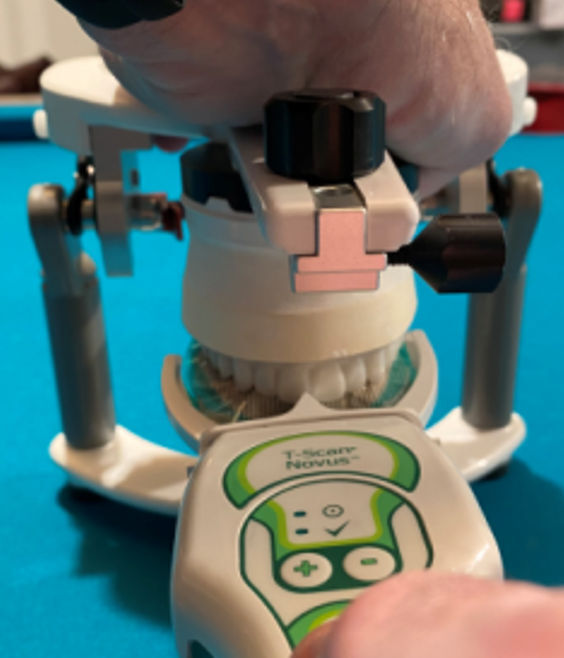
Practice was required to develop a manual technique that simulated the loading of weight plates from above the mounting plate set screw, after verifying the sensor’s orientation to all occluding units. The left palm was placed over the mounting plate set screw while the left fingers engaged the back of the upper member that together, directed the manual load downward as much as possible, with both vertical and posterior loads applied because of the orientation of the left arm to the upper member. The operator’s right hand held the T-Scan Sensor Support against the upper central incisor facial embrasure, and initiated the recording with the Novus handpiece, just before the left hand and arm compressed the upper member of the articulator onto the casts/sensor complex, with a correct preset Sensitivity that with enough applied manual load, generated a full spectrum closure cycle data set with only 1 to 3 pink sensels (Figures 6A & 6B). Similar to the controlled loading protocol, four pre-conditioning manual closures were performed on each sensor, to crimp the sensor around the cuspal anatomy before study data was gathered.

The recording was terminated with the handpiece stop button when a full spectrum data set stabilized visibly on the desktop at maximum manual loading. The articulator was opened out of cast contact, the sensor was withdrawn to somewhat relax and rebound, while the operator rested for 3 minutes of muscle recovery before performing the next handheld load cycle.
Nine handheld recordings that did not capture the full force spectrum (from ineffective manual loading) were discarded and replaced with nine additional full spectrum trials. A representative handheld loading cycle can be seen in Figure 7.
_illustrated_at_10.jpg)
Ten handheld recordings per individual sensor were made with the same handled protocol to yield 100 full spectrum manual closure recordings from 10 sensors. Each recording was played back to determine the left side-to-right side force percentage imbalances at the same five force levels used with the controlled loading data. Combining the 10 trials at the 5 force levels from each manual load recording, yielded 50 left side-to-right side force percentage imbalance data points per sensor.
Combining all 10 manual load sensors’ 50 left side-to-right side force percentage imbalances, yielded 500 total left side-to-right side percentage imbalance data points. Grand mean percentage imbalances at each force level were calculated from all data points of each method, along with their standard deviations, which were used to calculate the Coefficients of Variation (Tables 2 & 3).
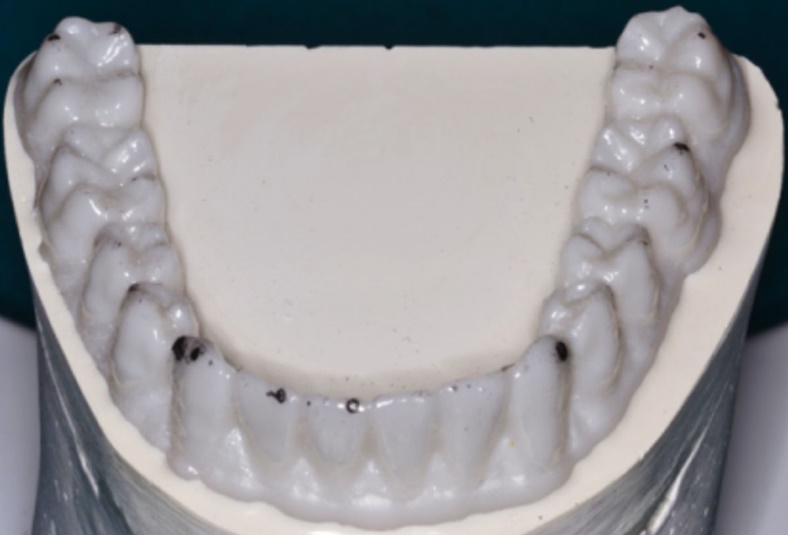
Lastly, the casts were tapped together with thin articulating paper interposed, to mark the contacts that contributed to the left-side to right-side percentage imbalances (Accufilm red/black, 23 micron, Parkell Inc., Farmingdale, NY, USA). See Figures 8A & 8B.


Results
The Coefficient of Variation described the dispersion of the force imbalance values. The lower the coefficient of the combined sensor means, the more consistent were the values. Both loading methods and sensor groups demonstrated low coefficients of variation (handheld mean = 0.062; control mean = 0.052), with the handheld loading being 19% more variable. At four of the five force levels (50%, 75%, 90%, 100% total force) the two methods agreed that the left-side force percentages were always less than the right-side force percentages. However, at 25%, the controlled load method reported the left side force was greater (51.02% left – 48.98% right), while handheld loading reported lower left side force (47.43% left – 52.57% right).
A 2nd comparative analysis was made between the progressions of the means for both methods using the non-parametric Sign Test (Table 4). While progressing through the increasing loads, the left side force percentage continuously decreased while the right side continuously increased for both methods. Although the numerical values did vary by method, after analysis, the difference between methods was not significant (p = 0.3173). As the amount of applied load increased, the imbalance also increased (worsened), which was likely due to increasing overall contact area.
Discussion
The results of this HD sensor bench study corroborate the findings of Koos, who handheld HD sensors when recording on patients, and obtained highly reproduced occlusal force distributions.11 Further, this study’s results were similar to Harty’s articulated cast analysis, where differing T-Scan force levels were repeated in multiple locations on the HD sensor for 20 instances.10 Although this study reported on the mean left side and right side force percentages, the low coefficients of variation seen with both recording methods indicated that the measured force distribution reproduction was highly consistent.
Isolating the left-side to right-side force percentage imbalances at five differing applied force level moments within closure cycles could not have been accomplished with traditional occlusal indicators. Non-digital occlusal indicators cannot accurately determine and report good or poor occlusal balance (≥ 50% +/- 10%), specifically because they quantify nothing occlusal,20 their appearance characteristics do not predict force levels,29 and studies show the markings are poorly and subjectively analyzed (Figures 8A & 8B).30,31 In contrast, the Novus HD flexible printed circuit digital sensor can repeatedly measure, segment and report unique occlusal contact force and timing data from between contacting teeth. Statistical treatment of 1000 individual imbalances (10 recordings/ sensor x 5 force level imbalances/recording x 10 sensors/ method x 2 methods) indicated there was no significant difference between the two methods and determined that multiple HD Novus sensors gathered consistent occlusal force distributions at each force level.
Recording T-Scan data intraorally involves handholding the recording handpiece while a patient makes intercuspated closures or excursive movements. This was simulated by hand-holding the sensor support against the cast central incisor embrasure while the articulator’s upper member was manually compressed onto the lower cast. Despite the potential variability in manually positioning the sensor, managing the handpiece during articulator motion, and manually compressing the articulator, the handheld data exhibited very low variability (handheld coefficient of variation = 0.062). This was because five known and validated recording procedures were adapted into this bench analysis1,10,11,15,21–28; 1) setting the proper sensitivity to match the applied load, 2) preconditioning the sensor four times, 3) engaging the central incisor embrasure, 4) ensuring the sensor captured all occluding units and 5) observing the desktop while increasing contact forces rose and stabilized. These recording principles ensured repetitive occlusal force data sets were recorded from the two setups accurately and consistently, thereby effectively measuring the left-right occlusal imbalance multiple times. In the five prior bench studies that did not use a reliable recording protocol, the recorded data quality, the statistical results and all of the opinions promulgated regarding the T-Scan system’s performance should be dismissed.12,14,16–18
Interestingly, the weight plate loading demonstrated some variability (control coefficient of variation = 0.052) and was not totally static. The first loaded plate usually induced an initial force increase, that declined as the load was absorbed by the cast/sensor complex (Figure 5). Also, successive plate loading without a physical plate placement guide introduced minor variability of each weight’s orientation to the others, and to where the plates sat on the articulator. An effort was made to place each weight concentrically and in the same location on the upper member during each single progressive load recording. The low coefficient of variation and low standard deviations at each time point (Table 2) indicated that the controlled loading was repetitive despite these variables.
A possible explanation for the reversed force percentage imbalance at 25% total force seen in the controlled loading, is that 25% reflects early light loading of only 44.5 N, which likely did not apply significant compression to the casts/sensor complex. The casts were not yet fully interdigitated and the sensor was not yet overly compressed, allowing for more variable Digital Output from a small number of activated sensels. As the subsequent three 10 lb. plates increased cast/sensor complex compression, deeper cast intercuspation resulted, activating more sensels, which increased the right-side force percentage. The highest left-side to right-side percentage standard deviation and variation was seen at 25% total force, because the low load activated the least number of sensels.
Limitations
One limitation was loading plates without a plate location guide during each controlled load cycle. Another was that handholding the recording handpiece and manually loading the articulator could not be exactly consistently performed recording-to-recording, despite attempting to perform each recording similarly. Increasing the number of trials well beyond what the power analysis suggested, helped to overcome these limitations by reducing the effects of random errors on the means. Neither limitation produced significant differences in the left side-to-right side force percentage imbalance except at 25% of total force, as both sensor groups and recording methods demonstrated low variability.
Conclusions
T-Scan 10 system’s left-side to right-side force percentage imbalance output data was highly repeatable, despite handholding the recording sensor and handpiece, and manually loading articulated casts. HD Novus sensors consistently reproduced the progression of the left-side to right-side occlusal force imbalances at successive intercuspation force levels with low sensor output variations.
Declaration of Interest
The 1st author (RBK) is a consultant to Tekscan, Inc., but receives no monetary or other gain from sales of product. The 2nd author (JR) is Chairman of the Board of Directors for BioResearch Associates, Inc. receives no commission for any sales.
Credit Roles
RB Kerstein participated in the conceptualization, data curation, defining methodology, project administration, visualization and the writing of the original draft. J Radke participated in writing, review, editing and provided statistical analysis.