Loading [Contrib]/a11y/accessibility-menu.js
1.
Thumati P, Thumati RP, Radke J, Kamyszek G. JVA changes from pre to post Disclusion Time Reduction in a group of muscularly symptomatic TMD patients. Adv Dent Tech. Published online February 21, 2022:15-28.
Download all (6)
  • Figure 1. JVA applied to a subject. The headband holds the accelerometers over the TMJs and is connected to the JVA amplifier left and right inputs. The amplifier is connected to a computer USB input running the BioPAK Program (Bioresearch Associates, Inc. Milwaukee, WI USA).
  • Figure 2. Pre-treatment JVA record showing right side medium intensity (20 to 80) late opening vibrations typical of a chronic partial disk displacement with late reduction. The left TMJ appears to be within normal limits as the Total Integral is less than 20.
  • Figure 3. Post treatment JVA record from the same subject as in Figure 2. Although vibrations are still present from the right TMJ, they are reduced to within normal limits and the left TMJ in this subject has remained so.
  • Figure 4. Long disclusion time (2.29 seconds) and very hyperactive right anterior temporalis muscle indicating excess work was occurring between points “C” and “D” in the trace.
  • Figure 5. Shortened disclusion time (0.23 seconds) and much lower activity of the right anterior temporalis muscle between points “C” and “D” in the trace. Note: Some electromagnetic interference was present on the second day affecting the TA-L and MM-R channels.
  • Figure 1A. JVA Flow Chart

Abstract

Objective

Evaluation of TMJ vibrations and range of motion (ROM) in subjects with muscular symptoms of temporomandibular disorders (TMDs) prior to and post Disclusion Time Reduction (DTR) therapy. The null hypothesis stated no change in TMJ vibrations and ROM.

Methods and materials

The ROM and TM joint vibrations of 60 (44 F) subjects diagnosed as primary muscle symptomatic TMDs, but also with mild TMJ pathologies were recorded using Joint Vibration Analysis (JVA) before and after Disclusion Time Reduction therapy. Both physical and emotional symptoms were documented using an accepted Pain Scale, the BDI – II and the PHQ-15. The subjects examined were properly informed and provided consent following the procedures recommended by the World Medical Association’s Helsinki Declaration.

Results

After DTR there was a significant reduction in the group’s mean intensity of the TMJ vibrations and a significant increase in the mean ROM (p < 0.05). The frequency of ten painful symptoms was significantly reduced (p < 0.05), the BDI-II scores were significantly reduced (p < 0.05), the PHQ-15 scores associated with Somatic Symptom Disorders were significantly reduced (p < 0.05) and the group EMG muscle activity was normalized.

Conclusions

The reduced mean TMJ vibration intensity and increased mean ROM indicate improved TMJ function. The symptoms of depression and somatic-like symptoms present within this TMD group were fully relieved post-treatment. Along with muscular pain relief, after disclusion times were reduced, the muscle activity was observed to become more closely balanced.

Introduction

The Joint Vibration Analysis (JVA) system records and analyses the vibrations resulting from internal temporomandibular joint (TMJ) anomalies. It uses accelerometers to accurately measure the amplitude and the frequencies of vibrations emitted from the TMJ’s condyle/disc assembly during cyclic mandibular maximal opening and closing.1 Figure 1 illustrates the JVA technology placed on a patient’s head as it is recording vibrations. JVA correlates with disease state existence 75-94% of the time, (sensitivity), and does not indicate a disease state when there is no disease present 98% of the time, (specificity).2,3 Due to its high specificity, JVA is an excellent screening tool for TMJ internal derangements that assists clinicians in determining if a patient possesses normal or well adapted and stable TM joints. JVA can also be combined with MRI and CBCT to complete a detailed joint structural evaluation before any occlusal therapy is instituted. Most importantly, detected vibrations can reveal TM joint structural deformities because the differences in a vibration’s intensity and frequency content correlate to temporomandibular joint specific structural pathologies.4–10 The amplitude of a given vibration and its waveform pattern indicate the energy associated with a particular internal TM joint dysfunctional event.11 The amount of energy is combined with the frequency content, the range of motion, the location at which the vibration occurs along the patient’s opening or closing pathway, to indicate the most likely stage of disease progression according to the Piper Classification System.12

Figure 1
Figure 1.JVA applied to a subject. The headband holds the accelerometers over the TMJs and is connected to the JVA amplifier left and right inputs. The amplifier is connected to a computer USB input running the BioPAK Program (Bioresearch Associates, Inc. Milwaukee, WI USA).

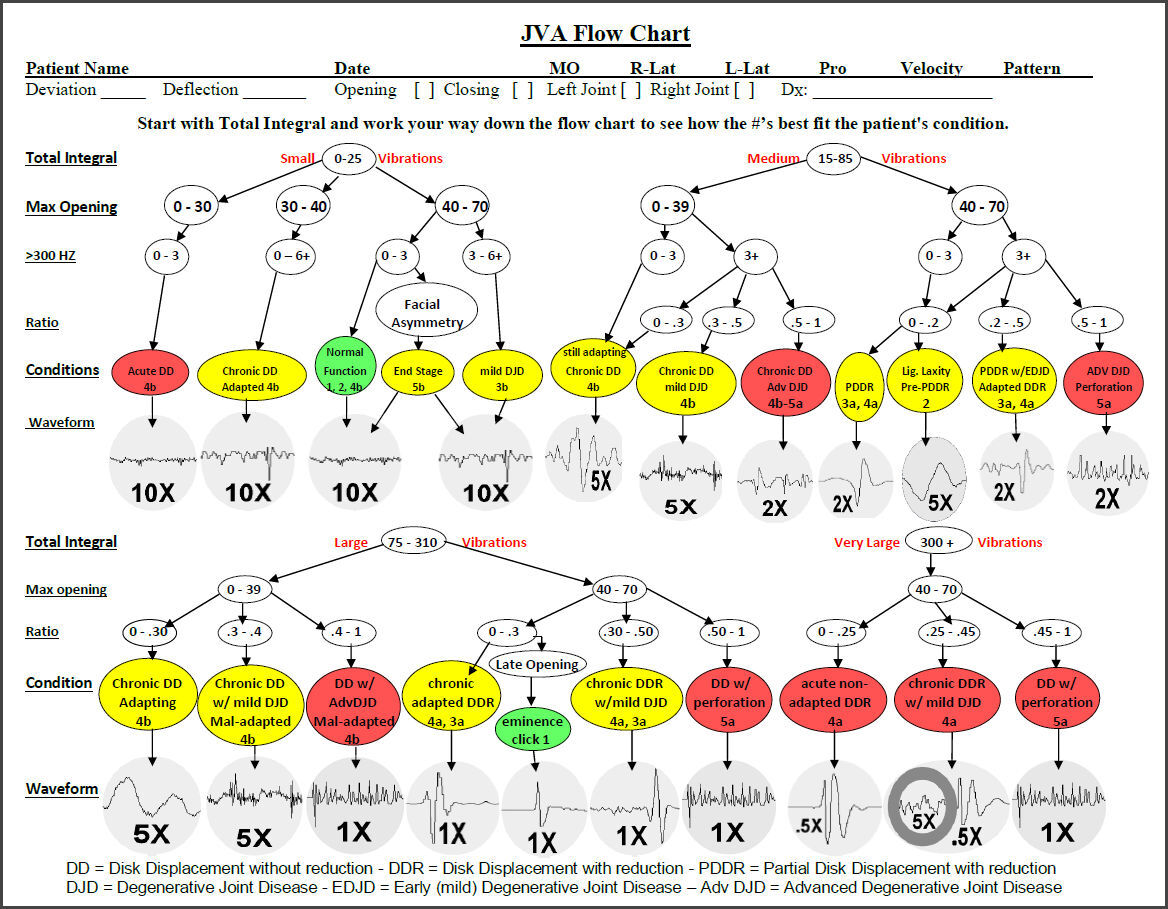
The JVA “Total Integral” integrates the amplitude at each frequency over the entire bandwidth into one number that is analogous to the relative amount of energy in a given waveform. It is the best indicator of overall intensity of a joint sound. It is subsequently divided into 4 parts, small , medium, large and very large intensity in the JVA Flow Chart (See Appendix). The frequency 300 Hertz is used as a reference because the frequencies below 300 Hertz are mostly due to soft-tissue initiated vibrations such as disk displacements and reductions, while those above 300 Hz are more likely due to harder-tissue initiated vibrations appearing only after degenerative changes have occurred within the TMJ.

The basic elements of JVA include measuring the overall intensity of each vibration (Total Integral) and calculating the distribution of vibration frequencies with respect to the reference frequency 300 Hz (< 300 Hz integral, > 300 Hz Integral) from both symptomatic and asymptomatic subjects.5–8 When the ratio of these integrals, (> 300 Hz / < 300 Hz), exceeds 0.3 substantial degenerative disease is present. Correlations have been made between the TMJ vibration characteristics and radiographs, with MRIs as well as with open surgical findings.7–16 The diagnostic accuracy of JVA has also been demonstrated.2,3,8,11,17,18

When the vibration data are combined with the range of motion (ROM) and with the patient’s signs and symptoms a reliable understanding of the current condition of each TMJ is possible.19 When the JVA indicates pathology, it can often suggest whether MRI or CBCT will contribute more information by qualifying the degree of degeneration.14 JVA has been used to evaluate the benefits of treatment20–24 and compared to other measurement devices.25 In one recent study it was concluded that: “The average Total Integral of TMJ vibration decreased significantly with the increasingly pathological state of articular disc,”26 suggesting it is a potential parameter related to chronicity. JVA has more than 30 years of research behind it ranging from comparisons to MRI, comparisons to CBCT and comparisons to surgical findings. It is a 3-minute procedure and can easily be assigned to the staff in a busy dental practice.

Patients with TMDs exhibiting symptoms of limited muscular pains often benefit greatly from Immediate Complete Anterior Guidance Development (ICAGD) coronoplasty.27–30 This procedure is also referred to as Disclusion Time Reduction (DTR) therapy because the procedure uses the disclusion time in lateral excursions as the best indicator of the presence of posterior occlusal interferences to function. This procedure is not chosen when the majority of a patient’s TMD symptoms are located clearly within the temporomandibular joints (TMJs) and the occlusion in not the primary cause of the patient’s condition.

Chronic Occluso-Muscle Disorder (OMD) is a subset of painful Temporomandibular Disorders (TMD) with painful symptoms primarily afflicting the masticatory musculature, whereby the lateral pterygoid is often affected.31–33

Chronic facial pain, temporal headaches, clenching, and grinding of the teeth, morning jaw pain, eye strain, earaches, tooth pain and temperature sensitive teeth, are all commonly reported dysfunctional symptoms.34–36 Patients that are suffering from a masticatory muscle disorder exhibit increased tonicity of the elevator muscles, creating an increased intra-articular pressure in the TM joint. Multiple published studies using the T-Scan computerized occlusal system have shown that muscular symptoms can be resolved with ICAGD.34–45

Objectives

Demonstrate the changes in TMJ vibrations resulting after DTR treatment of muscularly symptomatic TMD subjects. The null hypothesis was no change.

Methods

Inclusion criteria:

  1. Patients having muscular TMD with minimal internal derangements diagnosed with JVA.

  2. Patients having Class 1 (Angle’s Classification) or nearly canine coupling.

Exclusion criteria:

  1. Primary TMJ internal derangements like closed locking, painful disc displacement with or without reduction, condylar avascular necrosis, loss of condylar height, a present tumor within the TMJ, markedly reduced vertical opening or super-erupted and/or mal-positioned 3rd molars.

  2. Anterior open-bite occlusion patients were also excluded because not only could they not undergo ICAGD due to an absence of coupled anterior teeth, but MRI has determined that open-bite occlusion patients often present with serious soft tissue disc displacement events and degenerative TMJ structures.

  3. Any subjects that were acceptable, but did not choose to participate.

Patients presenting in two separate dental practices of two highly trained ICAGD providers, well calibrated to use T-Scan for ICAGD, all demonstrated and reported limited joint noises and chronic painful muscular TMD-like symptoms and were recruited for participation. Potential subjects completed a medical history and a symptom evaluation questionnaire that was used to screen patients for possible study eligibility. Many of the selected subjects had previously experienced splint therapy, OTC pain medications, soft food diets or physical therapy.

Sixty youthful subjects suffering from primary muscular orofacial pain were recruited and agreed to participate (44 F, 16 M) from a student group with a mean age of 21.1 (+/- 1.85) years and an age range of 18 to 24 years. Patient questionnaires surveyed; 1) the frequency of ten painful symptoms (0 = never, 1 = occasionally, 2 = often, 3 = always), 2) the Beck Depression Inventory – II scores and 3) the PHQ-15 used for the evaluation of Somatic Symptom Disorders. Each patient was examined clinically and the T-Scan 10 was used to record their left and right lateral excursive disclusion times (Tekscan, Inc. South Boston, MA USA). This was done together with the BioEMG III (Bioresearch Associates, Inc. Milwaukee, WI USA) to simultaneously record the masseter and anterior temporalis muscle activity associated with the lateral excursive movements. A focus of this study was to record Joint Vibration Analysis (JVA) from all subjects using the BioJVA System (BioResearch Associates, Inc. Milwaukee, WI USA) that objectively detects the extent of any TMJ dysfunction prior to DTR treatment and then to re-assess each subject post-treatment. Subjective data were analyzed with Wilcoxon Signed-Rank test, measured data using Student’s paired t test. Figures 2 & 3.

Figure 2
Figure 2.Pre-treatment JVA record showing right side medium intensity (20 to 80) late opening vibrations typical of a chronic partial disk displacement with late reduction. The left TMJ appears to be within normal limits as the Total Integral is less than 20.
Figure 3
Figure 3.Post treatment JVA record from the same subject as in Figure 2. Although vibrations are still present from the right TMJ, they are reduced to within normal limits and the left TMJ in this subject has remained so.

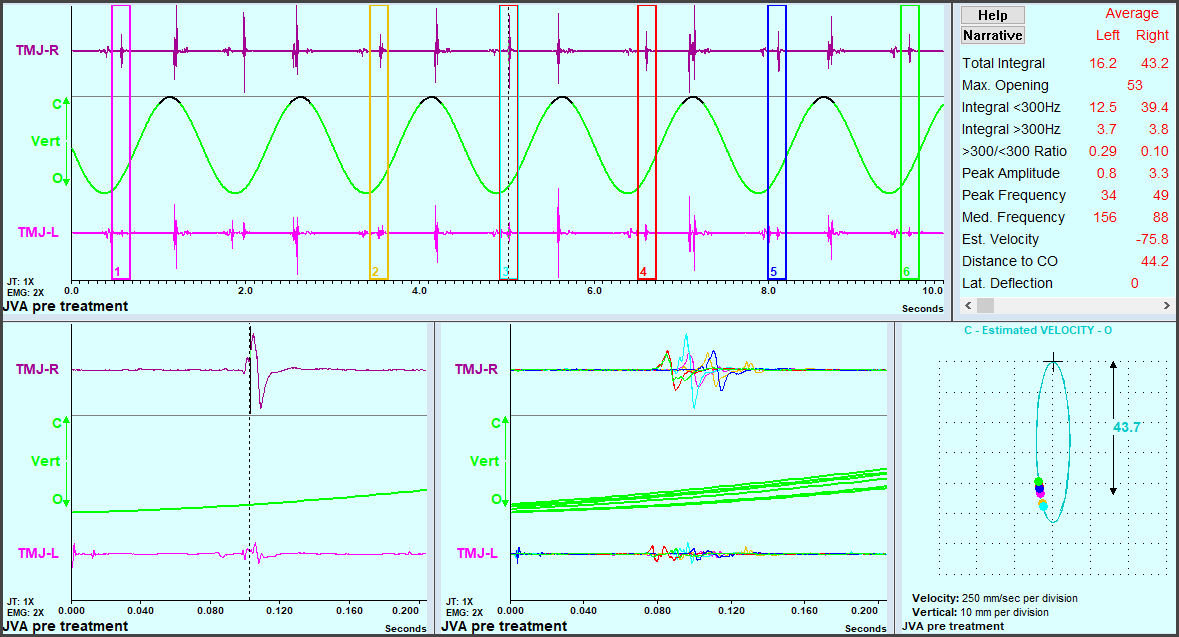
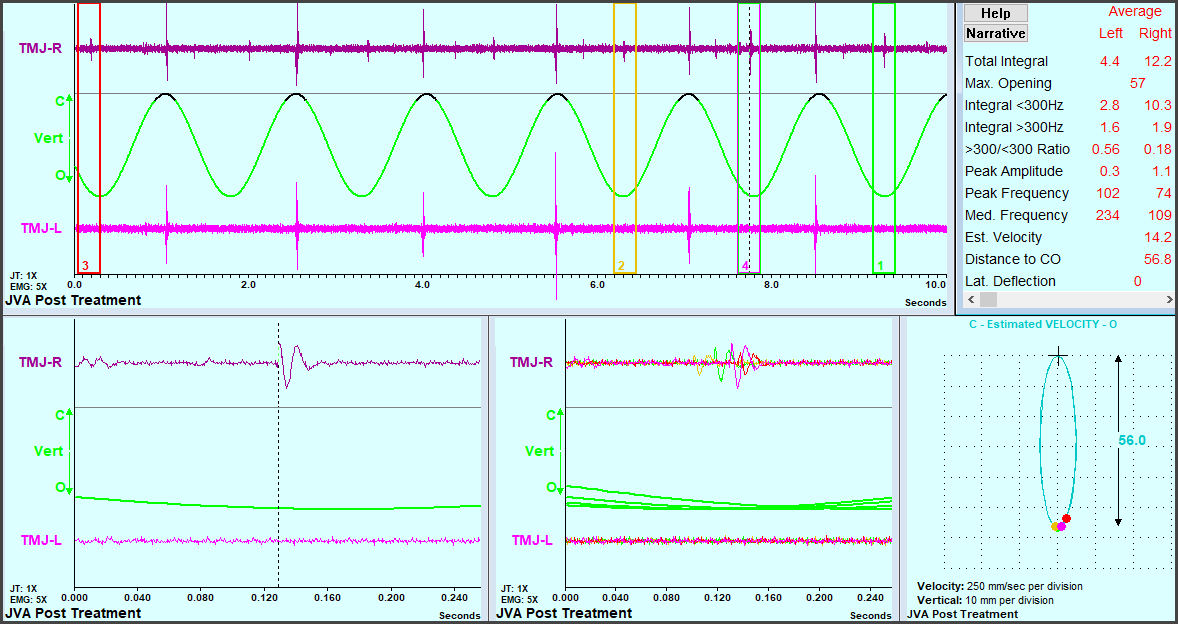
The JVA recording requires the subject to follow a metronome in opening and closing to allow the system to estimate the position of the jaw at the onset of a vibration, whether during opening or during closing. The record includes six complete open to maximum and close to occlusion cycles, which forces both condyles to extend to their maximum anterior position and return to their centric occlusion position. See Figure 2. The post treatment example record is illustrated below in the Figure 3.

After being fully informed of the benefits and risks involved, those patients who consented were provided treatment in the form of Immediate Complete Anterior Guidance Development (ICAGD), which is also referred to as Disclusion Time Reduction (DTR) therapy because the goal of treatment is to remove posterior occlusal interferences to lateral excursions. The end point of DTR is indicated when the time required to produce the left and right lateral excursions is reduced to less than 0.5 seconds, the disclusion is produced with the anterior teeth and the muscle activity involved is reduced to a minimum. An example of a patient’s pre-treatment disclusion time is shown in Figure 4 and the same patient’s post-treatment disclusion time one day later in Figure 5.

Figure 4
Figure 4.Long disclusion time (2.29 seconds) and very hyperactive right anterior temporalis muscle indicating excess work was occurring between points “C” and “D” in the trace.
Figure 5
Figure 5.Shortened disclusion time (0.23 seconds) and much lower activity of the right anterior temporalis muscle between points “C” and “D” in the trace. Note: Some electromagnetic interference was present on the second day affecting the TA-L and MM-R channels.

Prior to any treatment this group’s substantial painful symptoms were surveyed (Table 1) and each subject also completed the Beck Depression Inventory – II prior to any physical treatment (Table 2).29 The pre-treatment BDI-II median score (24) suggests that the group as a whole was experiencing a moderate level of depression. Although it is not reliable to arrive at a diagnosis of Somatic Symptom Disorder (SSD) in the presence of physically painful conditions, some recommend evaluating a TMD patient during the diagnostic workup, even prior to any physical treatment. The problem with this approach is that the symptoms associated with SSD are the same symptoms that are also associated with physically induced pain. However, if after the treatment has concluded the patient still scores high on the PHQ-15, then an SSD diagnosis could be present.46–48 One caveat is that symptoms often retreat gradually in response to any treatment. Thus, some time may be required (1 week to several months) before a particular patients’ full recovery can be effectively assessed.

Table 1.Left TMJ vibrations and range of motion were recorded prior to DTR and again one week after DTR was finalized. The increase in ROM and the decreases in the vibration intensity at all frequencies were consistent.
JVA Quick from
Left TMJ
Maximum
Open (mm)
Left Total
Integral
Left Integral
<300Hz
Left Integral
>300Hz
Left Peak Amplitude
(μV x sec)
Pre-Tx Means 46.5 24.1 20.2 3.9 2.1
Pre-Tx SD 8.71 42.57 36.04 7.88 3.53
Paired t test p < 0.0000 0.0382 0.0416 0.0413 0.0628
Post-Tx Means 51.9 15.5 13.3 2.2 1.5
Post-Tx SD 8.90 17.45 15.91 2.28 1.52

SD = standard deviation, Tx = treatment, red = significant, green = trend, μV x sec = microvoltseconds

Table 2.Right TMJ vibrations and range of motion were recorded prior to DTR and again one week after DTR was finalized. The increase in ROM and the decreases in the vibration intensity at all frequencies were consistent.
JVA Quick from Right TMJ Maximum Open (mm) Right Total Integral Right Integral
<300Hz
Right Integral
>300Hz
Right Peak Amplitude
(μV x sec)
Pre-Tx Mean 46.5 26.2 26.7 5.0 2.3
Pre-Tx SD 8.71 45.05 39.49 8.30 4.15
Paired t test p < 0.0000 0.0527 0.0271 0.0607 0.0607
Post-Tx mean 51.9 16.7 16.8 3.4 1.5
Post-Tx SD 8.90 18.56 18.42 4.82 2.06

SD = standard deviation, Tx = treatment, red = significant, green = trend, μV x sec = microvoltseconds

Results

of motion that were recorded during the clinical examination were compared to the vibrations and range of motion recorded after completion of the DTR treatment. The vibrations from the left TMJ decreased significantly in the intensity of the integrals (p < 0.05) and with a trend in the peak amplitude (p < 0.063). The same sets of measurements and analyses were made with respect to the right temporomandibular joints and found to be very similar. The ROM increased very significantly (p < 0.00000). Tables 1 & 2.

Pain Scores

A dramatically significant reduction in the pain scores was reported by the subjects one week after DTR treatment. See Table 3. Note: A score of 90 would be equivalent to a score of 50 on a 100 mm Visual Analog Scale. While these subjects were not severe cases probably due to the relative youthful status, the reductions were all highly significant.

Table 3.Ten specific painful conditions were tracked and compared using the Wilcoxon Signed-Rank Test between the pre-treatment status and the post-treatment status. The Group Total is the sum of all subjects’ scores, maximum score = 180 (60 x 3). The score of 108 is equivalent to a score of 60 on a 100 mm VAS scale.
Frequency Scores of 10 Painful Symptoms (0 to 180) Debilitating Headaches with Meniere's Mild Headaches with OTC Medications Light Sensitive with Headaches Nausea with My Headaches Headaches Terrible with Work
Group Total Pre-Tx 73 42 74 25 108
Group Total Post Tx 5 4 4 2 5
Wilcoxon Signed
Rank Test - p <
0.00001 0.00000 0.00022 0.00000
Headaches that are Intense Upper Neck Tension or Pain Only have Pain in My Temples “Mohawk” Type Headache Pain 50 % Disabled from Headaches
Group Total Pre-Tx 97 70 47 43 9
Group Total Post-Tx 2 2 4 6 1
Wilcoxon Signed
Rank Test - p <
0.00000 0.00000 0.00001 0.00005 0.01255

Tx = treatment, OTC = over the counter

The Beck Depression Inventory – II has been recommended as a means of evaluating the level of depression of all TMD subjects and is something of a standardized approach. While the pre-treatment median score of 24 suggested that the average subject within the group was suffering a moderate level of depression, one week post treatment the BDI-II median score dropped to 4, that was within the normal range of 0 to 10. No subject remained above 10 after treatment. See Table 4.

Table 4.A comparison of the Beck Depression Inventory – II group mean and median scores (63 maximum) between pre and post DTR treatment. A score of ten or less is considered within normal limits. A score of 24 represents moderate depression.
Beck Depression
Inventory - II
BDI-II Average Score Pre-Tx Day 1 BDI-II Average Score Post-Tx Day 2
Mean 24.3 4.4
Median 24 4
Wilcoxon Signed-Rank Test p < 0.00001

Tx = treatment

Perhaps due to the youthfulness of this group the mean PHQ-15 score pre-treatment was only 6.82. 54 subjects scored between 5 and 9, which might have been misconstrued as low SSD severity. Only one subject scored in the medium SSD range (10 – 14) and five scored within the normal range of 0 – 4. See Table 5.

Table 5.Pre-treatment and post-treatment group scores from the PHQ-15 questionnaire. It is startling to note that in addition to tooth grinding and headaches, several other bodily pains, usually unassociated with the masticatory system, were also dramatically reduced after treatment with DTR.
PHQ-15 data comparing Pre-Treatment to Post Treatment Total Score for
Group Pre-⁠DTR
Total Scores for
Group Post-⁠DTR
Gender (16 M & 44 F)
Mean Age (21.1 years) Score Range Score Range
Responses: 0 = not bothered at all, 1 = bothered a little, 2 = bothered a lot 0 - 120 0 - 120
Stomach pain 28 4
Back pain 51 5
Pain in arms, legs or joints (jaw, neck, etc.) 34 10
Menstrual cramps or other problems with your periods (Women) 17 1
Headaches 100 19
Chest Pains 0 0
Dizziness or ringing in your ears (tinnitus) 54 5
Fainting Spells 0 0
Feeling your heart pound or race 13 1
Shortness of breath 0 0
Pain or problems during sexual intercourse 0 0
Constipation, loose bowels or diarrhea 0 0
Nausea, gas or indigestion 0 0
Feeling tired or having low energry 56 5
Trouble sleeping or grinding teeth at night 56 5
Total 409 55
Wilcoxon Signed-Rank Test - p = 0.00135

DTR = disclusion time reduction, M = male, F = female

The disclusion times were recorded prior to any treatment being rendered as part of the diagnostic work-up. A pre-treatment long disclusion time suggested a probable posterior occlusal interference condition. A short disclusion time post-treatment was considered as an indication of free entry into centric occlusion without substantial posterior occlusal interferences. Based upon previous mastication studies, the lateral excursive pathway is also normally used as the path of closure during unilateral mastication.49,50 The dramatic reductions in disclusion times as seen in this study are common after DTR therapy as that is the focus of the procedure. See Table 6.

Table 6.Left and right lateral excursive disclusion times recorded pre-treatment and post-treatment for comparison.
EMG Activity at C TA-R TA-L MM-R MM-L
Pre-Tx Mean 54.1 61.7 51.7 35.8
Standard Deviation 39.66 46.60 39.55 23.26
Student's Paired t-test p = 0.0229 0.0653 0.091 0.005
Post-Tx Mean 64.7 69.5 58.2 50.8
Standard Deviation 41.75 39.19 44.33 49.62

Tx = treatment, TA = anterior temporalis, MM = masseter, red = significant, green = trend

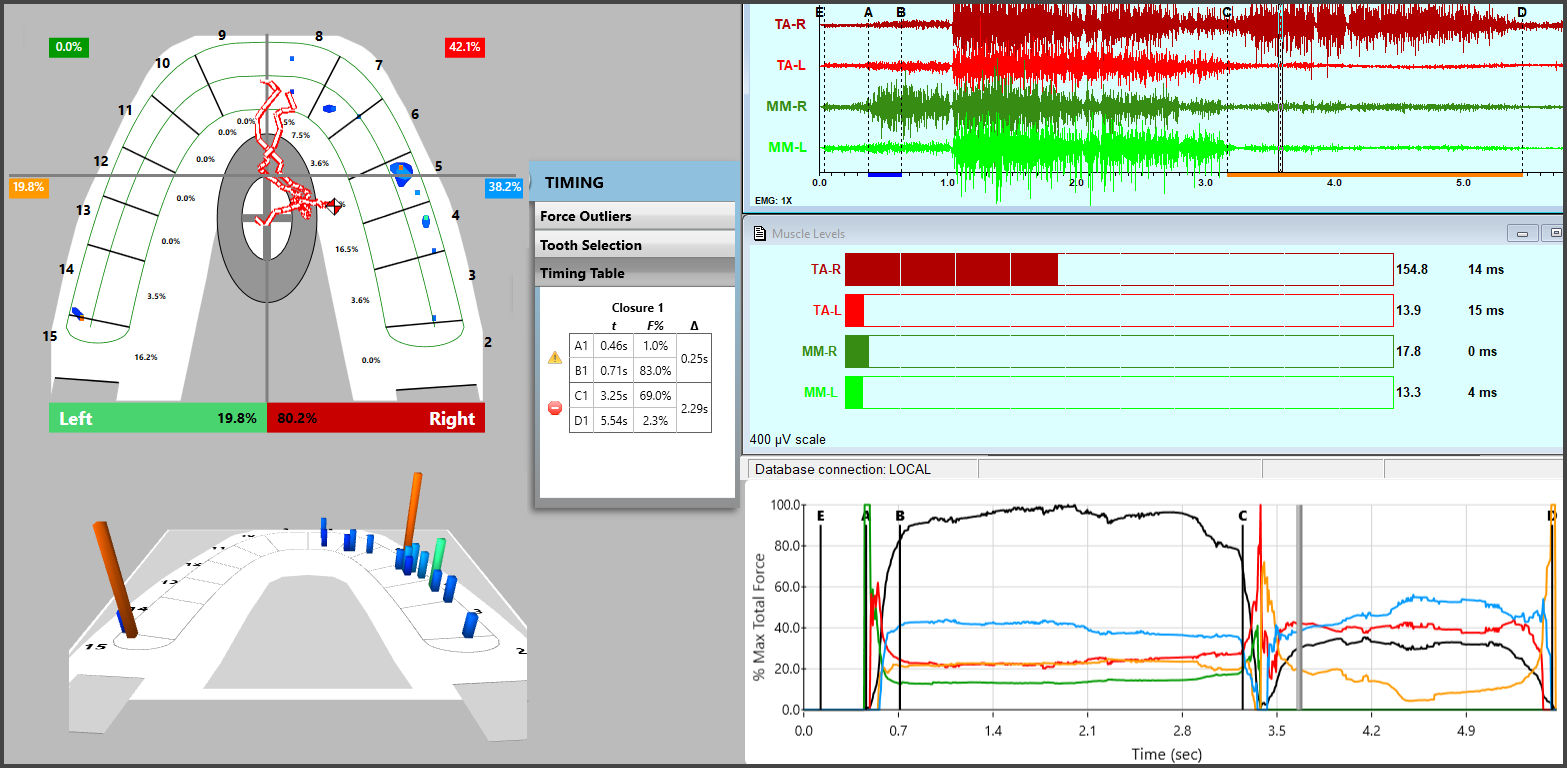
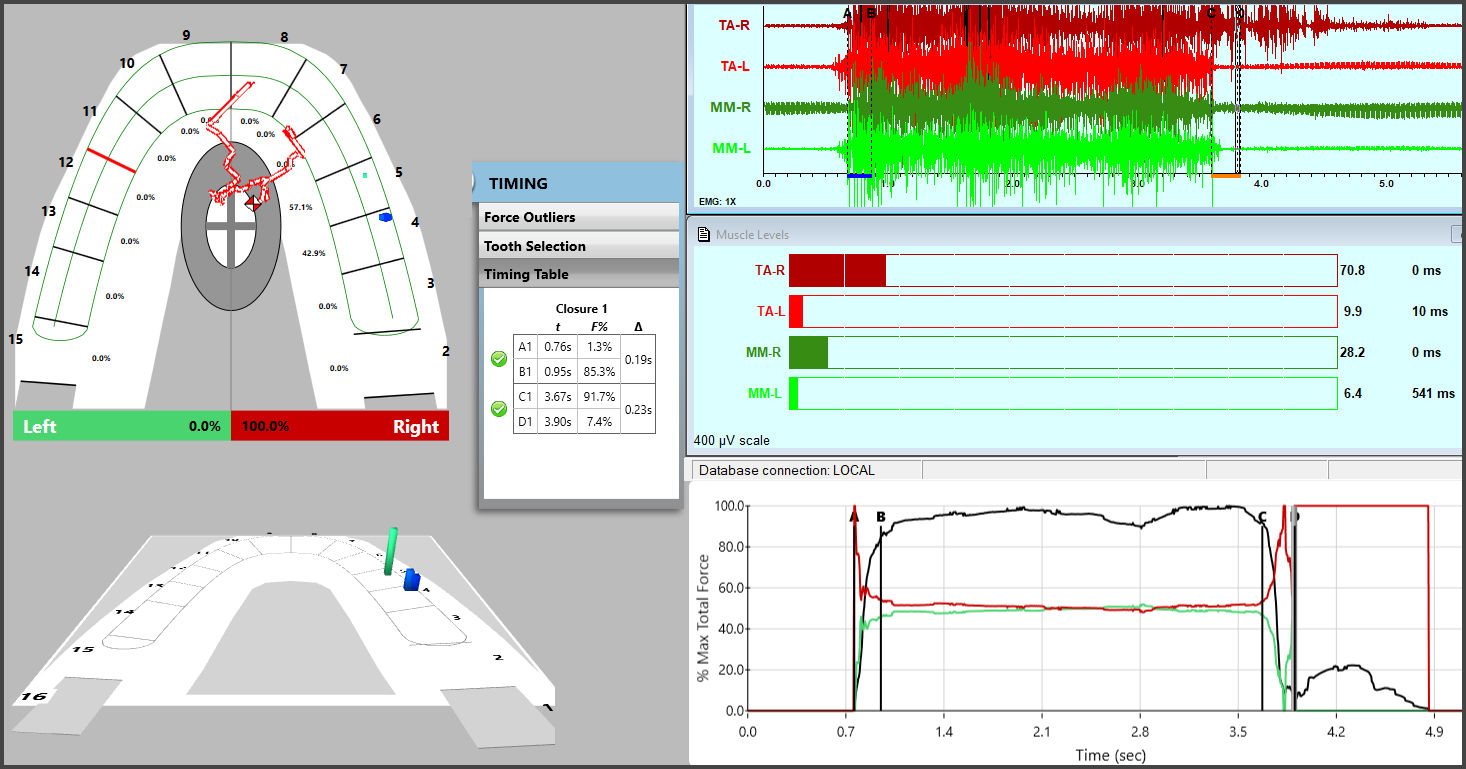
During the recordings of disclusion times with T-Scan the activities of the masseter and anterior temporalis muscles were also recorded at “C” just before the excursion begins. This activity is produced in the intercuspal position so any increase in activity and balance reflects positively on the stability of the intercuspal position. The values increased prior to the right excursion (TA-R & MM-L) and exhibited a trend in the same direction prior to the left excursions (TA-L & MM-R). See Table 7. It was also determined that the EMG activity levels at “C” were significantly higher post-DTR for this group (comparing the mean values of the four muscles using the non-parametric Sign Test; p = 0.01267) than prior to DTR. A smaller standard deviation was also calculated indicating increased consistency in centric occlusion as well. See Table 8.

Table 7.EMG activity at “C” (just prior to the lateral excursions) for the four muscles recorded pre-treatment and post-treatment.
EMG Activity at C TA-R TA-L MM-R MM-L
Pre-Tx Mean 54.1 61.7 51.7 35.8
Standard Deviation 39.66 46.60 39.55 23.26
Student's Paired t-test p = 0.0229 0.0653 0.091 0.005
Post-Tx Mean 64.7 69.5 58.2 50.8
Standard Deviation 41.75 39.19 44.33 49.62

Tx = treatment, TA = anterior temporalis, MM = masseter, red = significant, green = trend

Table 8.Higher activity, but reduced variability and imbalance between muscles at “C.”
EMG Activity at "C" Pre-DTR Post-DTR
TA-R 54.1 64.7
TA-L 61.7 69.7
MM-R 51.7 58.2
MM-L 35.8 50.8
mean 50.8 60.9
SD 10.89 8.19
Sign Test p = 0.01267

Discussion

Within this group of subjects the mean Total Integral (intensity at all frequencies combined) indicated that the group as a whole was characterized by a medium level of vibration (Total Integral = 24.1 on the left and 26.2 on the right) prior to treatment. See JVA Flow Chart in the appendix. Post treatment the group mean Total Integral was reduced to the level of small vibrations (15.5 on the left and 16.7 on the right); “small” also being the range of Total Integral intensity that is present within a control group of asymptomatic subjects.10 These subjects were screened with JVA to avoid any subjects with severe TMJ conditions that were not well adapted. See the appendix for the JVA Flow Chart.

The example JVA data in Figures 1 & 2 are typical vibration levels for muscular TMD subjects without substantial TMJ involvement, indicating a moderate (medium in the JVA Flow Chart) or low levels of vibration. The right opening vibrations were suggestive of a partial disk displacement with reduction. The vibration reduction together with no loss of ROM seen post treatment suggests that either the right TMJ partially displaced disk was recaptured (Piper 2) or the disk permanently partially displaced (Piper 3b). Neither of these conditions is serious. The vibration levels in the left TMJ were within the normal range (Total Integral < 20) both pre and post treatment. The small increase in the ROM was probably due to muscle relaxation.

The fact that the increase in the mean ROM distance was only 5.4 mm, but very highly significant, was due to the fact that not only was the mean ROM improved, but 55 of 60 subjects experienced at least a small increase in ROM, in many cases possibly just due to some muscle relaxation. Of the 11 subjects with limited ROM prior to treatment, only 3 remained so after treatment. See Tables 1 & 2.

TMD patients with primarily painful muscular symptoms, sometimes referred to as myofascial pain dysfunction syndrome (MPDS), are commonly thought to have a “muscle problem.” However, painful muscles can be secondary to malocclusion that causes excessive effort on the part of the muscles. The best evidence to support this in the literature is in the form of successful treatment with Immediate Complete Anterior Guidance Development (ICAGD) coronoplasty, also referred to as Disclusion Time Reduction (DTR).27–30,34–45,49,50 One limitation is the presence of chronic, poorly-adapted internal derangements of the TMJ. An internal derangement, with or without degeneration, can distort the structure of the masticatory system to the point that the arches are so mal-occluded, it is not possible to adjust the occlusion enough to correct the maxillo-mandibular mal-relationship. Thus, when selecting a potential patient for DTR therapy, it is incumbent upon the practitioner to evaluate whether TMJ function is sufficiently normal or well adaptated.30,46,47,49,50

According to the Beck Depression Inventory – II scores, this group was moderately depressed (median score = 24) prior to any DTR treatment. Post-treatment the median score dropped to 4, well within the normal range (0 – 10), indicating the previous real level of depression was related to their malocclusions and relieved after DTR in this group. See Table 4. Although it can be useful to understand the level of depression of each TMD patient prior to treatment, it is more important to understand that physically induced pain inevitably leads to some level of depression, especially when the pain is chronic, long lasting and seemingly without hope of resolution.51 To confirm that a patient’s level of depression is etiologically related to emotional factors, which can be the case, all physical etiologies must be removed from contention.

The Patient Health Questionnaire -15 (PHQ-15) is a validated instrument to evaluate a patient for a Somatic Symptom Disorder. According to their scores, 54 out of 60 in this group prior to treatment could have been labeled as mild SSD (scores between 5 and 9) and one as a moderate SSD (> 10). The other five scored within the normal range (0 – 4). Post ICAGD only five subjects remained within the mild SD range (5 – 9), none exceeded 9 and the rest (55) were all back into the normal range (0 – 4). Thus instead of evaluating 55 subjects for SSD, only 5 needed to be followed-up with a re-test at a later date.

For the PHQ-15 to be accurate patients cannot have any physical medical condition etiologically related to their painful complaints. The dramatic reductions in pains outside of the masticatory system in this group of young subjects reveals the whole-body effects that are possible with malocclusion. An 84 % reduction in stomach pain could be attributed to poor mastication and overall tiredness resulting from poor nutrition, but a 90 % reduction in back pain seems to be a rather distant connection. Tinnitus on the other hand has been associated with TMD in numerous previous studies.52–55 Thus, a 90 % reduction in tinnitus is not very surprising. An 81 % reduction in headaches for the group is also not surprising because headaches are probably the most common complaint from TMD patients.56

When applying ICAGD to shorten the disclusion time the subject bites down on the T-Scan wafer first and then makes a lateral excursion. Posterior occlusal contacts add friction to the process and slow down the progress. Removing posterior interfering contacts and creating anterior disclusion reduces the friction and speeds up the process measurably. While reducing the disclusion time is the goal of the process, the removal of the functionally interfering contacts is the benefit to the patient. This has been demonstrated previously in studies that have evaluated masticatory functional movements and simultaneous muscle activities pre and post ICAGD.29,49,50 In this study the EMG was used primarily to evaluate the reduction in activity between “C” and “D” during the lateral excursive movements because a lack of posterior contact automatically reduces the elevating activity of the masseter and anterior temporalis muscles. The level at “C” can indicate the degree of stability and the balance of the elevator muscles in centric occlusion as well. In this study the levels at “C” increased post ICAGD, but more importantly they became more uniform and less variable between the elevator muscles suggesting improved stability and consistency. See Table 8.

Conclusions

The intensities of TMJ vibrations recorded with Joint Vibration Analysis were significantly reduced post ICAGD as were the symptoms of depression that are very often associated with TMD patients. Somatic-like Symptoms, present with this TMD group pre-treatment, were fully relieved post-treatment. Along with muscular pain relief, after disclusion times were reduced, the muscle activity was observed to become more closely balanced.


Funding Statement

This study was not funded.

Conflict Statement

John Radke is the Chairman of the Board and Greg Kamyszek is the President of BioResearch Associates, Inc. No other potential conflicts of interest were present.

Accepted: February 18, 2022 CDT

References

1.
Radke JC, Kull RS. Distribution of Temporomandibular Joint vibration transfer to the opposite side. CRANIO. 2012;30(3):194-200. doi:10.1179/crn.2012.030
Google Scholar
2.
Ishigaki S, Bessette RW, Maruyama T. Vibration analysis of the temporomandibular joints with meniscal displacement with and without reduction. Cranio. 1993;11(3):192-201. doi:10.1080/08869634.1993.11677964
Google Scholar
3.
Ishigaki S, Bessette RW, Maruyama T. Vibration analysis of the temporomandibular joints with degenerative joint disease. Cranio. 1993;11(4):276-283. doi:10.1080/08869634.1993.11677979
Google Scholar
4.
Christensen LV, Orloff J. Reproducibility of temporomandibular joint vibrations (electrovibratography). J Oral Rehabil. 1992;19(3):253-263. doi:10.1111/j.1365-2842.1992.tb01100.x
Google Scholar
5.
Owen AH III. Rationale and utilization of temporomandibular joint vibration analysis in an orthopedic practice. Cranio. 1996;14(2):139-153. doi:10.1080/08869634.1996.11745960
Google Scholar
6.
Olivieri KAN, Garcia AR, Paiva G, Stevens C. Joint vibrations analysis in asymptomatic volunteers and symptomatic patients. Cranio. 1999;17(3):176-183. doi:10.1080/08869634.1999.11746092
Google Scholar
7.
Zhang J, Whittle T, Wang L, Murray GM. The reproducibility of temporomandibular joint vibrations over time in the human. J Oral Rehabil. 2014;41(3):206-217. doi:10.1111/joor.12141
Google Scholar
8.
Ishigaki S, Bessette WR, Maruyama T. A clinical study of temporomandibular joint (TMJ) vibrations in TMJ dysfunction patients. Cranio. 1993;11(1):7-13; discussion 14. doi:10.1080/08869634.1993.11677935
Google Scholar
9.
Radke JC, Kull RS. Comparison of TMJ vibration frequencies under different joint conditions. Cranio. 2015;33(3):174-182. doi:10.1179/2151090314y.0000000019
Google Scholar
10.
Gupta B, Thumati P, Radke J. Temporomandibular joint vibrations from totally asymptomatic subjects. Cranio. 2016;34(3):169-175. doi:10.1179/2151090315y.0000000013
Google Scholar
11.
Ishigaki S, Bessette RW, Maruyama T. Vibration of the temporomandibular joints with normal radiographic imagings: comparison between asymptomatic volunteers and symptomatic patients. Cranio. 1993;11(2):88-94. doi:10.1080/08869634.1993.11677948
Google Scholar
12.
Droter JR. An orthopaedic approach to the diagnosis and treatment of disorders of the temporomandibular joint. Dent Today. 2005;24(11):82-84.
Google Scholar
13.
Kondrat W, Sierpińska T, Radke J. Assessment of the Temporomandibular Joint Function in Young Adults without Complaints from the Masticatory System. Int J Med Sci. 2018;15(2):161-169. doi:10.7150/ijms.21665
Google ScholarPubMed CentralPubMed
14.
Honda K, Natsumi Y, Urade M. Correlation between MRI evidence of degenerative condylar surface changes, induction of articular disc displacement and pathological joint sounds in the temporomandibular joint. Gerodontology. 2008;25(4):251-257. doi:10.1111/j.1741-2358.2008.00219.x
Google Scholar
15.
Hwang IT, Jung DU, Lee JH, Kang DW. Evaluation of TMJ sound on the subject with TMJ disorder by Joint Vibration Analysis. J Adv Prosthodont. 2009;1(1):26-30. doi:10.4047/jap.2009.1.1.26
Google ScholarPubMed CentralPubMed
16.
Huang ZS, Lin XF, Li XL. Characteristics of temporomandibular joint vibrations in anterior disk displacement with reduction in adults. Cranio. 2011;29(4):276-283. doi:10.1179/crn.2011.041
Google Scholar
17.
Ishigaki S, Bessette RW, Maruyama T. Diagnostic accuracy of TMJ vibration analysis for internal derangement and/or degenerative joint disease. Cranio. 1994;12(4):241-245; discussion 246. doi:10.1080/08869634.1994.11678028
Google Scholar
18.
Sharma S, Crow HC, Kartha K, McCall WDJr, Gonzalez YM. Reliability and diagnostic validity of a joint vibration analysis device. BMC Oral Health. 2017;17(1):56. doi:10.1186/s12903-017-0346-9
Google ScholarPubMed CentralPubMed
19.
Mazzetto MO, Hotta TH, Carrasco TG, Mazzetto RG. Characteristics of TMD noise analyzed by electrovibratography. Cranio. 2008;26(3):222-228. doi:10.1179/crn.2008.030
Google Scholar
20.
Goiato MC, Garcia AR, dos Santos DM, Pesqueira AA. TMJ vibrations in asymptomatic patients using old and new complete dentures. J Prosthodont. 2010;19(6):438-442. doi:10.1111/j.1532-849x.2010.00614.x
Google Scholar
21.
Mazzeto MO, Hotta TH, Mazzetto RG. Analysis of TMJ vibration sounds before and after use of two types of occlusal splints. Braz Dent J. 2009;20(4):325-330. doi:10.1590/s0103-64402009000400011
Google Scholar
22.
Devi J, Verma M, Gupta R. Assessment of treatment response to splint therapy and evaluation of TMJ function using joint vibration analysis in patients exhibiting TMJ disc displacement with reduction: A clinical study. Indian J Dent Res. 2017;28(1):33-43. doi:10.4103/ijdr.ijdr_154_16
Google Scholar
23.
Kuntamukkula S, Sinha R, Tiwari PK, Paul D. Dynamic Stability Assessment of the Temporomandibular Joint as a Sequela of Open Reduction and Internal Fixation of Unilateral Condylar Fracture. J Oral Maxillofac Surg. 2018;76(12):2598-2609. doi:10.1016/j.joms.2018.06.014
Google Scholar
24.
Giray B, Sadry S. Modifications in Class I and Class II Div. 1 malocclusion during orthodontic treatment and their association with TMD problems. Cranio. 2021;39(1):65-73. doi:10.1080/08869634.2019.1572282
Google Scholar
25.
Kondrat W, Sierpinska T, Radke J. Can devices for the instrumental analysis of temporomandibular joints be used interchangeably? Cranio. 2021;39(2):165-171. doi:10.1080/08869634.2019.1582837
Google Scholar
26.
Liu W, Liu S, Xiong X, et al. Condyle bone destruction: the association between temporomandibular joint vibration and finite element analysis. Oral Radiol. 2022;38(4):565-574. doi:10.1007/s11282-022-00592-4
Google Scholar
27.
Kerstein RB, Wright NR. Electromyographic and computer analyses of patients suffering from chronic myofascial pain-dysfunction syndrome: before and after treatment with immediate complete anterior guidance development. J Prosthet Dent. 1991;66(5):677-686. doi:10.1016/0022-3913(91)90453-4
Google Scholar
28.
Thumati P, Thumati RP. The effect of disocclusion time-reduction therapy to treat chronic myofascial pain: A single group interventional study with 3 year follow-up of 100 cases. J Indian Prosthodont Soc. 2016;16(3):234-241. doi:10.4103/0972-4052.176529
Google ScholarPubMed CentralPubMed
29.
Kerstein RB, Radke J. Average chewing pattern improvements following Disclusion Time reduction. Cranio. 2017;35(3):135-151. doi:10.1080/08869634.2016.1190526
Google Scholar
30.
Thumati P, Kerstein RB, Yiannios N, Radke J, Sutter B. Changes in Beck Depression Inventory - II scores of TMD subjects after measured occlusal treatment. Adv Dent Tech. 2018;1(1):2-13.
Google Scholar
31.
Murray GM, Phanachet I, Uchida S, Whittle T. The human lateral pterygoid muscle: A review of some experimental aspects and possible clinical relevance. Aust Dent J. 2004;49(1):2-8. doi:10.1111/j.1834-7819.2004.tb00042.x
Google Scholar
32.
Wilkinson TM. The relationship between the disk and the lateral pterygoid muscle in the human temporomandibular joint. J Prosthet Dent. 1988;60(6):715-724. doi:10.1016/0022-3913(88)90406-4
Google Scholar
33.
Tanaka TT. Head, Neck and TMD Management. 4th ed. Clinical Research Foundation; 1989.
Google Scholar
34.
Kerstein RB. Disclusion Time reduction therapy with immediate complete anterior guidance development: the technique. Quintessence Int. 1992;23:735-747.
Google Scholar
35.
Kerstein RB. Treatment of myofascial pain dysfunction syndrome with occlusal therapy to reduce lengthy Disclusion Time - a recall study. CRANIO. 1995;13(2):105-115. doi:10.1080/08869634.1995.11678053
Google Scholar
36.
Thumati P, Manwani R, Mahantshetty M. The effect of reduced Disclusion Time in the treatment of myofascial pain dysfunction syndrome using immediate complete anterior guidance development protocol monitored by digital analysis of occlusion. CRANIO. 2014;32(4):289-299. doi:10.1179/2151090314y.0000000004
Google Scholar
37.
Yiannios N, Kerstein RB, Radke J. Treatment of frictional dental hypersensitivity (FDH) with computer-guided occlusal adjustments. CRANIO. 2016;35(6):347-357. doi:10.1080/08869634.2016.1251692
Google Scholar
38.
Kerstein RB, Wright NR. Electromyographic and computer analyses of patients suffering from chronic myofascial pain-dysfunction syndrome: before and after treatment with immediate complete anterior guidance development. J Prosthet Dent. 1991;66(5):677-686. doi:10.1016/0022-3913(91)90453-4
Google Scholar
39.
Kerstein RB. Disclusion Time measurement studies, Stability of Disclusion Time. A 1-year follow-up study. J Prosthet Dent. 1994;72(2):164-168. doi:10.1016/0022-3913(94)90075-2
Google Scholar
40.
Kerstein RB. Disclusion Time measurement studies; Part 2: A comparison of Disclusion Time length of 49 chronic myofascial pain dysfunction syndrome patients to 40 non - patients. A population analysis. J Prosthet Dent. 1994;72(5):473-480. doi:10.1016/0022-3913(94)90117-1
Google Scholar
41.
Kerstein RB, Chapman R, Klein M. A comparison of ICAGD (Immediate Complete Anterior Guidance Development) to “mock ICAGD” for symptom reductions in chronic myofascial pain dysfunction patients. CRANIO. 1997;15(1):21-37. doi:10.1080/08869634.1997.11745990
Google Scholar
42.
Kerstein RB, Radke J. The effect of Disclusion Time Reduction on maximal clench muscle activity level. CRANIO. 2006;24(3):156-165. doi:10.1179/crn.2006.026
Google Scholar
43.
Kerstein RB, Radke J. Masseter and temporalis excursive hyperactivity decreased by measured anterior guidance development. CRANIO. 2012;30(4):243-254. doi:10.1179/crn.2012.038
Google Scholar
44.
Kerstein RB. Combining technologies: a computerized occlusal analysis system synchronized with a computerized electromyography system. CRANIO. 2004;22(2):96-109. doi:10.1179/crn.2004.013
Google Scholar
45.
Kerstein RB. Reducing chronic masseter and temporalis muscular hyperactivity with computer-guided occlusal adjustments. Comp Contin Ed Dent. 2010;31:530-543.
Google Scholar
46.
Matos M, Thumati P, Sutter BA, et al. Are Temporomandibular Disorders Really Somatic Symptom Disorders? Part I – Psychometric evaluation of different physical treatment approaches. Adv Dent Tech. 2021;3(2):5-16.
Google Scholar
47.
Matos M, Thumati P, Sutter B, et al. Are Temporomandibular Disorders Really Somatic Symptom Disorders? Part II – Joint Vibration Analysis of the Temporomandibular Joint. Adv Dent Tech. 2021;4(1):21-34.
Google Scholar
48.
Matos M, Thumati P, Sutter BA, et al. Are Temporomandibular Disorders Really Somatic Symptom Disorders? Part III – Masticatory Function as Revealed by EMG and EGN. Adv Dent Tech. 2021;4(3):35-53.
Google Scholar
49.
Kerstein RB, Radke J. Average Chewing Pattern improvements following Disclusion Time Reduction. CRANIO. 2017;35(3):135-151. doi:10.1080/08869634.2016.1190526
Google Scholar
50.
Kerstein RB, Sutter B, Radke J. Increased Mastication Smoothness After Disclusion Time Reduction (DTR). Adv Dent Tech. 2021;4(1):65-75.
Google Scholar
51.
Montgomery W, Vietri J, Shi J, et al. The relationship between pain severity and patient-reported outcomes among patients with chronic low back pain in Japan. J Pain Res. 2016;9:337-344. doi:10.2147/jpr.s102063
Google ScholarPubMed CentralPubMed
52.
Gelb H, Gelb ML, Wagner ML. The relationship of tinnitus to cranio-cervical mandibular disorders. Cranio. 1997;15(2):136-143. doi:10.1080/08869634.1997.11746004
Google Scholar
53.
Freesmeyer WB, Fussnegger MR, Ahlers MO. Diagnostic and therapeutic-restorative procedures for masticatory dysfunctions. GMS Curr Top Otorhinolaryngol Head Neck Surg. 2005;4:Doc19.
Google Scholar
54.
Buergers R, Kleinjung T, Behr M, Vielsmeier V. Is there a link between tinnitus and temporomandibular disorders? J Prosthet Dent. 2014;111(3):222-227. doi:10.1016/j.prosdent.2013.10.001
Google Scholar
55.
Unell L, Ström D, Ekman K, Johansson A, Arnrup K, Carlsson GE. A 3-year study of patients with tinnitus and jaw muscle tenderness. Cranio. 2019;37(5):304-309. doi:10.1080/08869634.2018.1430097
Google Scholar
56.
Nilsson IM, List T, Drangsholt M. Headache and co-morbid pains associated with TMD pain in adolescents. J Dent Res. 2013;92(9):802-807. doi:10.1177/0022034513496255
Google Scholar

Appendix

Figure 1A
Figure 1A.JVA Flow Chart

JVA Flow Chart is designed to allow a quick, “ball-park” interpretation of the analysis of a JVA trace. It is divided into four segments for small, medium, large and very large intensity vibrations. By plugging in the numerical values calculated by the BioPAK program (residing in the Summary View), one can obtain a tentative indication of a TMJ condition. If the indication is normal the specificity of JVA is 98 %, If the JVA indicates dysfunction, it may be necessary to obtain an image for further clarification

This Flow Chart was developed in the 1990s by training an artificial neural network on actual JVA data that had been validated with imaging (MRI & CT), clinical means and for worst-cases, surgery. The network weights were investigated and revealed that the intensity of the vibration (Total Integral) was the most important single parameter in distinguishing its source. The second most important parameter was the range of motion of the patient (ROM). Following through, the third most important parameter was the relative distribution of frequencies above and below the 300 Hertz reference. The waveform images were added as a means of quality control, to confirm the selection by comparing it to the original waveform in the patient’s data. The 0.5X to 10X designations indicate the magnification setting of the example waveforms when they were recorded with JVA. This is the eleventh revision of this Flow Chart, continuously improving its performance, which has been utilized now for more than two decades.