

Introduction
A functional evaluation of the Stomatognathic system is important to perform in all dental patients by clinically assessing the occlusal function. This function can be defined, objectively measured, and documented with bite force measurements, jaw kinematics, mastication analyses, and muscle activation, among others.1
Dentistry is quick to use phrases like “evidence based”, yet most authors and clinicians do not utilize objective and quantifiable biometric technologies that measure neurologic and muscular occlusal physiology. Although the profession requires evidence-based implementation for materials (implants, ceramics, composites, and metals), the evidence-based literature regarding the dynamics of muscle physiology, range of motion, TM joint function, and digitally measured occlusion are largely ignored. In this Information Age of Dentistry, it is clinically insufficient to rely solely on subjective and visual evaluations of the occlusion, and to employ manual muscle palpation when aspiring to make an accurate and objective patient physical examination. Digital biometric instrumentation is essential to objectively examine and quantify Stomatognathic function. And, although currently biometric instrumentation is the gold standard, it should be the Standard of Care in today’s Dental Medicine.2
Normal masticatory function depends upon several factors: occlusion, maximum bite force, chewing cycle kinematics, and body size.3 Maximum Bite Force (MBF) and he capacity to exert bite force can indicate the functional of the masticatory system.4 Bite force is the result of the synchronized activation of the mandibular elevator muscles, predominantly the masseter, medial pterygoid, and temporalis muscles. A stable occlusion enables the muscles to operate with force and efficiency, allowing the Stomatognathic system to meet its’ functional demands.5
It is known that patients who suffer from Temporomandibular Disorders (TMD) demonstrate a reduced MBF,6,7 which was confirmed in a recent meta analysis that compared TMD patients to healthy controls.8 Further, myogenic TMD patients also demonstrate reduced clenching abilities9,10 with the likely causes of decreased bite force being myogenic and arthrogenic pains.11 In TMD patients, the muscles of mastication have a diminished capacity to exert force during occluding, yet controversies exists as to if TMD is etiologic for this bite force reduction, or whether treatment may restore it.12
It is well-established that Temporomandibular Joint disorders (TMD) are characterized by pain and impaired masticatory function. The Integrated Pain Adaptation Model (IPAM) suggests that increased orofacial pain modifies motor activity, via the neuronal sensorimotor network of the brain. There is a consistent activation of the anterior cingulate cortex and the anterior insula, both pain-related regions. Moreover, both mastication and orofacial pain studies revealed there is simultaneous activation at the left anterior insula, the left primary motor cortex, and the right primary somatosensory cortex.13 The biopsychosocial approach to TMD has held back progress in understanding the neuro-pathophysiology of these conditions,14 despite that the neural pathway of craniofacial muscle pain has recently been described. A definite neural connection exists between the main Trigeminal sensory neuroanatomy, and the Trigeminal motor nuclei.15,16
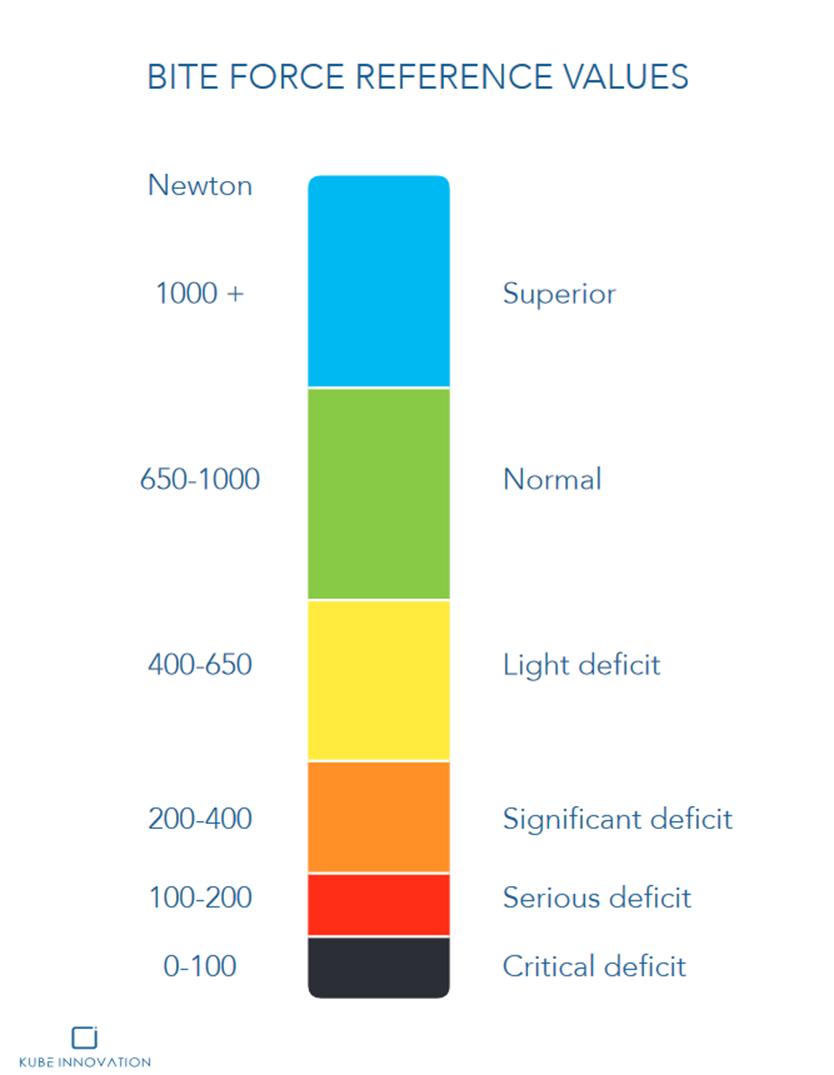
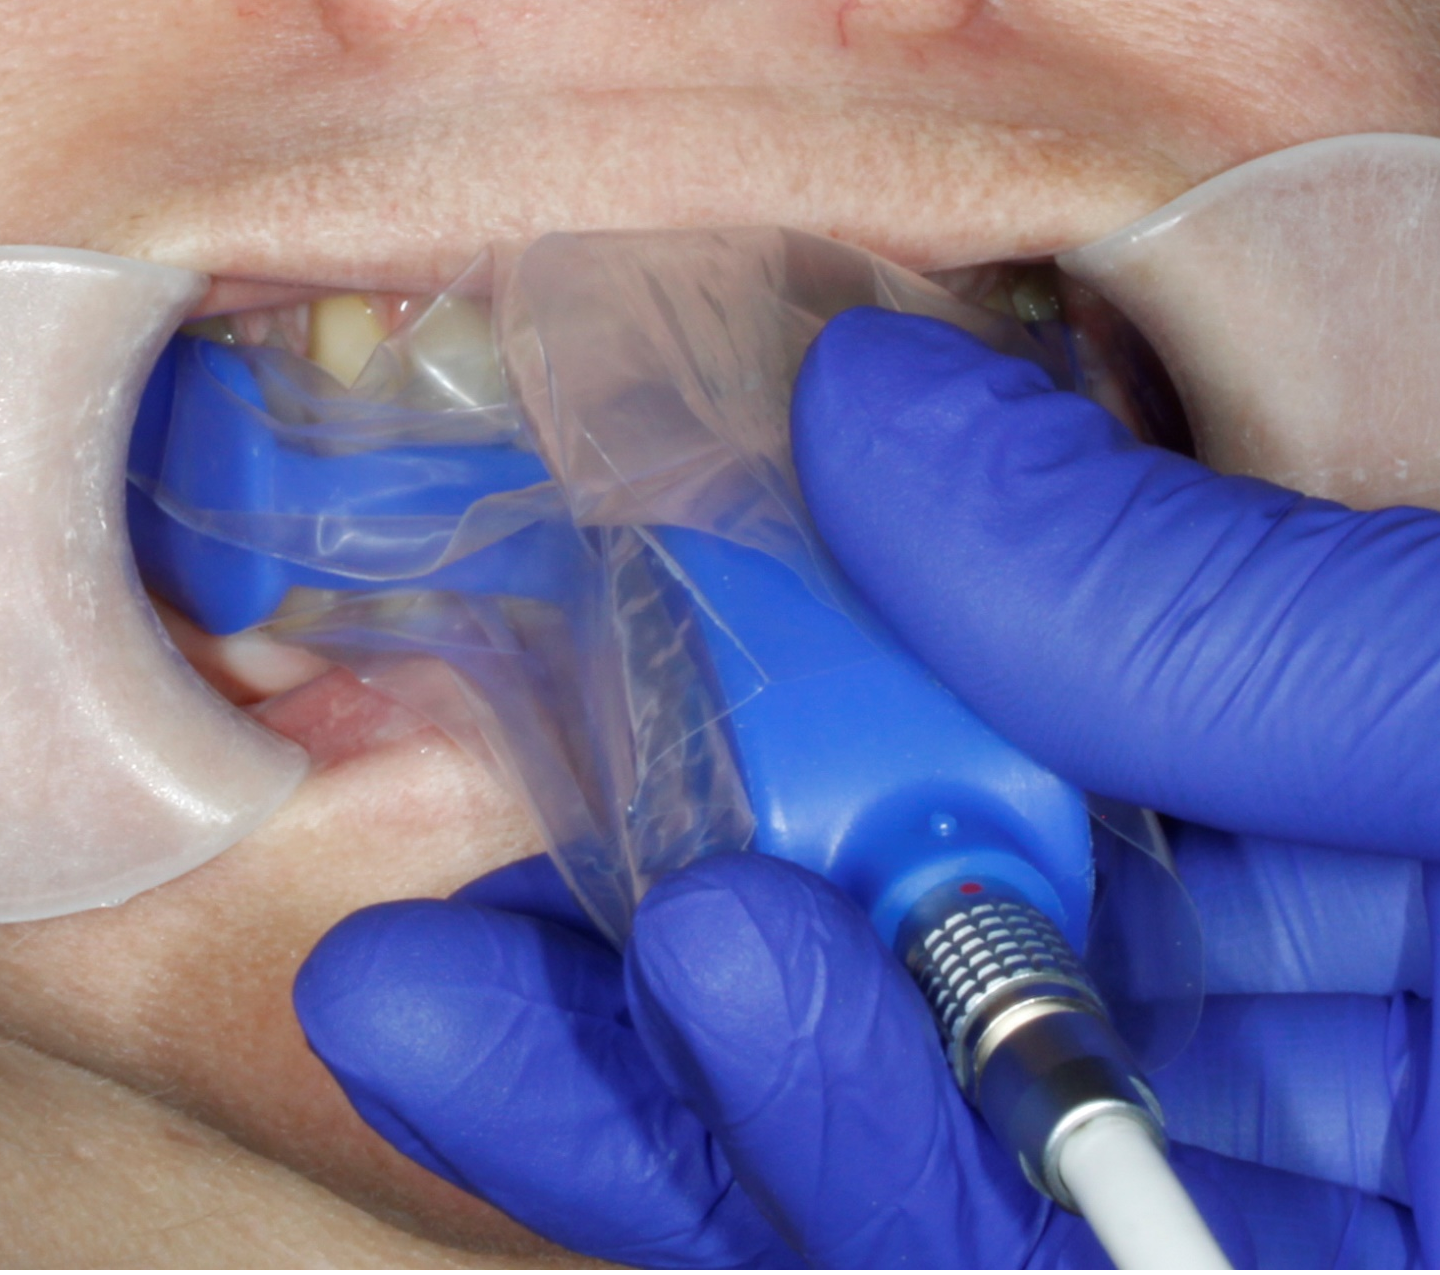
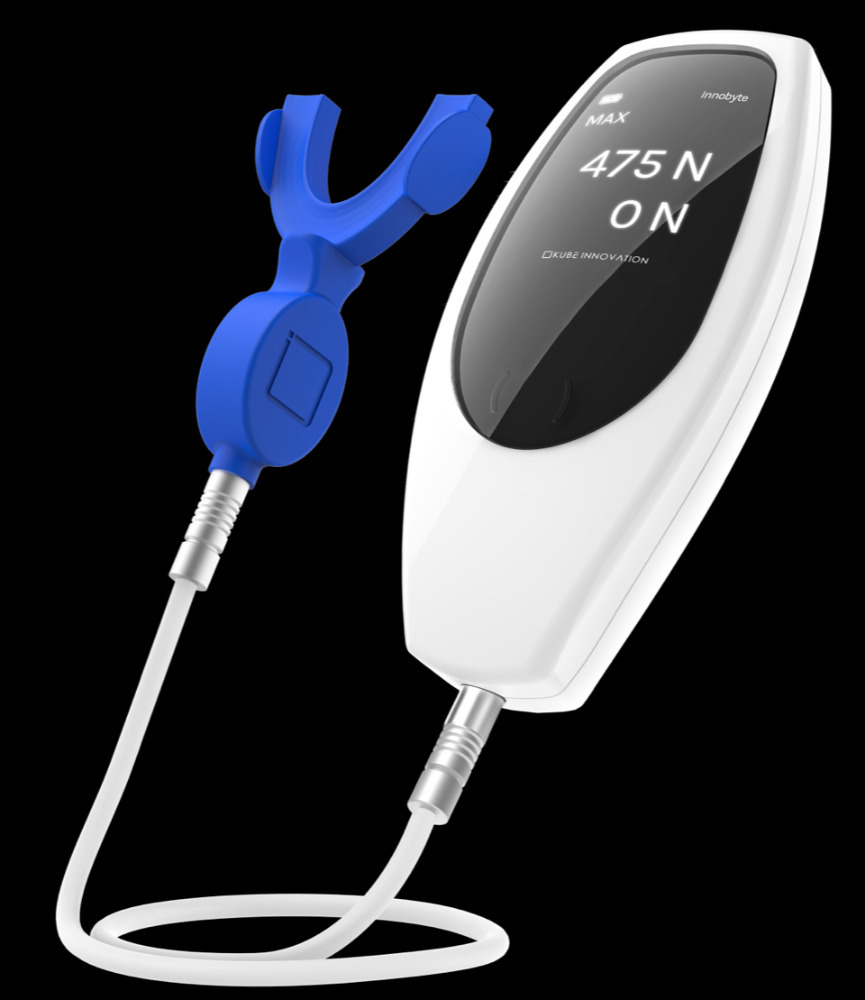
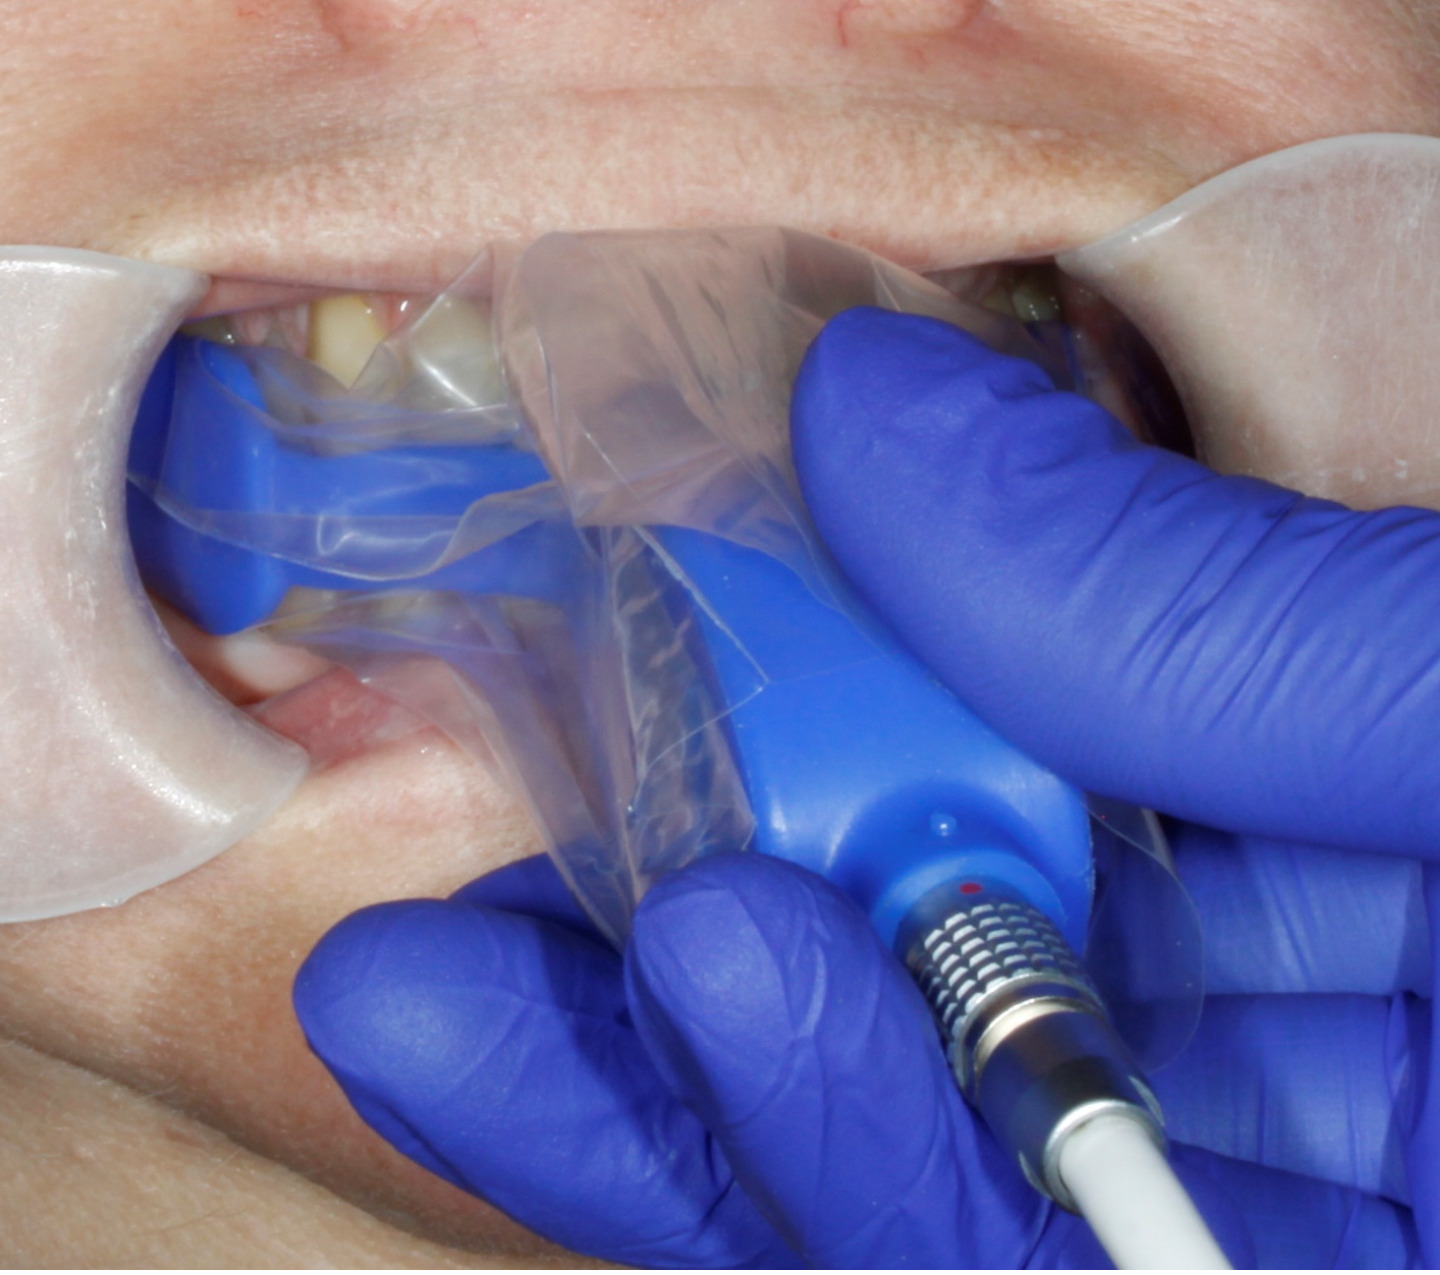
InnobyteTM is a Maximum Bite Force (MBF) measuring tool that reports MBF in Newtons (N) (Kube Innovation, Inc., Montreal, QC, Canada). The patient closes maximally into an arch-shaped silicone bite pad that sits between their teeth, to produce a MBF output in that is displayed on the InnobyteTM handle (Figure 1). The patient-produced MBF value is then compared to a Bite Force Reference Value chart (Figure 2). The MBF value is obtained by the patient biting maximally on bite pad (Figure 3).
.png)
Modern Digital Workflow procedures have been developed for all aspects of prosthodontics, including splint fabrication. Digitally-designed orthotics that are CAD-CAM produced have been described, 17 during which software occlusal prognostications are made from approximating Dicom files that are obtained during the intraoral scanning process. To date, these “occlusograms” have been somewhat tested for force level accuracy, by being compared to actual digitally-measured relative occlusal force levels recorded with the T-Scan 10 technology.18,19 Importantly, T-Scan accurately reproduces 256 relative occlusal contact forces across time,20–22 and its’ data can be used to guide occlusal adjustment procedures to reach high numerical occlusal function tolerance outcomes.23,24
However, whether digital orthotic design provides a high-quality occlusal contact force result has not been validated. Further, MBF levels in TMD patients have not been studied when the same patient’s MBF was tested under 3 differing occlusal conditions; not wearing an orthotic occluding in Maximum Intercuspation (Condition 1; Habitual Occlusion); wearing an as-milled, non-occlusally corrected orthotic (Condition 2; Unadjusted Appliance); and wearing an orthotic whose occlusal force profile was optimized with T-Scan force and timing data (Condition 3; Adjusted Appliance). As such, the Objective of this study was to quantify changes in Maximum Bite Force using InnobyteTM with orofacial pain subjects, measured in those 3 differing occlusal conditions. The null hypothesis is that no difference in MBF would be found between the 3 differing occlusal conditions.
Materials and Methods
30 successive Orofacial Pain patients that were to receive an orthotic from a known experienced and expert TMD clinician, comprised the subject pool. Subjects were clinically evaluated with Joint Vibration Analysis and Jaw Tracker technologies25 (JVA; EGN; Bioresearch Assoc., Milwaukee, WI, USA), and were diagnosed with Piper Class IIIa/b, IVa/b and Va/b internal derangements.26,27 Subsequent MRI exams confirmed the diagnoses of Stage 2 and 3 TM Joint internal derangements.28
Treatment anatomic orthotic appliances were fabricated digitally for each subject, after each subject was digitally impressed with the Cerec Omnicam (software version 4.6, on Sirona Inlab, version 20; Dentsply Sirona, Charlotte, NC, USA).17 The digitally designed orthotic was then milled from a polymethyl methacrylate (PMMA) disk, in a Sirona MCX5 milling unit (Dentsply Sirona, Charlotte, NC, USA). Each orthotic was fitted and adjusted to properly seat on each subject’s mandibular dental arch, but the occlusion was left unadjusted, until after the as-milled condition MBF was measured (2nd condition; Unadjusted Appliance). Then, T-Scan-guided-adjusting was performed to measurably balance the occlusal force distribution to = 50% right side-to-50% left side balance, +/- 5%/per side, with a centered Center of Force icon and trajectory (3rd condition; Adjusted Appliance).29
On the orthotic delivery day, the InnobyteTM measured 3 conditions per subject in the following sequence:
-
Condition 1. The Habitual Occlusion - the patient occluding onto the InnobyteTM pad only
-
Condition 2. The Unadjusted Orthotic - the patient occluding onto the InnobyteTM pad wearing the as-milled, but unadjusted appliance/orthotic
-
Condition 3. The T-Scan Adjusted Orthotic - the patient occluding onto the InnobyteTM pad and wearing the same orthotic after it was T-Scan adjusted.
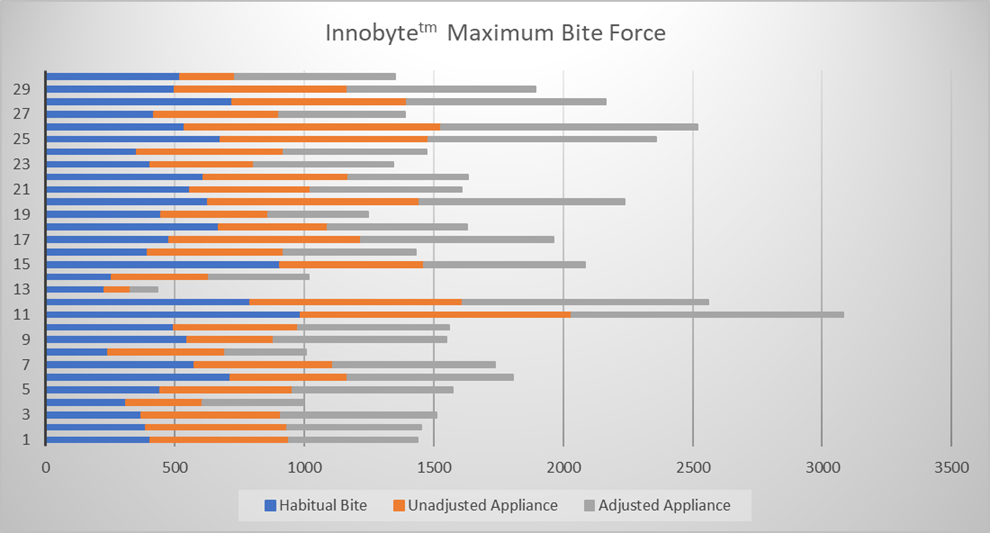
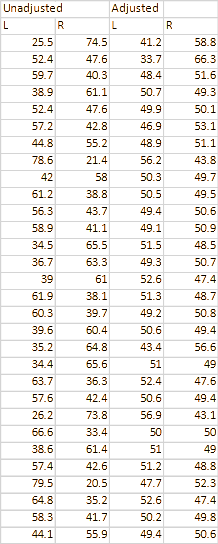
1 clinician adjusted all 30 orthotics using T-Scan guidance, and 2 dental assistants recorded all the InnobyteTM MBF values (Table 1). Then, all individual subject measurements per condition were compiled for statistical analysis. The time between each measurement was maintain constant for all participants, the habitual bite was taken at the beginning of the orthotic delivery appointment, the unadjusted bite was taken 10 minutes later, and the adjusted measurements were taken at the end of the appointment, once the orthotic was adjusted following a 45-minute tensing session with the QuadraTENS™ Unit (BioResearch, Milwaukee, USA). The InnobyteTM Maximum Bite Force (MBF) values per subject per condition, are presented graphically in Figure 4.

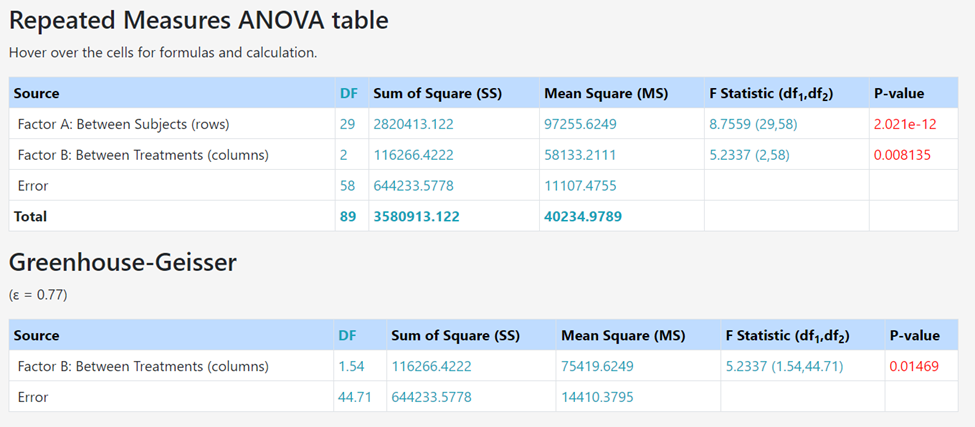
All statistical analyses were conducted online using Statistics Kingdom from Australia (website - https://www.statskingdom.com). A one-way repeated measure ANOVA (Table 2) compared the means of the 3 different conditions, and a Paired T-Test further established the differences between the 3 different conditions.
_indicated_that_there_is_a_significant_difference.png)
Results
The Bite Force recording were analysed with the one-way repeated measures ANOVA which detected a significant difference (p = 0.01469) between the Condition 1 mean = 519.17 N (Habitual Bite), the Condition 2 mean = 543.73 N (Unadjusted Orthotic), and the condition 3 mean = 604.67 N (T-Scan Adjusted Orthotic). The strong ANOVA p-value indicates that the Null Hypothesis was rejected, such that all 3 conditions were statistically different (T-Scan adjusted vs. the habitual bite, p = 0.002846; and T-Scan adjusted vs. the unadjusted, as-milled orthotic, p = 0.005882). The test priori power is strong 0.9899.
The post-hoc Paired t-test with a Bonferroni correction (α = .017) confirmed that the 3 condition means when paired against each other, were significantly different (Table 3, where x1 = Habitual Bite, x2 = Unadjusted Orthotic, x3 = Adjusted Orthotic). Moreover, the F statistic = 5.2337, was outside the 95% confidence level [-∞, 3.4999], and the observed size effect (η2) was small = 0.032, both indicating that the differences between the means per condition were small, but still statistically different.

This implies that the absolute bite force, in Newton, is significantly increased with the interposition of a digitally adjusted oral orthotic. Without these adjustments, there is no significant change in bite force.
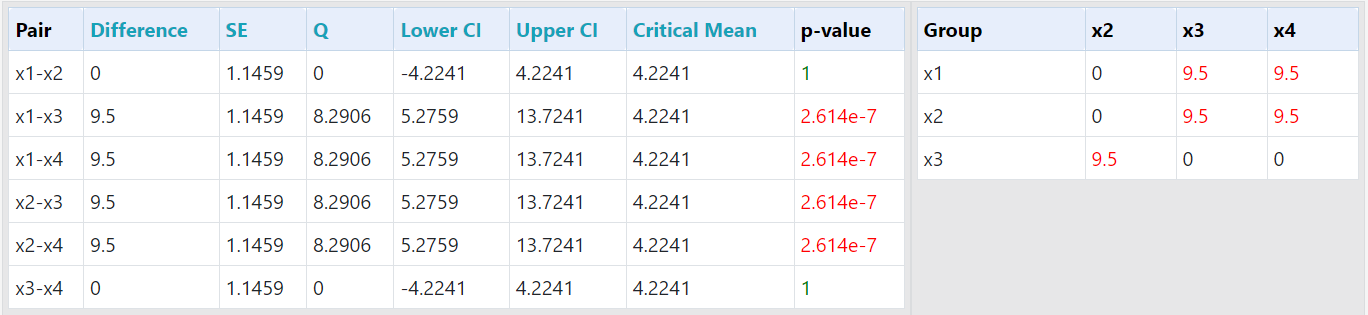
The Left to Right Percentage Distribution of the Unadjusted vs Adjusted orthotics was evaluated with Levene’s test, using F distribution df(3,116) (right tailed). The null hypothesis, that there is no difference in the percentage is rejected (p-value equals 1.01674e-11). the priori power is medium (0.6065)
The Tukey HSD / Tukey Kramer demonstrated that the variances of the following pairs are significantly different: x1-x3, x1-x4, x2-x3, x2-x4 (x1=Unadjusted Left, x2=Unadjusted Right, x3=Adjusted Left and x4=Adjusted Right in Table 4). The Tukey HSD/Tukey Kramer results are tabulated in Table 5.


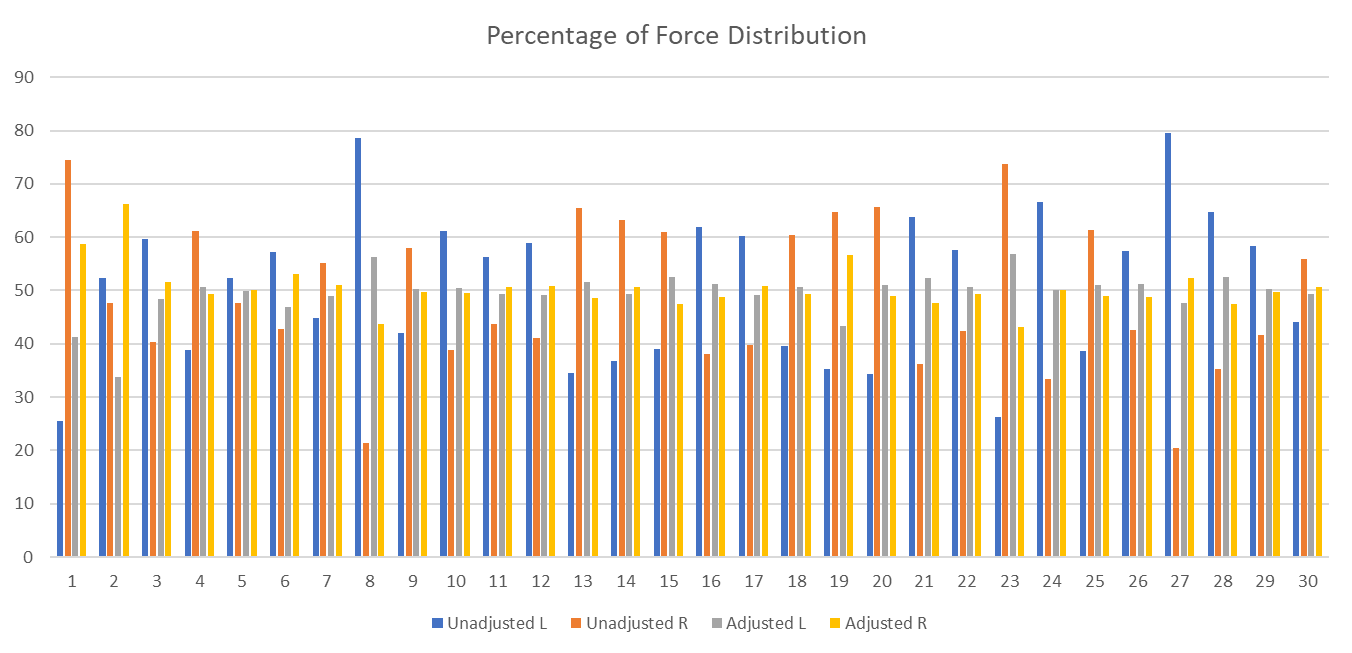
The 30 as-milled orthotics were unbalanced, compared to the T-Scan corrected orthotic balance, as tabulated in Table 4 and graphically represented in Figure 5. The difference indicates that the digital production of the orthotics using the CEREC occlusogram information, produced non-ideal occlusal outcomes, that still required T-Scan guided occlusal adjustments to truly optimize.

Discussion
This Results of this retrospective cohort study of Orofacial Pain/TMD patients, with stage 2 and 3 internal derangements illustrated that statistically significant increases in MBF were obtained with digitally measured and computer-adjusted orthotics. The MBF increase was an immediate response to the T-Scan-guided occlusal treatment, as the 3 conditions were recorded in the same orthotic delivery appointment per subject.
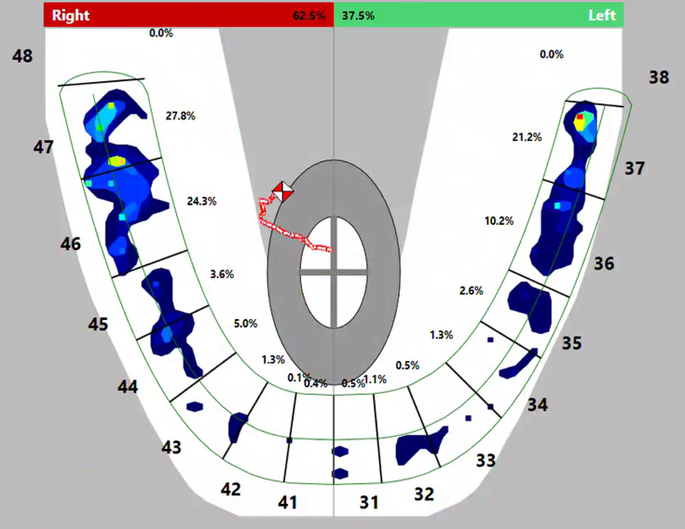
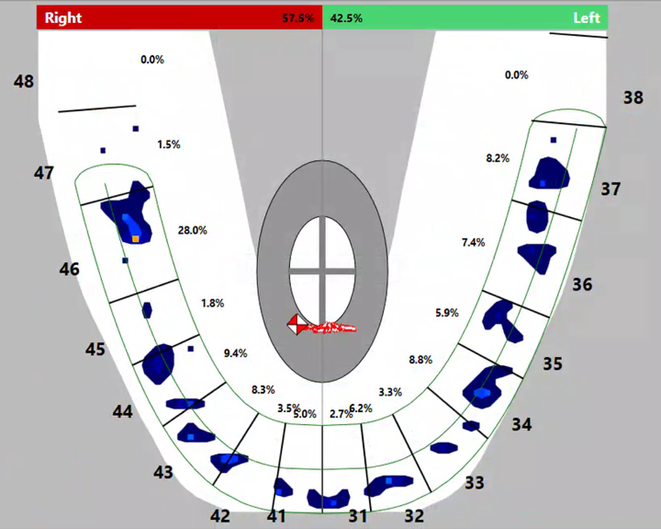
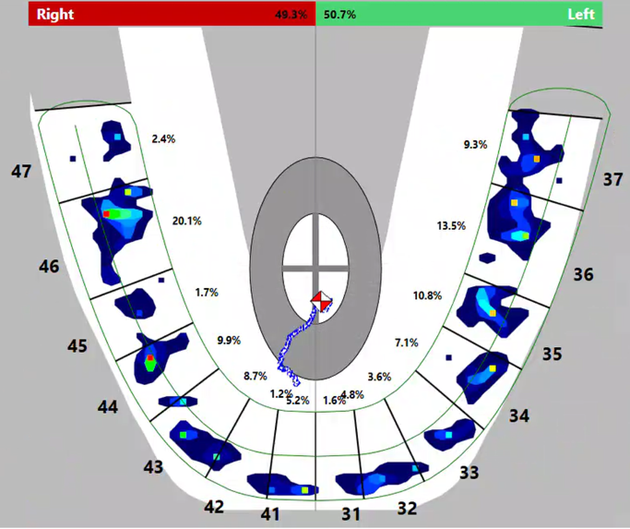
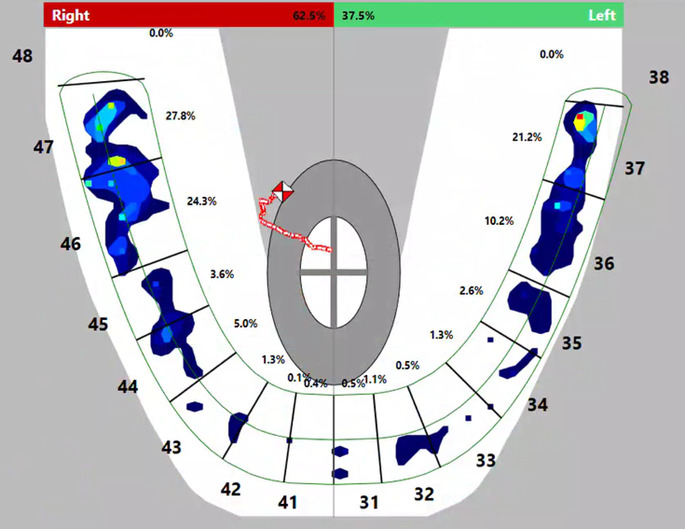
The initial MBF habitual bite recording represented each subject’s chronic orofacial pain diseased TMD state. An example of one subject’s habitual occlusion T-Scan data (Figure 6) shows the Center of Force as uneven, located posteriorly, and favoring the right side (62.5% right - 36.5% left). This study’s findings depict there is a relationship between muscular weakness (lowest MBF levels with habitual bite) and the occlusion, with statistically significant MBF increases occurring when orthotic occlusion was optimized with T-Scan’s high-tolerance, digitally and numerically guided occlusal adjustments. The mean MBF increase resulted from a measured change in the occlusion, that induced bio-functional neuro-reprogramming in the 30 TMD subjects, which can be graphically observed in Figures 6-8. In Figure 7, with in this subject’s T-Scan data, the unadjusted orthotic was asymmetric with the Center of Force located anteriorly, favoring the right side (57.5% right- 42.5% left). Alternatively, in Figure 8 (the same study subject’s T-Scan adjusted orthotic), the Center of Force was centered, with the occlusal forces more evenly distributed after the orthotic was digitally adjusted (49.3% right - 50.7% left). Of note is that other authors have demonstrated MBF improvements with anterior repositioning appliances,30 which are consistent with this study’s Results.


An important finding of this study was, despite digitally designing the occlusion within the Dentsly/Sirona Inlab CAD-CAM system occlusogram, a truly balanced occlusion did not result when the orthotics were measured intraorally with T-Scan. The data is tabulated in Table 4 and illustrated in Figure 5. Digital design alone is not entirely sufficient to create a clinically balanced occlusion. In this study, further occlusal refinements were required with T-Scan-guided occlusal adjustments. This finding corroborates another study that reported occlusal discrepancies between the appliance’s digital design and when digitally the appliance was measured intraorally.31 In the presented study, this difference was clinically relevant, as the digitally measured and adjusted occlusion resulted in significant MBF increases that lessened the subjects’ dysfunction.
The term chronic orofacial pain has been defined with difficulty by the dental profession. It refers to a temporal condition lasting at least 3 months, with pain that occurs more than 15 days per month, and lasts more than 4 hours per day.32 Recently, the conditions included in “chronic orofacial pain” were catalogued in the “International Classification of Orofacial Pain”,33 which relied on signs and symptoms, and time of onset and duration, which poorly describe the neuropathophysiology of the various conditions included under the term “orofacial pain”. This classification used solely descriptive diagnostic criteria to define masticatory muscle dysfunction, absent of objective, quantitative, and biophysiological measurements.34
Dental medicine should objectively define the parameters of normality to properly define dysfunction. Defining health parameters is one of the major and elusive challenges of dental medicine and orofacial pain. Normality remains the most important biostatistical value in bioresearch.35 This analysis requires quantitative objective data to be compiled within a normalized healthy population.36 Biometric tools that could help determine normality exist, but their use in dental medicine has not been universally adopted.2 The inability of the dental profession to simply define occlusion is quite revealing.37,38 The Glossary of Prosthodontic Terms defines occlusion as “the static relationship between the incising or masticating surfaces of the maxillary or mandibular teeth or tooth analogues.”39 This definition is obtuse, for it fails to consider the complexity and the dynamic aspects of mandibular motion, mandibular excursive function, and lacks inclusion of the neurophysiology of the act of occluding.
The integration of digital biometrics provides an objective mean to objectively assess the efficiency of therapeutic interventions, while enabling a better understanding of any pathophysiology through objective quantitative data analysis. It will be essential for of Dental Medicine to adopt these technologies as diagnostic aids in daily practice to greatly enhance a clinician’s ability to diagnose and treat objectively with clarity far beyond “signs and symptoms”.
Limitations
One important limitation was the absence of control subjects. However, the subjects were their own controls, forfeiting many possible confounders when comparing inter-subject data. The only condition that changed per subject between InnobyteTM MBF recordings, was the insertion of an oral appliance (with and without measured occlusal adjustments). All else remained the same within one data-gathering appointment. Therefore, each subject’s measured outcome had little influence from “other variables”, with solely the orthosis being responsible for the increased MBF levels. These same measurements could be performed on a much larger subject group while being compared to control subjects, to further validate this study’s Results.
Conclusion
The InnobyteTM objectively quantified significantly increased maximum bite force levels in internally deranged TMD pain subjects, after an anatomic oral orthotic was inserted and digitally measured and adjusted to high tolerance numerical outcomes with T-Scan data. In this 30 subjects pool, improved stomatognathic physiologic function was obtained by measurably optimizing the orthotic’s occlusal force distribution.
Statement of conflicts
No conflicts were reported.
Statement of funding
No funding was provided by any source for this study.