


INTRODUCTION
The dynamics of moving the lower jaw can be expressed by its position (relative to the maxilla), its velocity, its acceleration, and the smoothness of its movements, which are all produced by the active and passive forces generated by joints, ligaments, and muscles acting on the mandible.1–6 The resultant forces and torques move the mandible with six degrees of freedom (DOF) in relation to the skull, three translations (vertical, anteroposterior, and lateral), and three rotations (yaw, pitch, and roll).7 If the condyles and the interposed disks of both joints maintain articular contact all the time with the fossa (no distraction), translation of the condyle in a direction perpendicular to the articular surface of the temporal bone is restricted. Furthermore, if both joints are assumed to be connected rigidly through the mandibular symphysis, the rotation of the mandible about an anteroposterior axis is also limited to lateral motions away from the mid-sagittal plane. Thus, whereas the mandible can be moved within 6 DOF, the extent of some of those motion degrees is very limited.
Electrognathography (EGN)
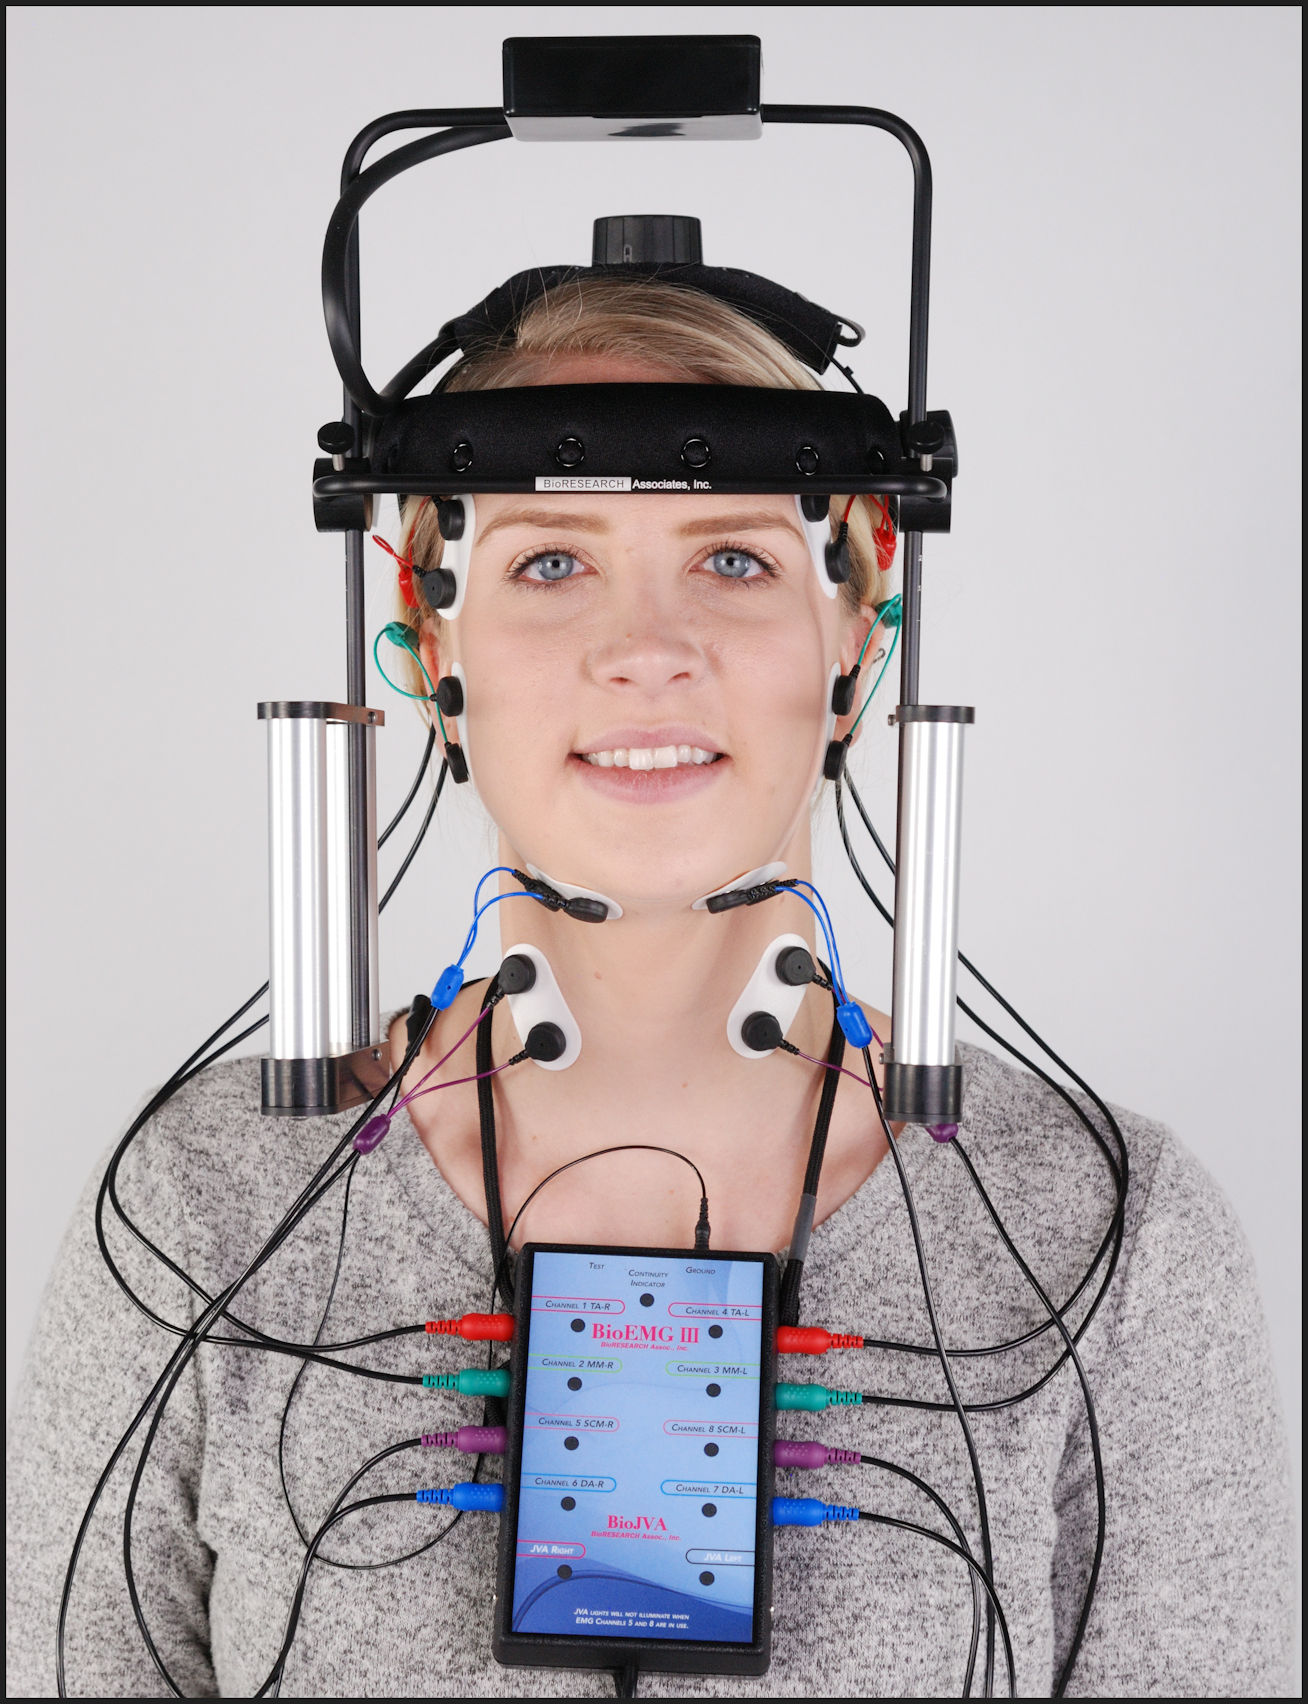
EGN records and displays mandibular movements using a jaw tracking magnet attached to the mandibular incisors, placed in the labial vestibule by using a flux-sensing array. Three dimensions of movement can be measured: Vertical, Antero-posterior, and Lateral translations.8 EGN + electromyography (EMG) studies can be carried out using the model JT-3D Jaw Tracker together with the BioEMG III (BioResearch Associates, Inc., Milwaukee, WI USA). Similar equipment is also manufactured by Myotronics (Seattle, WA USA), although it lacks the sophisticated mastication analysis program (BioPAK) developed jointly by BioResearch and Professor Takao Maruyama of Japan.
Each muscle contraction is associated with force, which is applied between the insertion and the origin. Each muscle can produce a translation force between the upper and lower jaws only along its line (or lines) of action. A rotation can also be produced about an axis approximately perpendicular to it and together represent two DOF, one translation and one rotation.6 Hence, the number of DOF of a system of muscles depends on the number of independent lines of action. A fan-shaped muscle such as the temporalis, can apply forces to its insertion in a wide variety of directions, depending on which part of the muscle contracts. Jaw movements produced by the masticatory muscles are guided by both active and passive structures. A mathematical model of muscle contraction dynamics widely accepted in musculoskeletal analysis is called Hill’s Muscle Model,9 which has been periodically updated.
The muscles of mastication are involved in moving the mandible while chewing, swallowing, and during speech. They include the temporalis, masseter, medial pterygoid, (elevators), lateral pterygoid, and anterior digastric (depressors), all of which develop from the mesoderm of the first brachial arch and hence are innervated by mandibular division of 5th cranial nerve. In conjunction with the above muscles, the buccinators (VII), suprahyoid muscles including the posterior digastric (VII), stylohyoid (VII), mylohyoid (V), geniohyoid (XII), and the eight muscles of the tongue (X and XII) all contribute to mastication. The infrahyoid muscles, the sternohyoid, omohyoid, sternothyroid, and thyrohyoid (innervated by the Ansa Cervicalis, C1–C3) stabilize the hyoid bone and actively contribute to the facilitation of both mastication and deglutition. The masticatory system is very complex, and chewing is a highly coordinated task for the central nervous system (CNS). The task of mastication is learned, and a toddler’s mastication usually does not even begin to mature until about the age of 3 years.10 Mature mastication is accomplished by a multiplicity of muscles, directed by seven of the twelve cranial nerves with some cervical nerves contributing too. Figure 1.

The significance of masticatory (chewing) motion can be understood by considering three important aspects of it
The purpose of the Average Chewing Pattern (ACP) is to cancel the expected random variations from cycle to cycle within a chewing pattern sequence, reveal the mean size and mean shape of the underlying pattern of function, and provide a measure of the variability of the pattern (the standard deviation). Normal control subjects produce ACPs that closely match the Mean ACPs previously developed, the black lines in Figure 2. Conveniently, the overall shape of the dysfunctional ACP is usually distorted and does not match the mean ACPs (black lines) in any dimension. See Figure 3. Three changes are commonly associated with dysfunction; (1) the size of the ACP decreases, (2) the velocity is reduced, and (3) the variability of the chewing pattern is increased by dysfunction.8,11 The duration of the chewing cycle (cycle time) is extended by most types of masticatory dysfunction as the patient chews more slowly and more tentatively.12,13 When subjects successfully adapt to their dysfunction one or two of these factors (size, shape, or speed) can be restored to more normal values, but usually not all three.11 Masticatory function after very successful adaptation sometimes appears to be within normal limits, with only increased variability and jerkiness. An objectively measurable increase in presence of exteroceptive suppression, silent periods (SP) occurring during gum-chewing is caused by interfering occlusal contacts. For a patient with no complaints and without excessive Silent Periods, no treatment is indicated, even in cases where dysfunction has previously been very well documented. Of course, the asymptomatic well-adapted dysfunctional patient is unlikely to ever seek treatment for TMD.


The process of averaging removes the variability from the ACP view that is visible graphically in the raw movement data.14 Consequently, the excessive variability that is caused by dysfunction is most visually obvious in data graphs that show the raw data. Since every cycle must include open-close in the vertical dimension, the vertical motion tends to be less visually indicative of dysfunction. The Horizontal View, combining the Antero-posterior and Lateral dimensions, provides the best visualization of excessive variability in the raw data.8 The variability reflects the patient’s continuous seeking but not finding an efficient movement pathway for mastication. See Figure 4. However, the standard deviations of the numerous quantifications in the ACP Summary are the most precise indicators of variability.
_dysfunctional_subject__(b)_normal_control_.jpg)
The significance of masticatory muscle function can also be understood by averaging
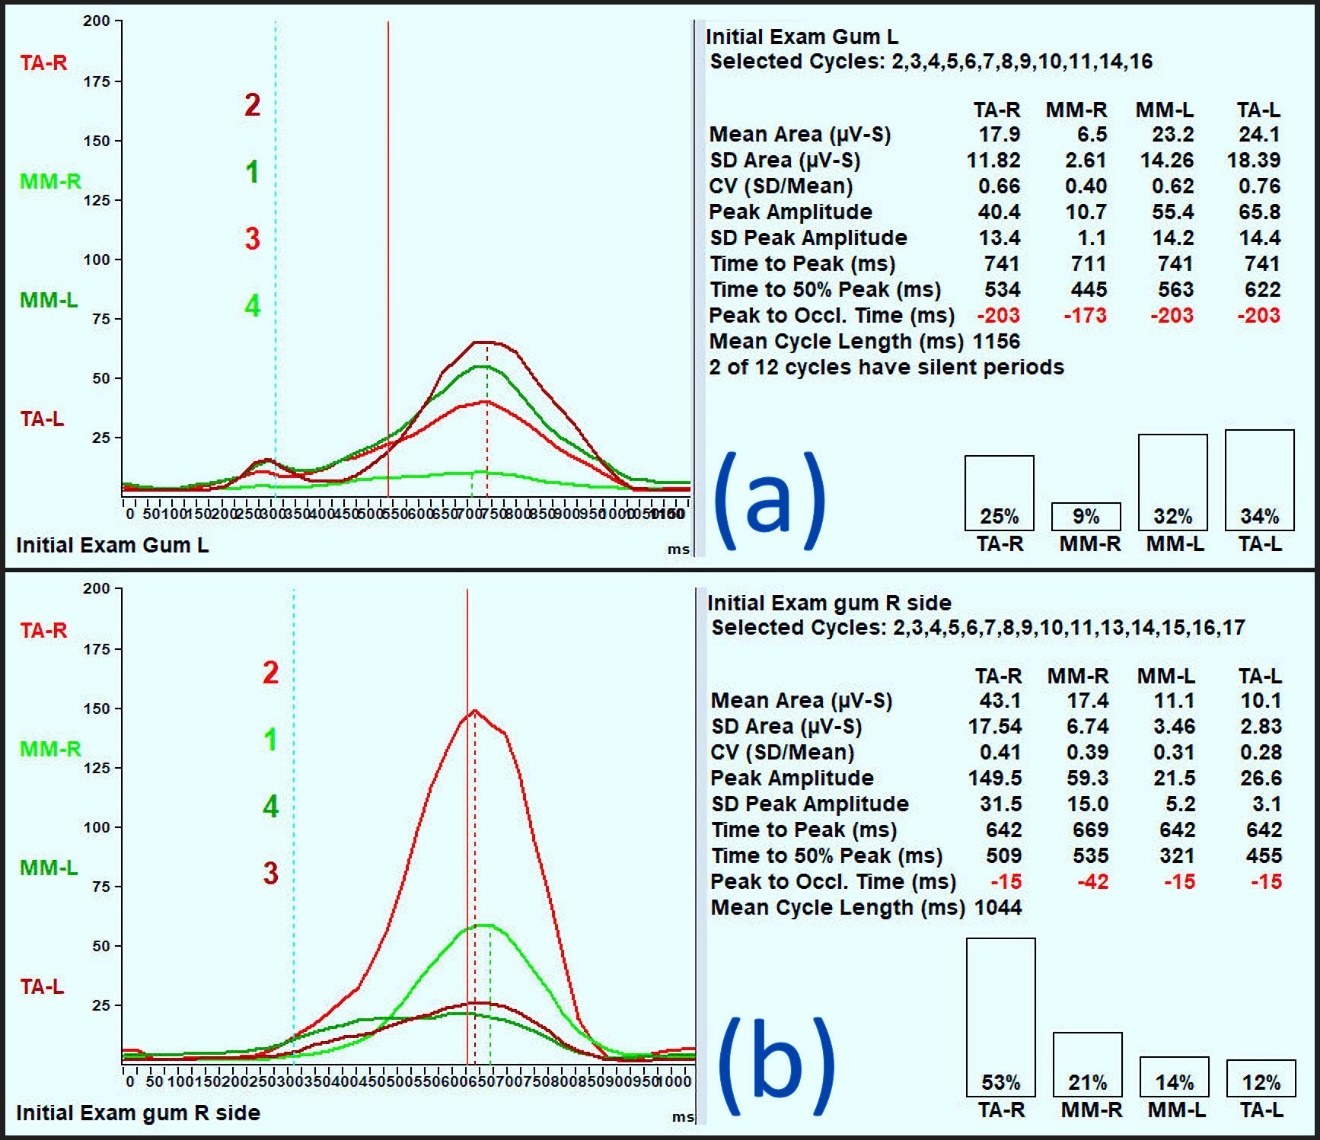
The Average Chewing Cycle (ACC) of the masseter and temporalis muscles can be calculated by averaging the EMG activity cycles over a sequence of 10–15 chewing cycles.8,11 To accomplish that, a complete sequence must be divided into individual cycles from the movements, and continuous instantaneous rms values calculated for each muscle for each point in every cycle throughout a sequence. Then, 10–15 cycles are averaged to create an ACC of the muscle activity. This process removes the random variations between individual cycles, reveals the underlying shape of the contraction pattern, provides a measure of variability (coefficient of variance), and reveals the hierarchy of muscle activity between the four muscles. It is particularly interesting to observe the masseter and temporalis activities since they are the largest muscles that actively apply most of the closing forces that crush food.15 Although the medial pterygoid is not recorded, its activity tends to parallel that of the masseter.
A normal pattern of muscle activity has been demonstrated by recording and combining a control group of Class I asymptomatic subjects during chewing. The most active muscle is the working side masseter muscle (W-Mm), followed by the working temporalis muscle (W-Ta), followed by the nonworking temporalis muscle (NW-Ta), and finally, the nonworking masseter muscle (NW-Mm). In Figure 5a the Left side pattern is ideal, but the right side is somewhat adapted. It is relevant that when chewing on one side normally the contralateral side masseter is given a rest. This allows the healthy patient to randomly chew left and right, back and forth, without fatiguing any of their muscles. However, in dysfunctional subjects the NW-Mm may be overworked and develop a painful response.

In the presence of a malocclusion or an internal derangement (ID), the mean area per cycle (integrated muscle activity) is increased (most often due to longer cycles), but the Peak Amplitude may be decreased. The hierarchy of the activity distribution (Ta vs. Mm) is more likely altered by a maxillo-mandibular skeletal mal-relation than by a simple tooth-related malocclusion. Furthermore, the variability of an individual’s muscle pattern is increased with masticatory dysfunction.11 With dysfunction, the ACC is often modified more for cases that are not well adapted than for those that are well adapted, but the ACC is still modified in all cases of adaptation to any dysfunctional condition. Although the patient is dysfunctional bilaterally, Figure 5b reveals a poorly adapted left-sided gum-chewing sequence (a) and a better adapted right-sided gum-chewing sequence (b).

The ACC shows a patient’s characteristic pattern of muscle function, including a) the intensity of each muscle’s average contraction, and b) the hierarchy of the activity from the most active to least active muscle (W-Mm, W-Ta, NW-Ta, and NW-Mm), which represents the coordination pattern. In a superimposed view of each muscle’s activity, the inconsistency of the activity is clearly visible. See Figure 6.

In the dysfunctional subject, this hierarchy of muscles can be changed rather dramatically. In cases of severe muscle dysfunction, the nonworking side muscles may be working more than the working side muscles. In mild dysfunction, the increased variability may be only in the one or two muscles necessary to adapt to a less-than-ideal situation. In severe dysfunction, the variability will be very high because the patient simply cannot find any coordination pattern that works well. For example, although the working temporalis is very active during mastication, in the dysfunctional subject of Figure 6, there is no discernable consistent pattern to the W-TA muscle activity.
Muscle dysfunction and pain most commonly accompany temporomandibular disorders (TMDs), whether from an occlusal interference, an occlusal breakdown, or a skeletal misalignment problem. While masticatory muscle pain is common in TMD, it is very rare that a painful masticatory muscle has a primary myopathy or neuropathy. That finding almost never occurs! The pain is usually secondary to a problem or condition outside of the painful muscle. The phenomenon of pain referring from the true site of the disorder to an often-remote other location has been well documented.16–18 Just eliminating occlusal interferences, or a maxillo-mandibular skeletal mal-alignment will usually allow the restoration of calm muscle function, creating a more restful neuromusculature, and leading to a neuromuscularly competent maxillo-mandibular condition.
The significance of silent periods during gum chewing
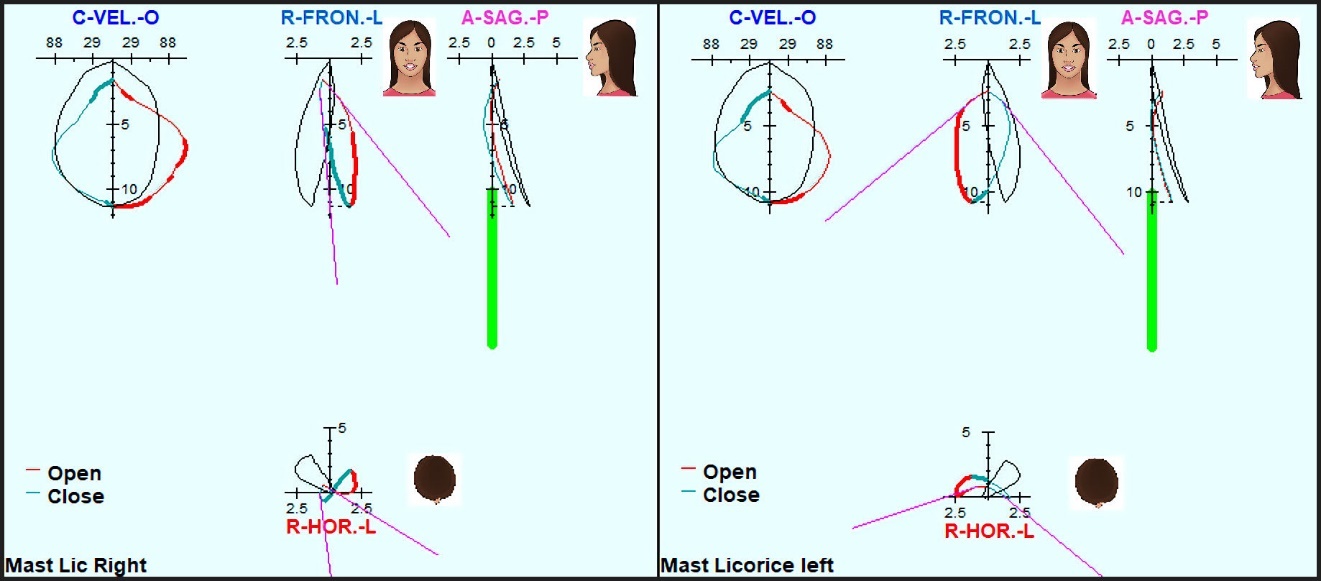
Exteroceptive suppression (SP) is produced by a nociceptive (protective) monosynaptic (local) neural reflex triggered by nerves associated with the periodontal ligaments.19 It is important to understand that in normal control subjects, gum-chewing occurs without any tooth contacts.20 A consistently occurring SP during chewing indicates one or more unavoidable tooth contacts. SPs can occur either during the end of closure as the teeth approach centric occlusion or at the beginning of the opening with the departure from centric occlusion. An SP represents hard evidence of an unavoidable occlusal interference, which can best be reduced or eliminated by Immediate Complete Anterior Guidance Development.11 The absence of SP does not necessarily mean zero interfering contacts because some patients are able to avoid lesser interferences. The avoidance of interfering contacts often requires awkward muscle contraction patterns that can contribute to muscle pains. However, when an SP is frequently present, it implies that the subject is unable to avoid at least one interfering premature tooth contact.20
The SP in the elevator muscles of the masticatory system suppresses elevator activity locally without any input from the CNS. SPs are commonly recorded only from the masseter and the temporalis, but that is due to those muscles’ accessibility to surface EMG, not because they are the only muscles involved. SPs occur during mastication when teeth contact with sufficient energy to stimulate the periodontal fibers attached to the specific tooth and are typically the result of aberrant contact during chewing. The contact may be on the working or nonworking side, but the effect of significant contact will affect all elevator muscles bilaterally. See Figure 7. Occasional SPs, in less than 10% of all cycles (< 3 SP in 30 cycles), are considered within the normal limits of errant pathways for control subjects. However, subjects with ideal function produce zero SPs.20
_is_a.jpeg)
Types of masticatory function
There are three general categories of function that have been observed: (1) Normal-normal includes patients with normal chewing movement patterns and with normal muscle patterns and hierarchy, (2) normal-abnormal includes patients also with a normal movement pattern, but with abnormal muscle function and with an altered contraction hierarchy (these patients are usually well adapted to a dysfunction, but may also have muscle pain) and (3) abnormal-abnormal with an abnormal movement pattern and abnormal muscle function (poorly adapted to a dysfunction). It is worthwhile to note that there is no documented case of a patient with an abnormal movement pattern and normal muscle function. Muscles are accommodative in nature, and the CNS often uses the musculature to adjust for structural deviations. Muscle is quickly adaptive but pays a price, usually with pain due to strained exertion.
AIM
The aim of this study was to evaluate the changes in masticatory timing and muscle function resulting from replacing a single missing 1st molar tooth using an implant-supported crown.
METHODS
A standard medical history and clinical examination were conducted to determine the status and eligibility of presenting patients seeking prosthodontic treatments according to the following criteria.
-
Inclusion Criteria: A need for prosthodontic treatment, willingness to participate, signed informed consent, and only a tooth number 36 or 46 missing.
-
Exclusion Criteria: Patients with systemic diseases, the presence of one or more identified symptomatic temporomandibular disorders, inability to chew gum prior to treatment, potential subjects with facial hair preventing EMG recording of the masseter and temporalis muscles.
The thirty prospective patients, selected from a continuous series of patients seeking prosthodontic treatments, who met all the criteria were selected and recorded with a magnet-based JT-3D jaw tracker, BioEMG III electromyograph and analyzed with the BioPAK version 8.80 computer program (BioResearch Associates, Inc. Milwaukee, WI USA). See Figure 8. Records were made prior to and after all the restorative prosthodontic treatments.
A magnet was secured in the labial vestibule with a Stomahesive® material. EMG surface electrodes were placed bilaterally after cleansing the skin over the masseter and anterior temporalis areas with alcohol. The subjects were recorded chewing gum first and then given a tough bolus (Chikki, a peanut-based candy) and directed to masticate separately on their left and right sides for at least 20 cycles each.
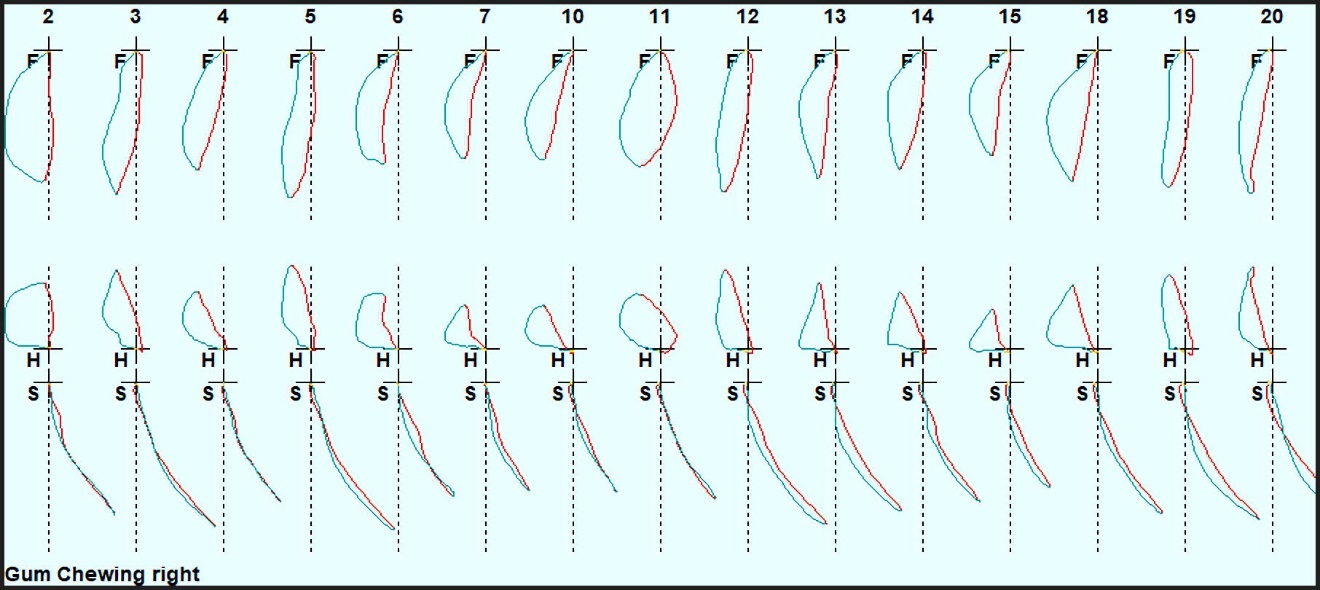
The Bio-PAK Computer Program automatically segmented each chewing movement sequence into 15 individual cycles. See Figure 9. Next, an Average Chewing Pattern (ACP) was calculated to reveal the underlying movement pattern. A summary was also created quantifying the motion numerically. See figure 10. Then, using the segmentation, the simultaneously recorded EMG activity was also averaged for each muscle to create the graph of the Average Chewing Cycle (ACC) of muscle activity. The EMG activities were also quantified with numerical ACC summaries. To provide a frame of reference, control subject data were also included in Figure 11 for contrast.


_the_effort_is_approximately_40___w-mm__.jpeg)
Certain numerical parameters that are calculated within the BioPAK program, extracted from the motions and the muscle activities, have previously been identified as indicating the presence of various masticatory dysfunctions.21–27 From the movement data, the Cycle Time, the Antero-posterior and Lateral Turning Points (most open position), the Maximum Lateral Width of the frontal movement pattern, the Peak Opening Velocity, the Peak Closing Velocity, and the Opening and Closing Jerkiness were all selected as parameters to be tested within this study.
For the EMG analysis six additional parameters were calculated for the combined activity of all four muscles: 1) the Mean Area representing the total effort (mean integrated activity), 2) the Coefficient of Variation of the mean integrated activity, 3) the mean Peak Amplitude of the activity, 4) the mean Time to 50 % of Peak Amplitude of the activity measured from the onset of opening, 5) the mean Time to the Peak Amplitude of the activity measured from the onset of opening, and 6) the mean time from the Peak Amplitude to the End of Closure.
All subjects included in this study sought prosthodontic treatment to replace the missing lower first molar tooth with an implant. The treatment included a single screw-retained crown. This study simply evaluated the subject’s ability to masticate prior to and after routine prosthodontic treatments. All data were statistically evaluated using Student’s paired t-test after confirming normality. An IRB exemption was granted. All treatments were provided following the recommendations of the World Medical Association Declaration of Helsinki. (α = 0.05 was chosen)
RESULTS
In the four conditions, whether with gum or a hard bolus, chewing on the left or right side, the mean antero-posterior Turning Point significantly increased (p < 0.05). In three of four cases the mean lateral Turning Point significantly increased as well (p < 0.05). In all four cases the means of the Peak Opening and Closing Velocities significantly increased after treatment (p < 0.05). The mean Maximum Lateral Width of the frontal ACP was only significantly increased for chewing a hard bolus on the right side (p < 0.00126). The mean Jerkiness of the masticatory movements was significantly reduced for both left and right mastication of a hard bolus (p < 0.05), but not for the gum bolus. The mean closing Jerkiness only achieved a significant reduction for right-sided mastication of a hard bolus (p < 0.035). See Tables 1, 3, 5 & 7.
The Mean Area values of the muscle activity for gum-chewing and for mastication of a hard bolus significantly increased for all four conditions (p < 0.05). The mean values of the Coefficient of Variation of the Mean Area were significantly reduced for all four conditions (p < 05). The Peak Amplitude of the muscle activity did not change significantly in any of the four conditions. The mean time to Peak Muscle Activity from the onset of opening was reduced in all four cases, but only the left gum-chewing reduction achieved significance (p < 0.0131). The mean Time to 50 % of Peak Amplitude was reduced significantly for the left-sided gum-chewing and the right-sided hard bolus (p < 0.05). The Time from Peak Amplitude to End of Closure significantly increased for all four conditions (p < 0.05). See Tables 2, 4, 6 & 8.
DISCUSSION
The significant increase in the mean Antero-posterior Turning Point can be seen as an improvement in the function as it changed towards a mean normal value.21 The changes in the lateral Turning Point reflect a more normalized shape in the ACP.21 In contrast, the Vertical Turning Point is mainly determined by the size of the bolus unless severe dysfunction is present to significantly reduce it. The increases measured in this study in the opening and closing velocities reflect the faster chewing and increased confidence.22 The significant increase in the mean maximum lateral width for hard right-sided mastication indicates and improvement towards normality of the frontal ACP. A narrow frontal ACP indicates a restrictive occlusion or bilateral translation limitations within the TMJs.23 Jerkiness is produced by alternating accelerations and decelerations.22 Normal control subjects ideally produce one acceleration and one deceleration during opening and the same during closing with each mastication cycle.25–27 Excessive accelerations and decelerations during mastication result from hesitancy and uncertainty with respect to the intercuspal position. Alternatively, excessive jerkiness can also result from major TMJ internal derangements.25–27
The Mean Area is the rectified, integrated activity of all four elevator muscles (bilateral masseter and anterior temporalis) and represents a good indication of relative total effort. The significant increases under all four conditions suggest increased confidence or reduced hesitancy of the group in their masticatory function.25–27 These changes were accompanied by reductions in the Coefficients of Variation for all conditions indicating more consistent activity.25–27 The Peak Amplitude of the muscle activity did not change significantly in any of the four conditions, probably because it is determined more by the resistance of the bolus than by any minor dysfunction.11
The shortened time to Peak Amplitude, although only achieving significance for the left gum-chewing, reflects the increased velocities of the motions. The Mean Time to 50 % of Peak Muscle Activity was shortened significantly in two of the four conditions. It is also related to the faster velocities and suggests increased confidence or reduced hesitancy in their masticatory function.25–27 The Time from Peak Amplitude to End of Closure is a key measurement of the subject’s confidence.23 In the worst-case scenario the value is negative as the subject waits until after the end of closure to apply maximum force to the bolus.
LIMITATIONS
Although 30 subjects were selected for this study, 14 subjects received a replacement for tooth number 46 and 16 subjects received a replacement for tooth number 36. It is possible that the side of the replacement may have interacted differently when selected as the chewing side during mastication. This difference may have been a confounding factor and may have altered the significance of one or more of the parameters measured. In a future larger study, the subjects could be separated into two groups, but in this case the separate samples may not have been large enough to be reliably analyzed separately.
CONCLUSIONS
By recording incisor-point motion and the masseter and anterior temporalis associated EMG activity that drives it, the dentist can have a better understanding of the functional or dysfunctional status of a patient’s masticatory system. From this discovery, a more appropriate treatment can be planned, and the post-treatment degree of success can also be objectively measured. Patients with the greatest masticatory dysfunction are the ones who can benefit most. The objectives of dental treatment can be advanced to include enhancing the patient’s masticatory function with complete comfort instead of being limited to the cosmetic ideal of just focusing on creating a beautiful smile.
Financial support and sponsorship
None
Potential conflict of interest
John Radke is the chairman of the board of BioResearch Associates, Inc.