INTRODUCTION
Intraoral scanners (IOS) have become commonplace in dental practice, often replacing traditional impression making procedures as a key initial step within the implant or restorative Digital Workflow. However, scanners are also claimed to have significant functionality that can visualize occlusal contact intimacy (closeness) and occlusal clearance when designing restorations through virtual cast articulation. Although this can be helpful in the restorative design process, virtual articulation and virtual occlusal contact representation does not contain any true occlusal contact force data, because IOS scanners gather tooth morphology optically with all teeth completely out of occlusal contact. Aligning the individually scanned arches is accomplished by scanning a buccal view of the intermaxillary articulation, using maxillary and mandibular buccal reference points that are processed with a mathematical algorithm.1–4 Since IOS systems capture no occlusal contact forces from between occluding or excursing teeth, how can virtual articulation diagnose occlusal force imbalance or perform occlusal adjustments at the delivery of scanned and milled restorations?
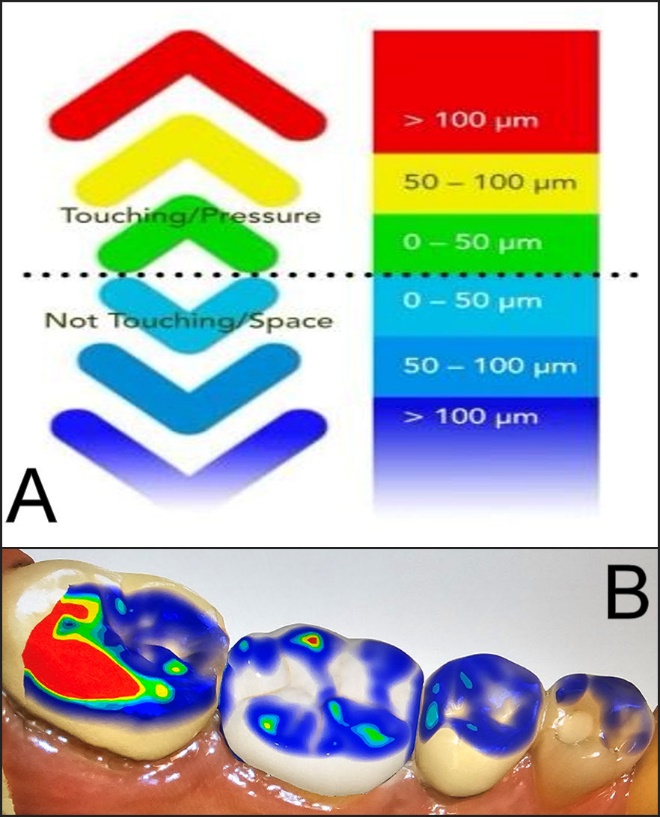
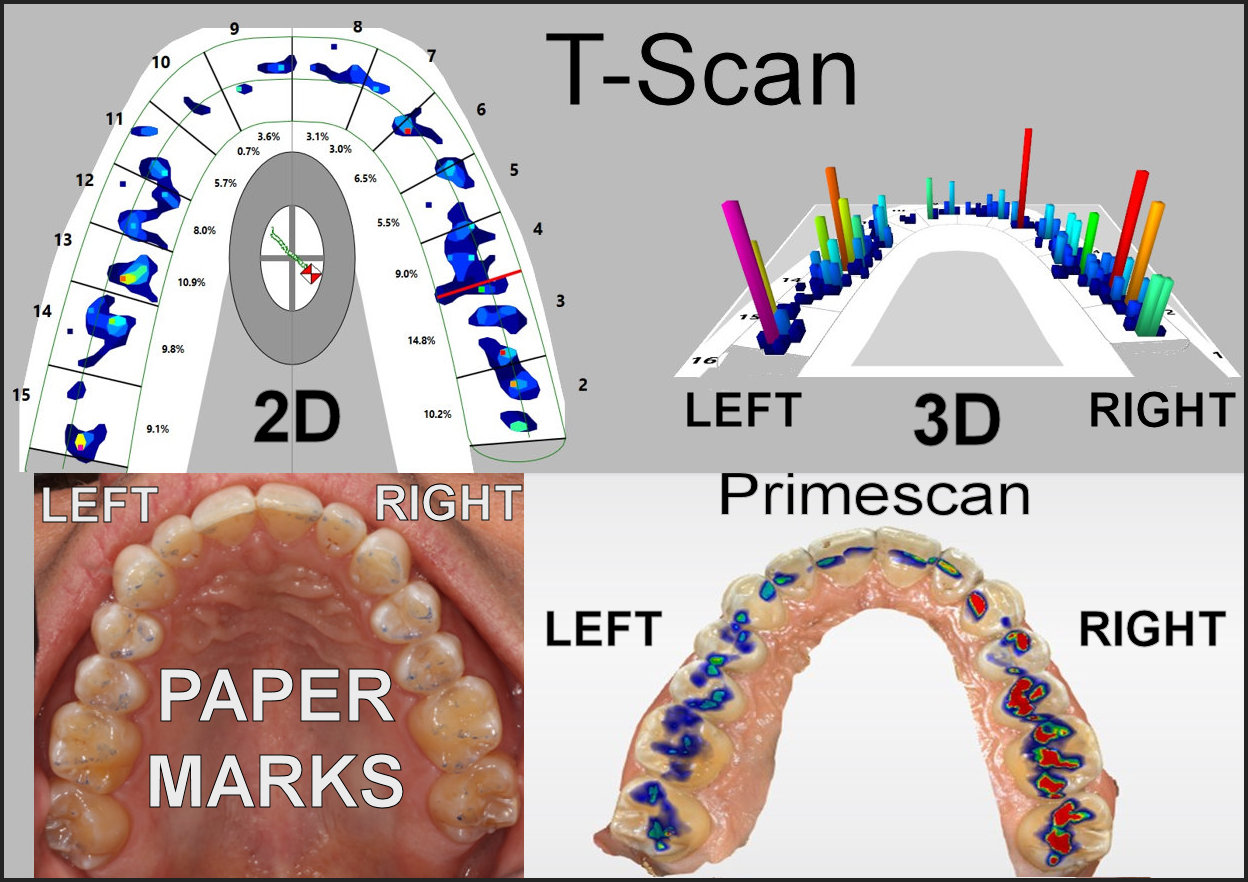
From the scanning procedure, the IOS software programs present occlusal contact intimacy (closeness) information to the clinician using color-coded distance scales that estimate “occlusal contact distances” between opposing arches (Figures 1A and B). Using scanners to make impressions of tooth preparations or implants apparently tolerates errors ranging up to 50-microns,5 which may be ameliorated by the crown adhesive or by final occlusal adjustments.
_primescan_6_color-coded_contact_intimacy_scale_ranging_from_contacts_being____100_micro.jpeg)
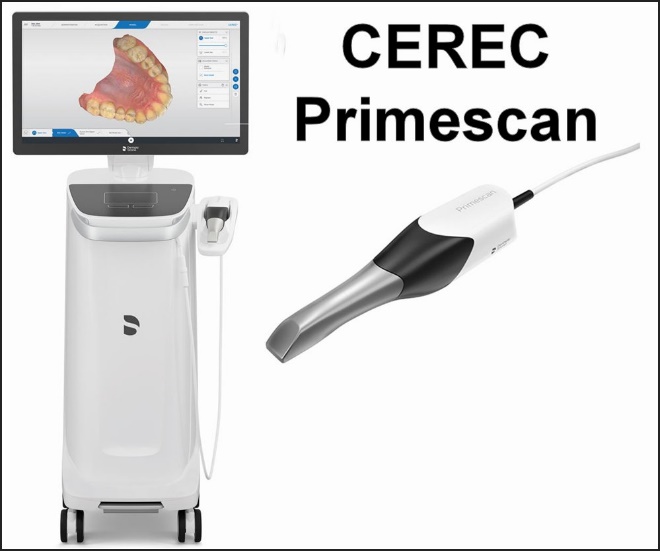
For this study, the CEREC Primescan scanner (Dentsply Sirona, Charlotte, NC, USA), with a resolution (digital step size) of at least 50 microns was tested, as in a previous comparison of 12 different IOS scanners Primescan was declared the “most accurate”.5 See Figure 2. Importantly, while a 50-micron deviation may be considered an acceptable spatial deviation for a crown preparation reproduced into an .STL file, that is an unacceptable distance error within the occlusion. When under occlusal compression, Periodontal Ligament (PDL) mechanoreceptor activation occurs within 1-3 microns.6 As no force measurements are made to create these occlusograms, their algorithmic suppositions crudely estimate occlusal morphologic intimacy. Further, most intraoral scanners are unable to replicate the occlusal contact loading sequence, nor report on the transitory force evolution that occurs when a patient occludes into MIP or performs excursive movements in real-time.
_and_the_computer_workstation_showing.jpeg)
With some similarity, the 6-degree jaw tracker MODJAW (https://www.modjaw.com/en/) uses external cameras to capture full mandibular motion across time and can apply that motion to CBCT scans of a patient’s mandible or a simulation in visual displays. Since the mandible is video-recorded extraorally with no interocclusal contact forces being recorded or measured, MODJAW manipulates the virtual mandible and reproduces its movements through space, illustrating changing occlusal contact intimacies without predicting any interocclusal forces. This does not provide the clinician with precise actionable data from which to make an accurate complete arch or individual tooth occlusal force diagnosis, prior to making occlusal adjustments.
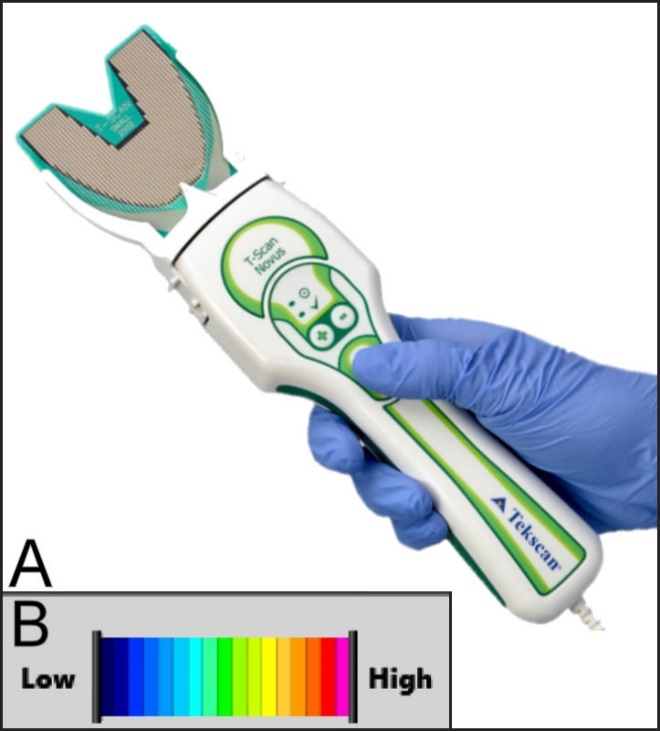
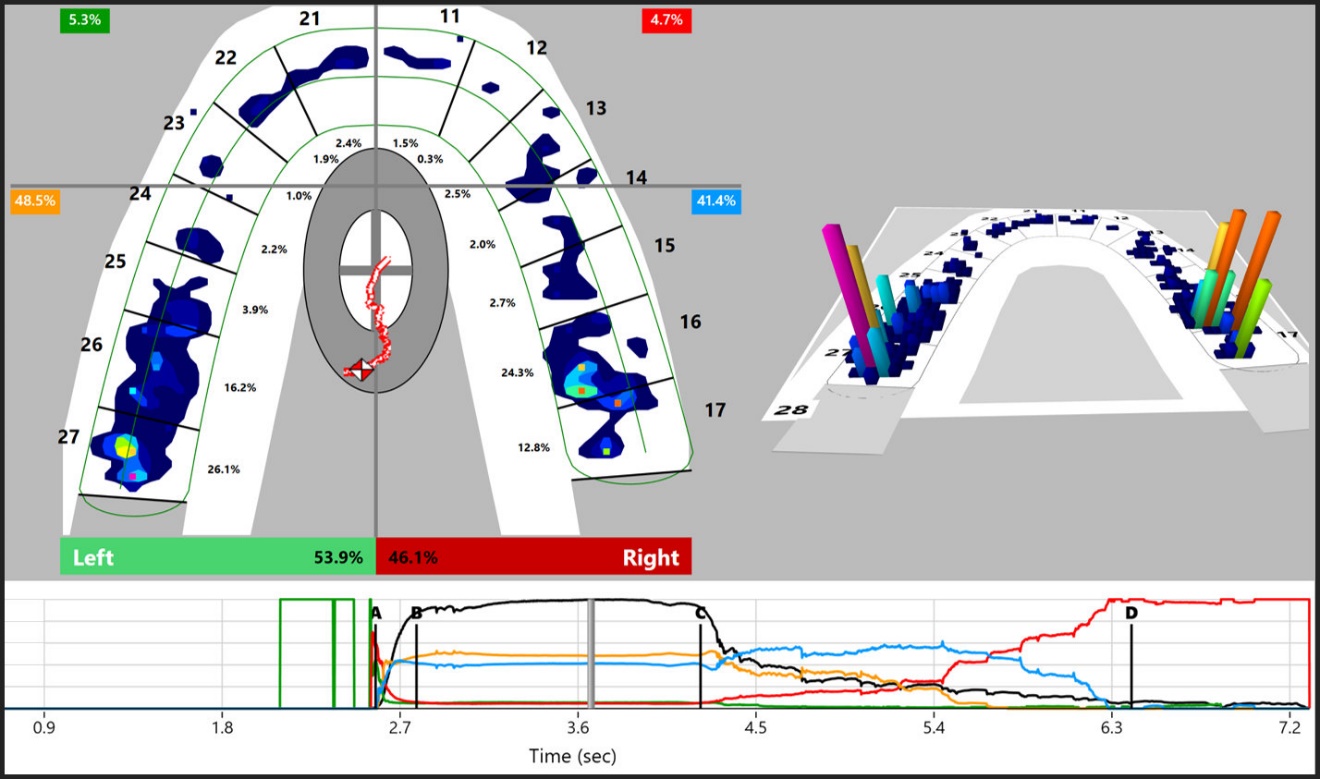
Unlike IOS, the T-Scan 10 Novus technology (Tekscan, Inc. Norwood, MA, USA) utilizes an 18 color-coded relative occlusal force scale to describe 256 interocclusal contact force levels that evolve over time as teeth intercuspate into MIP or frictionally engage during excursive movements. See Figures 3A and B. This real-time occlusal function data is recorded from within contacting or excursing opposing occlusal surfaces with high-precision thin, flexible variably conductive pressure sensors (Novus HD sensors, Tekscan, Inc., Norwood, MA, USA). The recorded data is displayed for playback time-based and/or force-based analyses on the T-Scan 10 desktop. See Figure 4. Multiple studies have determined that HD sensor force capture and timing capture is highly repeatable.7–13 Additionally, many patient treatment studies show T-Scan force and timing data can guide both time-based and force-based occlusal adjustments that optimize muscle physiological health, reduce occlusal dysfunctional symptoms, reduce occlusal forces on overloaded teeth, prosthetic and dental implant restorations, and reduce orofacial muscular pains.14–33
_the_t-scan_10_novus_recording_handpiece_and_flexible_conductive_ink_high_definition_(hd.jpeg)

Recent comparison papers attempted to correlate differing IOS occlusograms to T-Scan data.34–36 In one, articulating paper markings were also used as a 3rd occlusal indicator.34
The Methods attempted to relate 3 very different occlusal contact datasets:
-
The T-Scan 10 records 256 relative occlusal contact force levels in real-time as those forces spread out over opposing occlusal surfaces from where teeth make interocclusal contact.7–13,37
-
IOS scanners geometrically project estimated contact intimacy distances from algorithmic image approximation.1–4
-
Articulating paper marks contact areas with ink, influenced by tooth shape, mobility, and the thickness of the paper or foil.38
Unfortunately, these inherent physical reporting differences make for impossible comparisons.37 For example, IOS systems do not have a built-in force measurement feature, and their capacity to record and reliably report actual bite force levels has never been established.37 Further, one study reported the spatial resolution of the Cerec Omnicam (Dentsply Sirona, Charlotte, NC, USA) was far inferior to that of the T-Scan HD sensor.36 However, it has been well established in multiple studies by multiple authors that the T-Scan system provides proportional (relative) bite force levels repeatedly and reliably,7–12 providing a quick and precise method for identifying the distribution of tooth contact forces.13 Other authors reported T-Scan can be a promising clinical diagnostic screening device for determining and improving occlusion after diverse dental treatments.39
Although articulating paper/foil marks contact surface areas with ink, the marks do not inform the clinician which contacts are force-overloaded or time-wise problematic, because ink mark size (contact area) doesn’t measure any occlusal forces. Carey et al., in 2007 found that contact size (area) and occlusal force levels had only a 14% correlation.40 And quite problematically, clinicians have been shown in 4 separate studies to choose the wrong high and low force contact marks approximately 90% of the time.41–44 This means that regardless of a paper’s perceived marking ability, the ink markings themselves are an insufficient guide for dentists to use when adjusting occlusal contacts. Importantly, T-Scan data can guide clinicians to choose the correct force-wise and time-wise problematic contacts. And although clinically T-Scan and articulating paper are used together, it is the T-Scan that accurately detects the problematic occlusal contact paper markings that are the only ones adjusted.45
Unfortunately, clinician confusion exists because IOS occlusogram color-coded data “appears” very much like T-Scan 10 color-coded 256 relative occlusal force level data, despite that IOS contact approximation data is algorithmically calculated after upper and lower teeth are optically scanned with all teeth apart and completely out of any occlusal contact.
OBJECTIVE
The Objective of this study was to test whether contact approximation from intraoral scanners (IOS) can accurately describe relative occlusal forces with their color-coded contact distance scales. The Null hypothesis: No significant difference would be found between IOS scanner occlusal force estimates and the T-Scan 10 occlusal force measurements.
METHOD AND MATERIALS
Thirty-one patients had their upper and lower arches IOS scanned by one operator using Primescan, which generated color-coded occlusogram displays. At the same appointment, the operator properly set each subject’s Novus HD Sensor (Tekscan, Inc., Norwood, MA USA) Sensitivity level, and then T-Scan recorded relative occlusal forces from each subject as they firmly closed into their maximum intercuspal position (MIP). Finally, each subject’s MIP Intercuspation was marked with 23-micron articulating paper (Accufilm, Parkell Inc., Farmingdale, NY, USA). See Figure 5.
__primescan_display_of_occlusal_contact.jpg)
Proper T-Scan Recording Sensitivity Setting
To gather accurate T-Scan relative force data, each subject’s Sensitivity level was set before recording actual study data. Properly setting the Sensitivity ensured the HD sensor’s upper limit electronic Digital Output (DO) matched each subject’s top level bite strength, resulting in a few pink sensels being reported at maximum HD sensor compression. “Pink” indicates an unknown amount of Digital Output located where there were the highest occlusal contact force. By limiting the numbers of pink sensels with the proper Sensitivity level set per subject, all other 2200 sensels per sensor reported known Digital Output amounts that were characterized by the T-Scan 10 color-code scale: pink and red for highest forces, green to orange for medium forces, and blue shades for low forces (see Figure 2A). Once each subject’s Sensitivity Level was correctly set, the single operator then recorded the actual T-Scan 10 study data. Note that in Figure 5 there is only one pink sensel visible (#15 DL), and in Figure 6 only two pink sensels are visible (#6M and #3D; #13M is a red sensel).
Since the T-Scan system’s accuracy and reliability have been repeatedly documented, being the single most thoroughly tested system for accuracy and reliability when measuring relative occlusal forces,7–13 the T-Scan was designated as the “gold standard” for the purpose of analyzing the IOS estimates. However, because it has been repeatedly documented that articulating paper marks are not useful to accurately determine occlusal forces,41–44 paper markings were not analyzed for force within this study. Thus, 67 possible high-force contacts in the right arch-half and 56 possible high force contacts in the left arch-half (indicated by T-Scan and/or Primescan), generated a total of 123 occlusal contacts that were analyzed for agreement between Primescan and T-Scan.
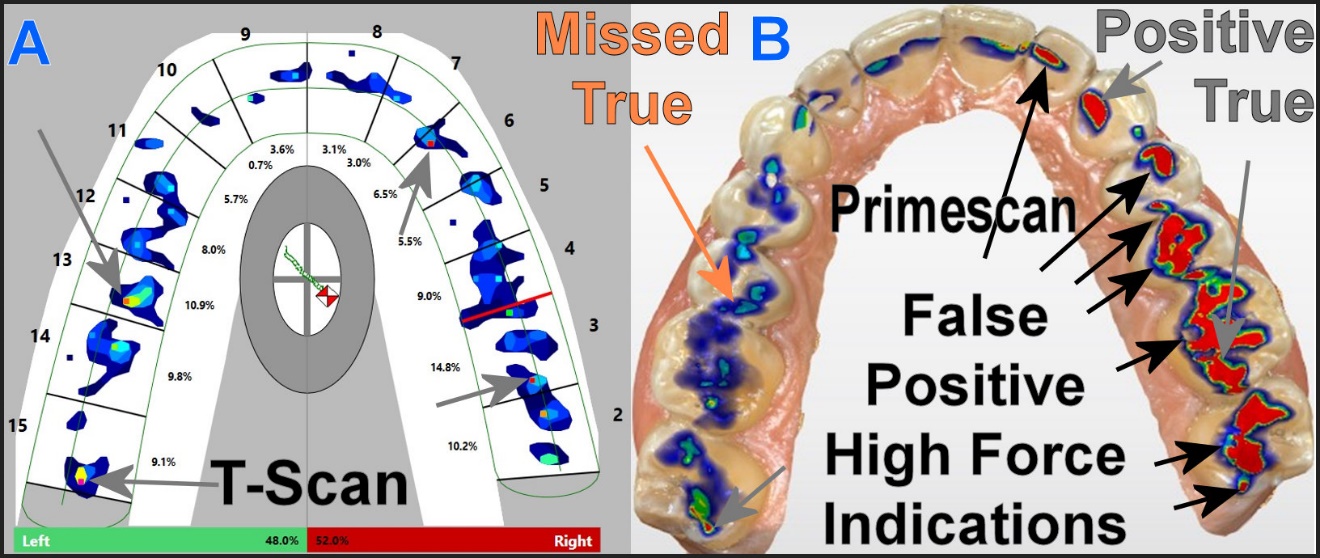
For the T-Scan, red and pink colors depicted the highest contact forces. The red colored areas of the Primescan display estimated the closest contact intimacies, and possibly the highest force contact areas. The agreement between T-Scan and Primescan was limited to the same tooth on the same arch-half, and not specific to the exact contact point or points on each tooth, and only to areas indicating high forces. In cases where there were differences in the numbers of contact areas on a single tooth, these differences were ignored to simplify the analysis. An example of comparing one subject’s T-Scan high force data to Primescan can be seen in Figure 6.
Statistical Analysis
Since all data were binomial (high force or low/no force), the Chi Square test with a 2X2 contingency table and a Yates correction were chosen to detect any significant differences between the Primescan estimates and the T-Scan measurements (alpha was chosen = 0.05).
To illustrate the likelihood that random chance agreements could contribute to the appearance that a stronger correlation existed between T-Scan and Primescan, a true Random Number Generator produced 67 true random numbers, which were serially assigned to the right-arch half’s 67 contacts. This compared chance agreement with the right-sided T-Scan high force data (the random even numbers) and low force/no force data (the random odd numbers). The results from the Random Number Generation were Chi Square evaluated for significance in the same manner as were the Primescan estimates, and were used to calculate Primescan’s Sensitivity and Specificity for the detection of high force occlusal contacts.
RESULTS
On the right arch-half, there were 31 high force contacts detected by T-Scan, but 57 (26 others than T-Scan) were reported by Primescan, for a right arch half total of 67 (31 T-Scan + 26 Primescan). Using T-Scan as the Gold Standard, 22 of the Primescan indications were true positive (correct) and 35 of them were false positive (incorrect) force comparisons. Agreement between Primescan and T-Scan on which teeth had high-force contacts occurred only 38.5% of the time (p < 0.00774). Only one indication by Primescan was a True Negative (correct), 9 indications by Primescan were False Negatives (incorrect), and 35 were False Positive indications (incorrect). See Table 1 and Figure 6.
On the left arch-half 34 high force contacts were identified by T-Scan and 32 reported by Primescan. However, high force agreement between T-Scan high force contacts with Primescan occurred on only 14 occlusal contacts (41% were true high force; p < 0.00643). Primescan data agreed with only 4 of the 24 teeth that it claimed had no contacts, or 18%. There were 18 False Positive indications and 20 False Negative indications from Primescan. See Table 2.
Analysis of Diagnostic Reliability
Combining both sides, the sensitivity of the Primescan was calculated at 55% for detecting high-force contact points. But Primescan labeled 45% of the T-Scan high force contacts as low force or no force. Inversely, Primescan falsely labeled 53 (91%) of 58 T-Scan measured low-force or no force occlusal contact points as high-force contacts. Primescan total Specificity and total Sensitivity were too low to be considered even useful (Specificity = 8.6%; Sensitivity = 55%). Primescan had a propensity to label many low force areas as high forces (False Positive indications). See Table 3.
Random Agreement
The agreement between true random number data and the right-side T-Scan data for the presence of high-force contacts was 35.5%, which is close to the 50% that would be expected by chance when comparing only two choices (high/low). This agreement was less than for Primescan (55%), but both were inadequate with respect to Sensitivity. Similarly, the agreement was 47.2% between the true random number data and the right-side T-Scan data, indicating an absence of high-force contacts. This agreement was 38.6% greater than for Primescan, but also very inadequate for Specificity. See Table 4. The comparison indicates that Primescan data were no more accurate than randomly assigning high/low values.
DISCUSSION
The results of this investigation coincide with earlier comparison studies with IOS scanners and T-Scan data, in that scanning teeth optically and spatially aligning them by contact approximation and intimacy distance is not an accurate predictor of occlusal contact force levels. This is because IOS systems do not have built-in force measurement features that record and report bite force levels within their occlusograms.34–37 Statistically, IOS data only correctly reflected the presence of high occlusal contact force levels 55% of the time (p < 0.00001). What was significantly worse was the occlusograms correctly indicated low or no force conditions only 8.6% of the time, resulting in a high percentage of False Positive indications (p < 0.00001).
A noteworthy finding was that Primescan had an excessive propensity to assign False Positive high forces labels to low force contacts or no force contacts (See Table 3), as was accurately reported by T-Scan.7–13 This means that IOS color-coded contact intimacies poorly correlated to actual intraoral relative occlusal force levels. Treating false high force readings from Primescan would require adjusting teeth that weren’t in hyper-occlusion. Therefore, it would be clinically advisable that IOS scanner occlusograms not be used to guide any intraoral occlusal adjustments.
Although words in the middle of the Primescan color scale suggest the red/yellow/green touching opposing occlusal surfaces are “under pressure” (denoted with “Touching/Pressure”), while colors that indicate the occlusal surfaces are not touching have no pressure because of space between the teeth (denoted with “No Touching/Space”), the color scale is in microns, estimating the distances between opposing teeth and no “pressure” whatsoever. The Results of this investigation clearly show that “Touching” itself does not always indicate the contacting teeth are under higher “Pressure.” Repeatedly, Primescan falsely reported higher “pressure” contacts where T-Scan measured the same contacts with moderate, low, or no forces.
What’s important is that this study’s findings can be extrapolated to all IOS scanners, because none of them gather occlusal contact impact data from between occluding or excusing teeth when in capture mode. This is because all scanners capture data with all teeth completely apart and out of contact. Importantly, scanning a buccal view of the intermaxillary articulation is processed with a mathematical algorithm, and not with occlusal contact impact pressure mapping data.1–5 Although buccal scans may reliably align digital arches spatially, the findings of this study indicate that correct spatial alignment cannot predict how contacting teeth generate occlusal contact forces.
Clinically, the IOS occlusal disparities detected in this study do not indicate whether crown margins will be accurately sealed or if restored proximal contacts require adjustments for proper floss resistance. Additionally, IOS does not account for “hit and slide” interferences, PDL compression or absence with implants, or reflex avoidance of unpleasant occlusal contacts that affect dynamic occlusion during closure or excursive movements; functional factors that the T-Scan technology can readily identify.
Using a true Random Number generation experiment that represented high-force with even numbers and low or no force with odd numbers, an expected 35% agreement occurred randomly with the high-force T-Scan data. This percentage is somewhat similar to the 55% results of Primescan’s agreement with T-Scan, which illustrated that in any binomial comparison there is a substantial risk of random agreement between variables. See Table 4. This difference of 20% cannot be attributed to the IOS because extensive testing would be expected to converge at 50%. However, testing IOS is likely to vary such that the exact relationship might result in being either closer to or farther from 50%. However, it is reasonable to conclude that the Sensitivity of IOS proximity data is inadequate for describing occlusal force levels.
The true random numbers produced a higher Specificity (47.2%) than the IOS (8.6%), although neither were acceptable. It appears that the Receiver Operating Curve for the IOS data was skewed towards increasing the Sensitivity at the expense of a much lower Specificity. IOS reporting 91.4% of the low or no force contacts as high force is clinically unacceptable.
The contact intimacy scale of the Primescan ranges across 100 + microns of tooth overlap or underlap with respect to the occlusion. This is an absurd amount of distance that obviously cannot physically exist while a subject is closed into the Maximum Intercuspal Position (MIP). Primescan’s red indications occurred frequently on teeth where T-Scan recorded no or low contact forces, producing in Primescan many False Positive indications of where high force contacts were located. Of note is that Primescan’s propensity to report false force levels was not considered in a previously published comparison of 12 different IOS scanners, where Primescan was declared the “most accurate.”5
LIMITATIONS
One limitation of all IOS systems is the step size of the data being optically gathered. Increasing the number of bits reduces the step size, but also increases the amount of data points needed. This comes into play when very small distances are estimated from digital images with fixed resolutions, being most troublesome when step size is significantly larger than the distance needing to be measured. T-Scan compensates for this limitation by including a procedure for the operator to adjust the amplifier Sensitivity (gain) in a continuous (analog) manner that minimizes the effect of step size before recording any study data.
Another possible limitation was that only one scanner system was evaluated. Even though multiple IOS scanners were not tested, this in no way lessens this study’s findings because no scanner can measure interocclusal forces by optically scanning the occlusal contours when all teeth are out of contact.
CONCLUSION
IOS occlusogram depictions do not accurately report occlusal forces with their visual color-coded contact approximation scales, being crude virtual algorithmic estimates of how closely opposing teeth approximate, absent of any measured occlusal contact forces. Based upon the large variability between the left and right Primescan data, and considering the fact that a true random approach was no worse, it is clear that an IOS method to estimate occlusal forces is just not possible. The null hypothesis was rejected.
STATEMENT OF CLINICAL SIGNIFICANCE
IOS scanner contact intimacy data and contact-to-contact spatial distances do not accurately indicate occlusal contact force levels, such that occlusograms should not be employed to diagnose occlusal force imbalances or guide occlusal adjustments. T-Scan 10 data should be used to make reliable force level diagnoses, having been shown in many treatment studies to be an accurate, effective therapeutic guide for making force controlling corrective occlusal adjustments
FUNDING
No funding was received from any source for this study.
DISCLOSURES
Ben A. Sutter operates a private practice in Eugene, OR USA, is an adjunct Professor UNLV School of Dental Medicine Department of Clinical Sciences and a member of the Vivos Faculty. USA. He has no financial arrangement with any dental manufacturer, and receives no compensation from sales of any dental product.
John Radke is the Chairman of the Board of Directors of BioResearch Associates, Inc., Milwaukee, WI, USA.
Robert B. Kerstein is a former Assistant Clinical Professor at Tufts University School of Dental Medicine. USA. He has no financial arrangement with any dental manufacturer and receives no compensation from sales of any dental product.