
INTRODUCTION
Historically, dentistry has focused far more on the cosmetic appearance of a smile rather than on the quality of masticatory function. A search of PubMed for “smile design” retrieved 1,948 titles since 1968, but a search for “quantification of masticatory function” retrieved no results. The same search of Google Scholar (the more complete database) for “smile design,” retrieved 94,000+ results, but just a few dozen publications measuring masticatory performance using various methods, with many of those publications from food science. The value of effective masticatory function has been mostly ignored in dental education when compared to the focus on creating beautiful smiles. Meanwhile a food science study has recently resulted in an Ease of Mastication Index to quantify mastication effort.1 These authors also concluded that: “…there is not much work describing the quantification of mastication effort as a quality grade.”
The smile focus in dentistry may have been developed by: 1) patients may request an improvement in their smile appearance more often than an improvement in their chewing ability,2 2) dysfunctional patients do not have a good reference to what constitutes good function, 3) the adaptability of patients varies greatly3–6 and 4) dentists do not have a simple way to judge the quality of the masticatory function of their patients.7 Patients’ complaints like; a) “I can’t chew gum because my muscles get tired,” b) “I only chew on my right (left) side,” and c) “I can only eat soft foods” are indications of masticatory dysfunction but do not reveal any specifics about their root cause. Previous studies have been unable to produce significant lasting pain just from extended gum chewing in asymptomatic subjects.8–10 Chewing is the primary function of the masticatory system. To document any improvement in masticatory function post-treatment first requires the ability to objectively evaluate it.
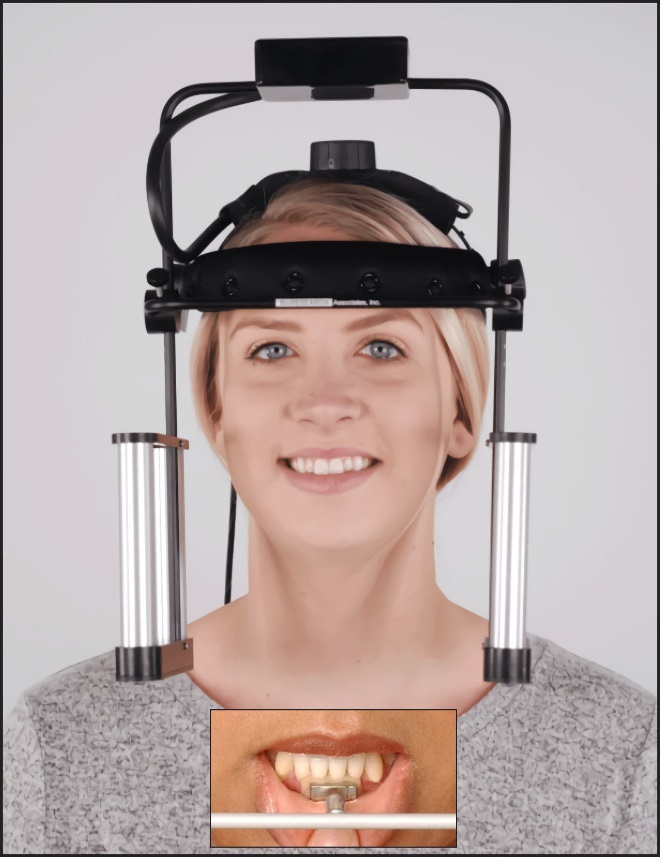
The current study was extrapolated from the metrics of the Average Chewing Pattern (ACP), which is produced from 3-dimensional incisor-point movement records of subjects chewing softened gum unilaterally for 15 to 20 complete cycles.11–16 See Figure 1. Software can then be used to calculate from the position data (in millimeters), the associated velocities in millimeters/second, accelerations in millimeters/second/second, and jerkiness in millimeters/second/ second/second.17,18 Additional mean values such as for opening angle, closing angle, opening time, closing time, occlusal time, and their variabilities can also be used in the analysis of masticatory function.19–22
OBJECTIVE
To develop a Masticatory Kinesiometric Index to reveal the quality of overall masticatory system function and the level of dysfunction present from a database of previously recorded incisor-point gum-chewing motion.
METHODS
One hundred sixty fully dentate subjects’ incisor-point motion records, 80 females and 80 males, 38.0 (+/- 15.29) mean years were randomly extracted from a database of patients diagnosed with symptoms of Temporomandibular Disorders (TMDs). All motions had been previously recorded from the JT-3D incisor-point tracker, (BioResearch Associates, Inc. Milwaukee, WI USA), which tracks a small permanent magnet placed in the labial vestibule. For control purposes, forty asymptomatic control subjects (20 F) were also extracted from a control database with a somewhat younger mean age of 33.4 (+/- 15.13) years, but the difference in mean age was not significant (p > 0.05). All subjects had been previously directed to chew softened gum separately on their left and right sides while their incisor-point motions were recorded in three dimensions and their bilateral masseter and anterior temporalis muscles were recorded with surface electromyography. A total of 400 records were extracted from the databases. See Figure 2. The EMG data of muscle function was not used for this analysis but may be used separately in a future analysis.
_an_example_of_a_typical_acp_from_a_control_subject._the_black_lines_represent_the_mean_.jpg)
While a tough bolus challenges the masticatory system and can reveal incipient dysfunction when present, one stick of softened gum was chosen as the standardized bolus in this study for the following reasons:
-
Softened gum has minimal resistance, is not consumed, and is preferred by subjects over Cuttersil.7
-
One fresh stick of gum provides a reproducible bolus volume and texture for comparison between sessions.
-
A sequence of 15 to 20 cycles of gum-chewing cannot induce fatigue within a masticatory musculature.8–10
-
Even relatively severe TMDs subjects can chew softened gum for 15 to 20 cycles.
A previous study used an eighth-order polynomial to estimate the quality of human chewing cycle.23 In the present study a first order polynomial with 13 terms was constructed to represent the relationship between the quality of masticatory function and 15 parameters of incisor-point motion data using coefficients calculated from the control group to provide the correct contribution of each term. See Figure 3. The 5th and 6th terms each combined two parameters into one term in the equation. The coefficients in the numerators reflected the upper, lower, or median limit values of each parameter extracted from the control dataset while those in the denominators adjusted the relative importance of each parameter. When parameters could vary both higher and lower than their ideal control values, the absolute value of any difference was used (terms 6, 11, 12 & 13). The following is the general form of the polynomial.

MKI= a−OTa+b−CTb+c−OcclTc+d−CycTSDd+TPV−TCPV−ee+|TPL−TCPL−f|−g+MOV−hj+MCV−kj+l−OJl+m−CJm+|MLW−n|−n+|FOA−p|−p+|FCA−q|−q
Units used for the terms were milliseconds, millimeters, millimeters per second, millimeters per second cubed (jerk), and degrees.
Abbreviations - OT = Opening Time, CT = Closing Time, OcclT = Occlusion Time, CycTSD = Cycle Time Standard Deviation, TPV = Turning Point Vertical, TCPV = Terminal Chewing Point Vertical, TPL = Turning Point Lateral, TCPL = Terminal Chewing Position Lateral, MOV = Maximum Opening Velocity, MCV = Maximum Closing Velocity, OJ = Opening Jerkiness, CJ = Closing Jerkiness, MLW = Maximum Lateral Width, FOA = Frontal Opening Angle, FCA = Frontal Closing Angle. The letters a through q are coefficients extracted from the analysis of the control group that were used to set the control group MKI value greater than zero and to adjust the contribution of each term to the MKI.
Definitions
Opening Time - The Opening Time was measured from the threshold at 0.3 mm vertically open with respect to the previous most crushed position and continued until reaching the Turning Point transition from opening to closing.
Closing Time - The Closing Time started at the Turning Point and continued to the threshold 0.3 mm vertically prior to the next maximum bolus crush position.
Occlusion Time - The Occlusion Time was measured from the end of closure to the beginning of the next opening.
Cycle Time Standard Deviation - The cycle time standard deviation incorporated the combined variability of the opening time, the closing time, and the occlusion time.
Turning Point Vertical - The most open point and the transition point between opening and closing.
Terminal Chewing Position Vertical - The maximum bolus crush vertical position distance to the intercuspal position.
Turning Point Lateral - The lateral position at the most open vertical position or transition between opening and closing.
Terminal Chewing Position Lateral - The maximum bolus crush lateral position distance to the intercuspal position.
Maximum Opening Velocity - The average maximum velocity occurring at any point during opening.
Maximum Closing Velocity - The average maximum velocity occurring at any point during closing.
Opening Jerkiness - The number of transitions between acceleration and deceleration during opening movements.
Closing Jerkiness - The number of transitions between acceleration and deceleration during closing movements.
Maximum Lateral Width - The distance from furthest left to furthest right points of the frontal pattern during a selected fifteen cycle sequence.
Frontal Opening Angle - The tangent to the opening pathway near occlusion in the frontal plane.
Frontal Closing Angle - The tangent to the closing pathway near occlusion in the frontal plane.
The coefficients of the MKI equation were adjusted until all 80 control sample results (male and female) were positive (> 0.0) while all 320 samples from the TMD subjects were negative. The 80 most negative samples were included in their male and female categories as “Extremely Poor Function.” The 80 next most negative were categorized as “Very Poor Function,” followed by the mid-range 80 samples categorized as “Poor Function.” The 80 samples with their results closest to the control group were categorized as “Marginal Function.” The Control samples were categorized as “Good Function” for the sake of this comparison. A Total Score was calculated for each category as the sum of the scores of the 15 parameters. See Table 1. Since this study was a retrospective analysis of previously recorded routine biometric clinical data and no subjects were recruited or treated, an IRB exemption was granted.
RESULTS
Although the quality of masticatory function is a continuous function, the female TMD subjects were divided into five categories of 20 individuals each (40 left + right chewing samples) labelled using equation results as follows:
Category Score Ranges Females Categorical Total Score
1) Good Function (control subjects) = positive MKI values > 0.000 Total Score = 1073 2) Marginal Function range of MKI values = < 0.00 to – 2.02 Total Score = 1162 3) Poor Function range of MKI values < -2.02 to > - 3.55 Total Score = 1276 4) Very Poor Function range of MKI values < - 3.55 to - 5.56) Total Score = 1420 5) Extremely Poor Function range of MKI values < - 5.56. Total Score = 1726
The male subjects were also divided into the same five distinct categories of 20 individuals each labelled using equation results as follows:
Category Score Ranges Males Categorical Total Score
1) Good Function (control subjects) = positive MKI values > 0.000, Total Score = 1101 2) Marginal Function range of MKI values = 0.00 to -1.25, Total Score = 1175 3) Poor Function range of MKI values < -1.25 to - 2.413 Total Score = 1220 4) Very Poor Function range of MKI values < - 2.413 to -4.34) Total Score = 1318 5) Extremely Poor Function range of MKI values < - 4.34 Total Score = 1523
Gender Comparison
To detect any kinesiometric gender differences the five male group mean categorial scores were compared for significance with the corresponding female group mean categorical scores using the Mann-Whitney U Test. Considering the means of comparable categories, except good function, the male group’s scores were consistently somewhat less negative than the female group scores but demonstrated no significant differences between genders (p > 0.05 for all). See Table 1. Although the female Total Scores were not significantly different from the male Total Scores, there were significant gender differences between five of the individual parameters: a) the Closing Time (p < 0.004), b) the Cycle Time Standard Deviation (p < 0.039), the Closing Velocity (p < 0.021), Closing Jerkiness (p < 0.003) and Occlusion Time (p < 003).
Differences Between Categories
Using Student’s t test after verifying the normality of the data of each parameter, significant increases in scores were found between the adjacent categories in both the male and female groups for: 1) Opening Time, 2) Closing Time, 3) Cycle Time Standard Deviation, 4) Opening Velocity, 5) Closing Velocity, 6) Opening Jerkiness and 7) Closing Jerkiness (p < 0.05 for all). See Tables 2 & 3. For males there were significant differences between the Extreme Vs Very Poor and between the Poor Vs Marginal categories with respect to the Turning Point Vertical parameter (p > 0.05). See Table 4. For females there were significant differences between the Poor Vs Very Poor and the Marginal Vs Good categories with respect to the Turning Point Vertical parameter (p < 0.05). See Table 5. For both genders there was only one pair of adjacent categories with a significant difference for: 1) Terminal Chewing Position Lateral, 2) Maximum Lateral Width, 3) Frontal Opening Angle and 4) Frontal Closing Angle (p < 0.05). No significant differences between adjacent categories were found for the Vertical Terminal Chewing Position or the Lateral Turning Point for either gender.
DISCUSSION
The human masticatory system is a complex organ that performs a critical function with great precision.24 The masticatory system is the entry point of the gastrointestinal system that depends on thorough mastication to prepare food for effective digestion.25–27 Without proper mastication nutrition is not optimized, which can lead to irritable bowel syndrome (IBS) and other maladies of the gastrointestinal system.28–30 In fact, the lifetime incidence of IBS associated with TMD has been found in studies revealing up to a 64% comorbidity with TMD.31,32 Problems with eating , drinking, swallowing and choking are closely associated with the comorbidities of TMD, IBS, Fibromyalgia, chronic fatigue syndrome, etc.33
Among this sample of TMD symptomatic subjects the gender differences did not appear to be as great as previously thought.23 Although the female groups’ less than ideal mean MKI scores were consistently somewhat more negative, the gender differences between groups were not significant. See Category Score Ranges. One possibility is that the females were more damaged, especially with respect to their temporomandibular joints. Alternatively, the males may have been equally dysfunctional, but somewhat better adapted and able to function somewhat closer to normal. It is also possible that the significant gender differences, which were mostly related to faster Closing Velocity, less Jerkiness during closing, and shorter Occlusion Time may have just reflected a somewhat more aggressive approach to gum-chewing by the males.
The seven parameters that distinguished all adjacent categories showed significant differences between each pair of categories for both genders and contributed the most to delineating the degree of masticatory dysfunction within the MKI (p < 0.05 for all).34 See Tables 2 & 3. They revealed that decreasing velocity, along with increasing variability and jerkiness are indications of increasing dysfunction. The Occlusion Time differentiated the three most dysfunctional groups for the males and all four dysfunctional groups for the females (p < 0.05). See Tables 4 & 5. Turning Point Vertical indicated that the size of the chewing pattern also decreased with increasing dysfunction, but only two of the categorical differences were significant (p < 0.05), one for each gender, while two parameters additionally indicated trends (p < 0.10) among males. See Tables 4 & 5. Although the Turning Point Lateral did not indicate any significant differences between adjacent categories, it did continuously decrease compared to the control group as level of function decreased. The Turning Point Lateral means of the four dysfunctional groups all fell below the ideal values of the good occlusion group but not significantly (p > 0.05). This was likely due to the increasing presence of opposite side internal derangements that distort the frontal ACP towards the non-working side.13,34,35
The remaining five parameters contributed less to the process by either identifying significant differences only in one adjacent category’s (p < 0.05), or a trend thereof (p < 0.10) or no significant differences. The Terminal Chewing Positions Vertical and Lateral varied little between categories due to the well-known fact that chewing of a soft bolus must occur in centric occlusion with little room for variation (p > 0.05 for all).34–37 The mean Frontal Opening Angles and Frontal Closing Angles did not vary much with only one exception among the female group. See Tables 4 & 5. Even those with the poorest function exhibited mean angles close to those with good function. This result supports the concept that there may be a relatively narrow range of ideal opening and closing frontal angles for chewing and that these dysfunctional subjects’ values straddled them, which would have kept the means similar. The mean Opening Angles for all female groups were between 78.6 and 87.9 degrees, mean Closing Angles between 58.5 to 68.7 degrees. The mean Opening Angles for the male groups were between 81.5 and 94.1 degrees, mean Closing Angles between 65.4 and 68.7 degrees.
It has recently been theorized that the morphology of the masticatory system has evolved more to accommodate speech than for chewing because speech movements are more varied, both within and across languages.38 However, speech movements mostly occur in the sagittal, not the frontal plane, so the eminence angle does not play a substantial part.39 Also, many TMD subjects have poor masticatory function, but without evidence of poor speech. This suggests that the requirements for chewing movements are distinct and more demanding morphologically than speech movements. Mastication is also a critical survival function for all mammals, but speech, per se, is only present in humans.
Some authors have suggested that occlusal wear as historically seen anthropologically may have been part of the original design of human occlusion and that the current reduced presence of wear in modern man may be the etiology of some modern dental problems.40 Others have found that the grinding pattern of mastication is more closely associated with increased wear, especially of the posterior segments,41,42 which has been associated anthropologically with grit in food and parafunctional activity.43 The steep eminence of the human anatomy is designed to decouple the non-working side occlusion during lateral opening movements and during closure from a lateral position as is seen today with normal subjects. See Figure 2. The so-called “chopping” pattern of chewing as seen with unworn dentitions, as opposed to the grinding pattern associated with severe wear, appears to be the more advantageous pattern of human chewing as it is universally present within carefully selected asymptomatic subjects with good occlusions selected for control groups.
CASE EXAMPLE
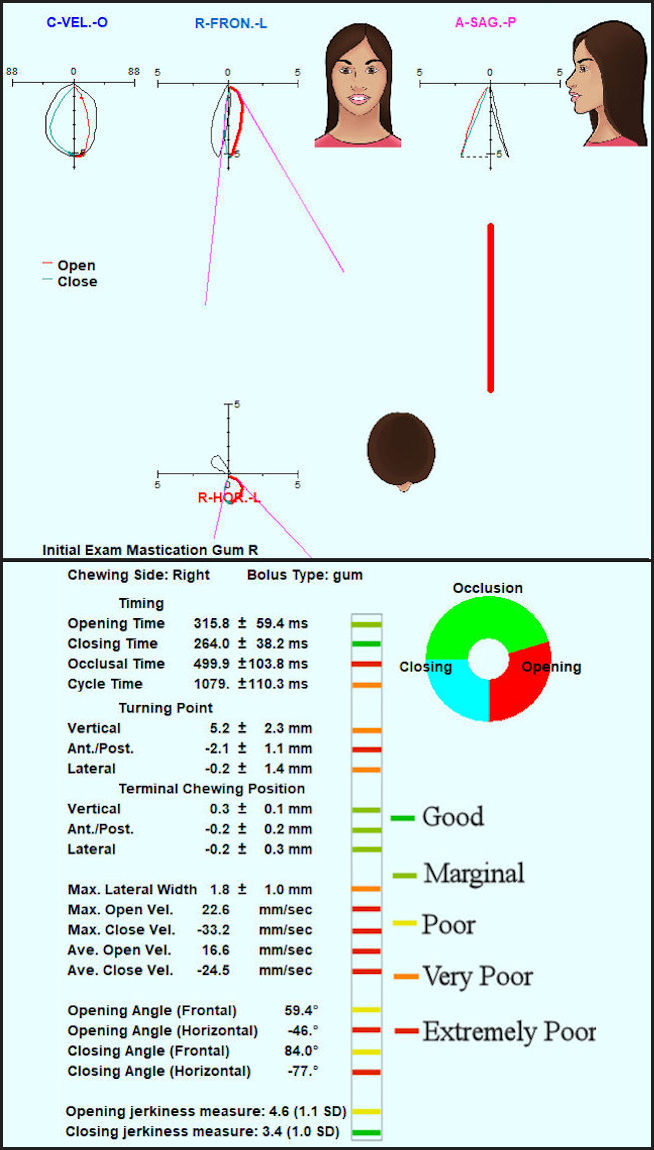
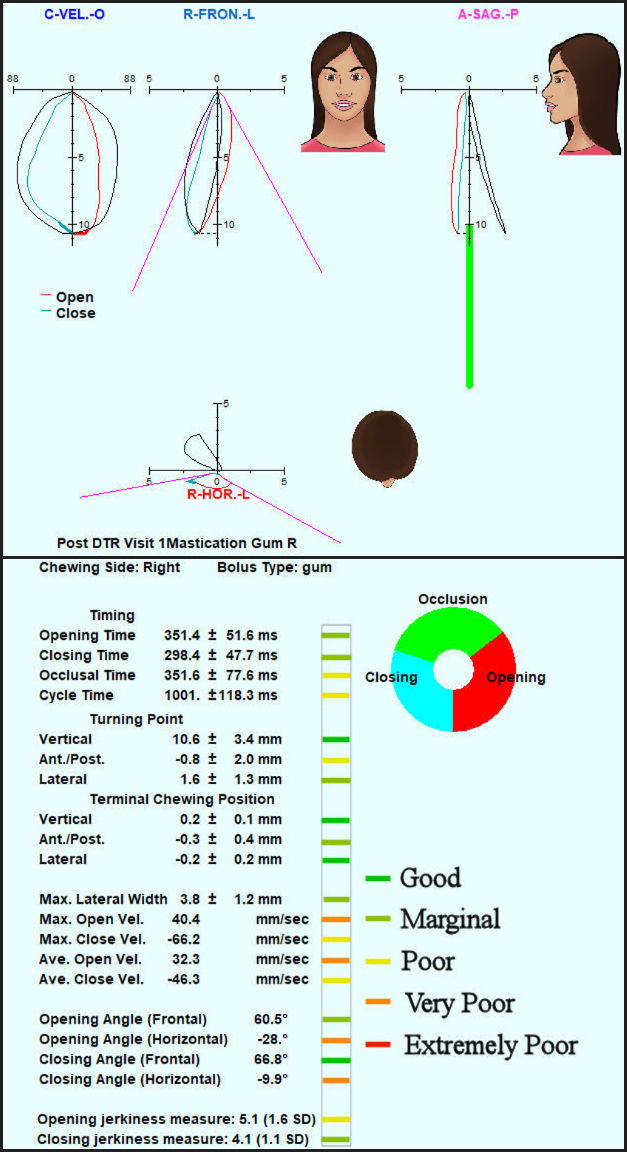
A case study is presented to illustrate how the MKI can easily and accurately indicate dysfunction and/or improvement following a treatment. This case involves a 24 yr. old very symptomatic female that was diagnosed with Meniere’s Disease. She had been evaluated by her primary care physician who referred her to an otolaryngologist that “confirmed” the diagnosis. An MRI ruled out any auditory neuroma and she presented with the classic triad of symptoms which include episodic vertigo, tinnitus, and hearing loss. These symptoms among others have also been observed in patients suffering from TMDs. After reviewing patient history and completing a biometric evaluation it was determined bite adjustments could be made to correct the occlusal force distribution and timing. This was accomplished via strict Disclusion Time Reduction (DTR) protocols,44–47 using the T-Scan (Tekscan, Inc., South Boston, MA USA) and the eight-channel surface-recording BioEMG III (BioResearch Associates, Inc. Milwaukee, WI USA) to guide the dentist as to what corrective revisions needed to be made.44–46 The patient had right and left gum chewing cycles recorded with the JT-3D incisor-point tracker and the BioEMG III pre and post DTR therapy. Comparing Figures 4 and 5 one can see where the MKI improved from a score of - 6.4 (pre DTR) to - 4.2 (post DTR). This case result is consistent with findings where Meniere’s Disease symptoms improved along with Mastication improvements following DTR therapy.48,49 It has been well established that tooth surface morphology contributes to masticatory dysfunction and when morphology is corrected with DTR, function is improved toward normalcy or in some cases, corrected completely.50–52 It has been noted that since masticatory function is a learned capacity, not a pre-programmed function of a central pattern generator, the correction of a malocclusion may require months for the patient to relearn a new functional pattern of improved function.51–53


LIMITATIONS
Although the three clinics that recorded the gum chewing data followed the same protocol, some differences in the setup, incisor-point tracker alignment, or environmental factors may have been present. Because this was a study only of the quality of the chewing pattern, no effort was made to correlate subjects’ functional ability with symptomology. Subjects were only designated as either being symptomatic or as normal (asymptomatic) controls. The lack of significant differences between genders within a given category may have been due to the limited range of each category, which may have reduced the gender differences.
CONCLUSIONS
The quality of Masticatory Function is contained within the incisor-point motions recorded during gum-chewing and the MKI can be used to categorize a subject’s quality of function. The characteristics of dysfunction imbedded within the gum-chewing motions are a) slowness, b) a reduced size of the ACP, c) distortion of the shape of the ACP, and d) an increase in the variability of the gum-chewing movements. Gender differences, although present, were found to be less significant than anticipated compared to previous literature suggestions. Additional data are needed to evaluate the activity of the muscles and whether they are functioning well or struggling adaptively to accomplish mastication. This will be necessary to fulfil the objective of fully understanding the quality of masticatory function.
CLINICAL SIGNIFICANCE
The quality of Masticatory Function is present within the incisor-point motions during gum-chewing and the MKI can be used to categorize a subject’s quality of function. The MKI can also be used as a simple, objective indication of the outcome of any occlusal, orthodontic, or prosthodontic treatment. An additional analysis of the activity of the muscles may indicate whether they are functioning normally or struggling to adaptively accomplish masticatory function.
Funding
No funding was received from any source for this study.
Disclosure
Ben A. Sutter operates a private practice, Eugene, OR USA
Gerardo Ruiz-Velasco operates a prívate practice, Guadalajara, JAL México
Manminder S. Sethi is an independent researcher, Colorado Springs, CO USA
John Radke is chairman of the board for Bioresearch Associates, Inc. Milwaukee, WI USA