Loading [Contrib]/a11y/accessibility-menu.js
1.
Sutter BA, Thumati P, Thumati RP, Radke J. Meniere’s Disease Patients Treated with Disclusion Time Reduction (DTR): Masticatory Function Revealed from EMG and EGN (Part 2 of 4). Adv Dent Tech. Published online August 15, 2023.
Download all (9)
  • Figure 1. A) T-Scan 10 digital occlusal analyzer recording bite force and time synchronized with BioEMG III measuring the temporalis (red leads) and masseter muscles (blue-green leads) in real time. B) The BioEMG III records the muscle activity and JT-3D magnetic incisor-point tracker records the motions of masticatory function.
  • Figure 2. One sample patient’s Average Chewing Pattern (ACP) pre-treatment with numerical values. Vertical Turning Point is very small, (should be 10 – 22 mm), lateral Turning Point is on the wrong side, the terminal chewing position is too far from MIP (limited crushing of the bolus), opening and closing velocities are very slow and jerkiness is too high for opening and marginally adapted for closing. Black lines are the mean normal patterns scaled to the patient’s vertical dimension, red lines = opening, cyan lines = closing.
  • Figure 3. A) The same patient’s highly variable firing pattern of elevator muscles cycle to cycle shows poor coordination (gum chewing right side). B) The Average Chewing Cycle (ACC) of this patient’s activity shows the peaking of all 4 muscles was delayed abnormally past the end of closure. C) Masseter inhibition, high variability (CV > 0.3), long cycle time (1.08 seconds) and delayed closing peaks (after the end of closure) all reveal dysfunction.
  • Figure 4. Average Chewing Pattern immediately following DTR treatment showing cycle time and occlusal time have shortened, vertical Turning Point has increased into normal range, lateral Turning Point has been corrected to the right side, and the opening and closing velocities have increased.
  • Figure 5. A) Immediately following DTR therapy the standard deviation of each muscle’s activity was reduced, B) the peaking of muscle activity occurred closer to the end of closure and C) increased working masseter activity along with reduced working temporalis activity.
  • Figure 6. Further reduction in the cycle time towards the normal range with reduced. The Average Chewing Pattern shapes are closer to matching the mean normal patterns. The Terminal Chewing Position is normalized (very close to MIP). Closing velocity increased toward the normal range.
  • Figure 7. A) Four months post therapy the variability was more consistent between muscles, B) working masseter activity is increased and non-working masseter activity decreased and C) three of four muscles peak their activity before the end of closure.
  • Figure 1A. Mean Normal Average Chewing Pattern (ACP) of chewing motion (black lines) with a control subject’s data superimposed (red opening and cyan closing). Normal vertical range of Turning Point combining both sexes is 10 to 22 mm for one stick of chewing gum.
  • Figure 2A. Mean Normal Average Chewing Cycle (ACP) of bilateral masseter and anterior temporalis muscles’ chewing EMG activity. The working masseter is most active, and the balancing masseter is the least active in Angle’s Class I patients. In Class II patients the temporalis is more active with a W-Ta, B-Ta, W-Mm, B-Mm normal pattern.

Abstract

Objectives

The objectives of this research were: 1) to compare the changes in PHQ-15 scores to the changes in the EMG and EGN chewing data 2) to compare the progression of pain intensity, frequency of symptoms and functional restriction scores to the progression of EMG and EGN measurements pre and post DTR Therapy. The null hypothesis was stomatognathic dysfunction plays no role in Meniere’s Disease symptoms. The alternative hypothesis is that the dysfunction of the masticatory system does contribute to the symptoms associated with Meniere’s Disease (MD).

Methods

Two different TMD treatment centers recruited 86 patients previously diagnosed with Meniere’s Disease and referred by otolaryngologists using MRI. Inclusion required patients to answer questions regarding their symptom intensity, duration and frequency prior to treatment, 3 weeks post treatment and 3 – 4 months post treatment. Muscular and movement dysfunction were recorded at each time point. All Subjects were selectively treated with DTR via Immediate Complete Anterior Guidance Development coronoplasty. Student’s t test was applied to the measured data, Wilcoxon Signed Rank test to the survey data. (a = 0.05)

Results

As indicated in Part I, four months after treatment the group’s symptom intensity, duration and frequency of painful symptoms declined from pre-treatment medians between 5 to 9 (0 to 10 scale) to post-treatment values that were all less than 1.2 (p < 0.00001). Significant improvements were revealed in this dysfunctional group’s mean chewing motion parameters, including reduced mean jerkiness and the dysfunctional masticatory muscle activities (p < 0.05).

Conclusions

The pre-treatment symptom scores were significantly reduced after physical treatments and continued to significantly reduce at 3 – 4 months after the end of physical treatment. The concurrent significant improvements in the masticatory timing, motion and muscle function support a physical etiology for Stomatognathic Dysfunction tied to these subjects’ Bite Force and Bite Timing.

Clinical Significance

A clinical diagnosis of Meniere’s Disease should be considered as an indication to routinely evaluate a patient for the presence of temporomandibular disorders (TMDs).

Note: This data set will be used in four different articles. Part I evaluated the effect of DTR on symptom resolution. This one analyzed EMG and EGN Masticatory function, the third will analyze Temporomandibular Joint Vibration changes, and the fourth part TMD vs MD and Somatic Symptom Disorders with PHQ-15 scores and functional scores, all in attempt to shed new light on MD etiology.

INTRODUCTION

Much has been published on Menière’s Disease (MD), which was first identified and characterized by Prosper Menière over 150 years ago.1 Today diagnosing and treating MD among clinicians remains challenging2–7 and as a result MD continues to be a catchall for vertigo of unknown origin. Endolymph Hydrops (EH) remains a histologic finding in most but not all MD cases, while the MD diagnosis remains purely a clinical diagnosis. There is no agreement on the etiology of MD as it relates to Endolymphatic Hydrops.6,8–12 Current considerations is that EH is a histological sign of the disease rather than a causative etiology.6,9–16 Some research has attempted to induce MD by increasing the endolymph production or limiting its reabsorption through medications. Those models did produce EH but did not produce MD symptoms.17–19 Even if EH does have some influence over vertigo, it does not adequately explain the persistence of tinnitus, ear fullness, or hearing loss progression.

In an attempt to bring clarity to the ENT community a few consensus statements and reviews have been published.6–12 The American Academy of Otolaryngology – Head and Neck Surgery published a clinical practice guideline on MD6 with the stated purpose: “To maximize treatment, it is important to clinically distinguish MD from other independent causes of vertigo that may mimic MD and present with hearing loss, tinnitus and aural fullness.”6 Even though TMD has been known to present with this same presentation of symptoms,20–31 the AAO-HNS fails to make any mention of the similarities in inner ear symptom presentation between TMD and MD anywhere in its 55-page guideline. This is counter intuitive if the aim of their guideline is to distinguish MD from other causes that could mimic MD symptomology. See Appendix summary for TMD vs MD Symptomology Comparison.

It is well known that James Costen, an otolaryngologist, read his initial findings of inner ear and sinus symptoms related to disturbed function of the TMJs in 1934 before the Texas Ophthalmological and Otolaryngological Society and was later pubished.32 More recent authors have subsequently labeled his work Costen’s Syndrome, which eventually became known as TMJ Syndrome and currently is labelled as Temporomandibular Disorders (TMD) or Temporomandibular Joint Disorders (TMJD).

From the 1990s into the 2000s research spearheaded by Bjorne et al began establishing a link between TMD and MD.22,33–35 Treating TMD patients that were also diagnosed with MD resulted in complete resolution of the MD (and TMD) symptoms or decreased to a level they no longer were life altering for the patient. The symptom resolution was long term as indicated by 3-year and 6-year follow up studies.33,34 Treatments rendered were occlusal adjustments, TMD splint therapy, cervical spine therapy and physical therapy.22,31–35 It is impossible to know if one therapy is responsible for the therapeutic outcome or if it was a result of a synergistic effect of all of the therapies being used in conjunction with each other.

A couple of case studies have shown occlusal adjustments to be highly effective in the treatment of patients that have a diagnosis of Meniere’s Disease.36,37 The present study only used bite revision therapy via DTR in an attempt to bring symptom relief in a cohort of 86 subjects with a diagnosis of MD. DTR has previously demonstrated effective and long-term symptom resolution in patients diagnosed with TMD and Orofacial pain.38–47

OBJECTIVES

The objectives of this cohort study were: 1) to perform DTR Therapy on patients with an otolaryngologist’s diagnosis of MD who presented with long Disclusion Times and/or a bite force imbalance, including high excursive muscle activity levels, all of which could promote MD symptomology and 2) to reveal any significant changes in masticatory function as indicated by EMG and EGN data. The Null hypothesis: DTR does not affect MD symptomology.

METHODS

Eighty-six patients previously diagnosed with Meniere’s Disease (MD) by otolaryngologists were evaluated in two different dental practices that offered specialized Disclusion Time Reduction (DTR) services for patients with temporomandibular disorders (TMD). All patients had prior magnetic resonance imaging (MRI), which ruled out auditory neuromas. All 86 patients had received various unsuccessful treatments from dietary restrictions such as avoidance of salt and caffeine to inner ear gentamycin and stem cell injections. None of these treatment options had brought about relief for an extended length of time. While patients were not selected at random, they were consecutive patients referred to each of the two dental offices. In one general dentistry office located in Eugene, Oregon, 32 consecutive patients diagnosed with MD were treated successively. All who walked in and met the inclusion criteria were evaluated and treated. The second dental office was located within the RajaRajeshwari Dental College, Dept of Orofacial Pain under Rajiv Gandhi University of Health Sciences in Bengaluru India. The Dept of Ear Nose and Throat at RajaRajeshwari Medical College was contacted to refer patients (52) that met the inclusion criteria to the second dental office to be evaluated and treated with DTR. An IRB approval was requested and obtained for a retrospective cohort study #BIRB/99Z/2022.

The Inclusion criteria were:

  • A MD diagnosis from an otolaryngologist with MRI that definitively ruled out an auditory neuroma.

  • The existence of ongoing MD symptomatic episodes

  • 28 teeth with symmetrically missing teeth (if one molar was missing on the left side, then one had to be missing on the right side)

  • Near normal occlusal relations with molars and premolars in contact during the right and left excursions

  • Angles Class I and Class III occlusal relations, with guiding anterior teeth that were either in contact, or near to contact.

  • Patients that had been previously treated for MD but had not received symptom resolution.

  • Patients 18 years of age or older

The Exclusion criteria were:

  • Severe Class II malocclusions

  • Anterior open bite where anterior guidance contact could not be achieved.

  • A previous history of TMJ trauma

  • The presence of unstable Temporomandibular Joint internal derangements verified by CBCT and/or Joint Vibration Analysis (JVA).

  • Patients that had been previously treated with MD therapy and received symptom resolution.

  • Patients who had undergone prior TMD therapy, including prior occlusal adjustment treatment.

Informed consent was obtained from each patient for undergoing the DTR coronoplasty, and for collecting MD symptom severity, frequency and duration data from questionnaires as well as masticatory evaluation. Oral health histories were also obtained where the whole participant group reported experiencing MD symptoms. All the group reported fullness in the ear, tinnitus, vertigo (including drop attacks) and hearing loss in at least one ear. The group also reported many TMD symptoms with moderate to severe frequencies and intensities. The TMD symptoms seemed to be randomly distributed and no correlation could be made with any one symptom to the MD symptoms. DTR therapy is discussed and reviewed in Part 1 of this series and will not be repeated here.

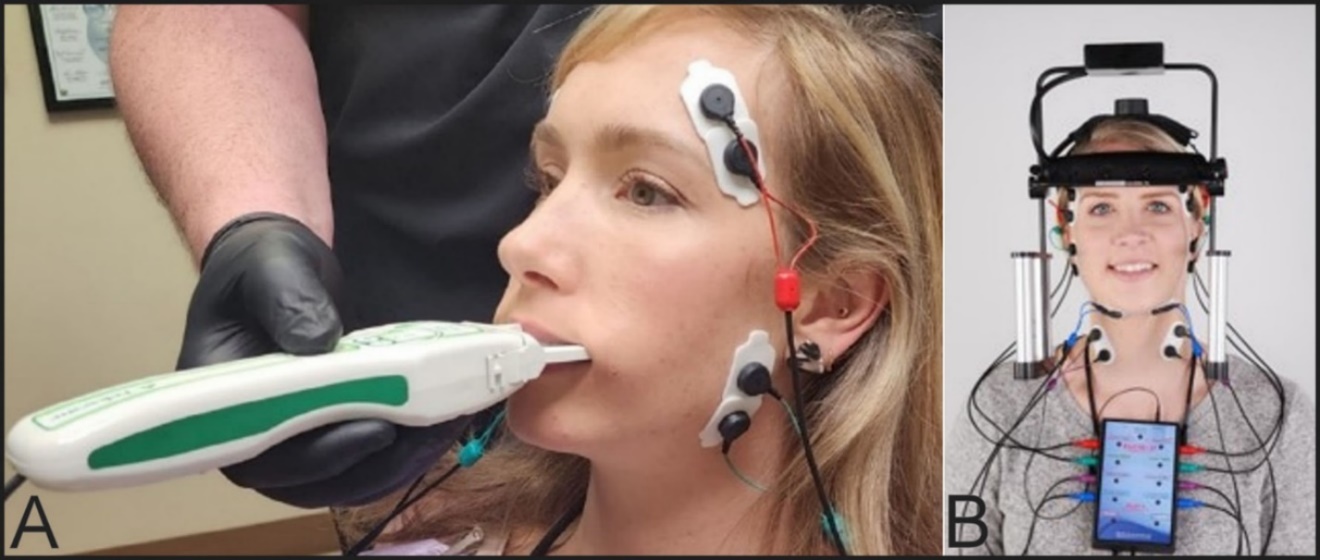
Every participant underwent a pre-DTR right and left excursive Disclusion Time/muscle hyperactivity evaluation with the synchronized T-Scan 10/BioEMG III technologies (Tekscan Inc., S. Boston, MA USA; Bioresearch Assoc., Inc. Milwaukee, WI, USA). See Figure 1A. This allowed accurate EMG and disclusion times to be recorded prior to the therapy. All subjects, at the same appointments, had masticatory function assessed with combined electrognathology (EGN) (Bioresearch Assoc., Inc. Milwaukee, WI, USA) and electromyography (EMG) recordings of gum chewing.48–58 See Figure 1B. This was done to evaluate; 1) the function of the TMJ and 2) the quality of mastication of a soft bolus (gum) using BioPAK software (BioResearch Associates, Inc. Milwaukee, WI USA).59–61 The recordings were repeated at each initial appointment and mastication was evaluated at pre-treatment and 3 to 4 months follow-up appointments.62 The analysis of the masticatory function data is reported in this Part II.

Figure 1
Figure 1.A) T-Scan 10 digital occlusal analyzer recording bite force and time synchronized with BioEMG III measuring the temporalis (red leads) and masseter muscles (blue-green leads) in real time. B) The BioEMG III records the muscle activity and JT-3D magnetic incisor-point tracker records the motions of masticatory function.

A total of 86 patients participated, 47 males and 39 females at a ratio of 1.2:1. The mean age was 50.8 (+/- 18.1) years with a range from 17 to 80 years and a median of 55. While the age distribution was not a normal one, it does represent a range of likely candidates. Patients were selected sequentially as they agreed to participate.

The Wilcoxon Signed Rank test was applied to the survey data of MD symptoms to detect significant improvements. Student’s paired t test was applied to the measured intra-patient EGN and EMG data, making each subject his or her own control. Consequently, no separate control group was enlisted because the purpose was simply to correlate the masticatory function data with the MD symptom levels.

RESULTS

The previous report (Part I) revealed that the presence of ear fullness, vertigo and tinnitus were significantly reduced up to 3 – 4 months after DTR treatments (p < 0.05). This report (Part II) is focused on significant improvements in masticatory movement and muscle function towards the expected norms for these parameters.

Where the timing of the chewing motion was significantly changed post-treatment after DTR, the changes were towards mean normal values. For left-sided gum-chewing the mean Opening Time and mean Cycle Time were significantly shortened (p < 0.05) with a trend towards a shorter Occlusal Time as well (p < 0.10). For right-sided gum-chewing the mean Opening Time, mean Closing Time and Mean Cycle Time were significantly shortened (p < 0.05), while the Occlusal Time was significantly lengthened (p < 0.05). The pre-treatment cycle times were long, but the post treatment mean cycle times were within the expected normal range of 0.50 to 0.8 seconds. See Table 1.

Table 1.Changes in the mean timings of the left and right gum-chewing motion from before to immediately after DTR treatment.
Chewing Timing - Left Opening Time (milli-seconds) Closing Time (milli-seconds) Occlusal Time (milli-seconds) Cycle Time (milli-seconds)
Pre-treatment Mean 384 214 383 1062
Standard Deviation 236 77.4 819 1201
Student's t test p < 0.00000 0.2082 ns 0.0945 T 0.0054
Post-Treatment Mean 121 222 268 727
Standard Deviation 238 77.3 153 245
Notes: T = trend towards significance, ns = not significant
Chewing Timing - Right Opening Time (msec) Closing Time (msec) Occlusal Time (msec) Cycle Time (msec)
Pre-treatment Mean 510 411 246 1294
Standard Deviation 728 895 103 1889
Student's t test p < 0.00023 0.0032 0.0143 0.00164
Post-Treatment Mean 247 182 287 713
Standard Deviation 147 67 141 258
Note: msec = milliseconds

The means of the left and right gum-chewing vertical Turning Points (TP) increased significantly towards the mean normal value (16 mm) after DTR treatment (p < 0.05). The mean of the left gum-chewing antero-posterior Turning Point increased significantly (p < 0.05), but the increase in the right-sided gum-chewing antero-posterior Turning Point did not reach significance (p > 0.05). For left-sided gum-chewing the mean lateral Turning Point significantly decreased (p < 0.05), but the right-sided gum chewing lateral Turning Point only trended toward a significant change (p < 0.10). See Table 2.

Table 2.Changes in the mean left and right Turning Points (TP) of gum-chewing after DTR treatment.
Left Maximum Opening Point Turning Point
Vertical (mm)
Turning Point
Ant-Post (mm)
Turning Point
Lateral (mm)
Pre-treatment Mean 11.5 2.9 0.6
Standard Deviation 4.7 7.0 2.9
Student's t test p < 0.00023 0.0081 0.0554 T
Post-Treatment Mean 13.3 5.1 1.1
Standard Deviation 4.4 7.1 2.8
Note: mm = millimeters
Right Maximum Opening Point Turning Point
Vertical (mm)
Turning Point
Ant-Post (mm)
Turning Point
Lateral (mm)
Pre-treatment Mean 10.8 3.7 2.1
Standard Deviation 4.5 4.7 2.8
Student's t test p < 0.0041 0.1266 ns 0.0645 T
Post-Treatment Mean 12.3 4.5 2.7
Standard Deviation 4.3 4.9 2.8
Note: mm = millimeters, T = Trend, ns = not significant

The mean Terminal Chewing Position (TCP) is the distance between the arches at the point of maximum bolus crush. The amount of crush is dependent on the nature of the bolus. Gum usually crushes to a very thin bolus. Although the bolus was crushed more in all three dimensions during left gum-chewing, only the left chewing Lateral TCP change was significant (p < 0.05) post-treatment with DTR. See Table 3.

Table 3.Changes in the left and right mean Terminal Chewing Positions (TCP) with gum-chewing from before to after DTR Treatment.
Left Terminal Chewing Position Terminal Chewing Position
Vert (mm)
Terminal Chewing Position
A/P (mm)
Terminal Chewing Position
Lat (mm)
Pre-treatment Mean 1.11 0.8 0.6
Standard Deviation 1.76 2.3 1.7
Student's t test p < 0.2571 ns 0.3105 ns 0.0034
Post-Treatment Mean 0.87 0.6 0.0
Standard Deviation 0.98 1.8 1.6
Note: mm = millimeters, , ns = not significant, Vert = Vertical
Right Terminal Chewing Position Terminal Chewing Position
Vert (mm)
Terminal Chewing Position
A-P (mm)
Terminal Chewing Position
Lat (mm)
Pre-treatment Mean 1.15 0.47 0.40
Standard Deviation 1.60 1.52 1.57
Student's t test p < 0.4429 ns 0.4581 ns 0.1291 ns
Post-Treatment Mean 1.25 0.45 0.63
Standard Deviation 1.36 1.11 1.43
Note: A-P = antero-posterior, Lat. = Lateral

Maximum lateral width trended towards an increase for left-sided gum-chewing (p < 0.10) but decreased significantly for right-sided gum-chewing (p < 0.05). For Left-sided gum-chewing both the opening and the closing velocities increased significantly (p < 0.05). For right-sided gum-chewing the opening velocity increased significantly (p < 0.05) while the closing velocity only showed a trend towards increasing (p < 0.10). See Table 4.

Table 4.The Maximum Lateral Width of the frontal chewing pattern and the chewing velocities.
Maximum Width and Velocity - Left Maximum Lateral Width
(mm)
Maximum Opening Velocity
(mm/sec.)
Maximum Closing Velocity
(mm/sec.)
Pre-treatment Mean 4.5 90.1 95.1
Standard Deviation 1.9 48.9 38.9
Student's t test p < 0.0983 T 0.0000035 0.0061
Post-Treatment Mean 5.0 115.3 108.7
Standard Deviation 2.5 54.1 39.0
T = Trend, mm = millimeters, mm/sec. = millimeters/second
Maximum Width and Velocity-Right Maximum Lateral Width
(mm)
Maximum Opening Velocity
(mm/sec.)
Maximum Closing Velocity
(mm/sec.)
Pre-treatment Mean 4.7 100.0 105.0
Standard Deviation 1.9 59.7 58.7
Student's t test p < 0.01722 0.00071 0.08785 T
Post-Treatment Mean 4.2 122.0 113.0
Standard Deviation 1.7 49.7 46.4
Note: mm = millimeters, mm/sec. = millimeters/second

Frontal opening angles did not change significantly for either left or right gum-chewing. However, frontal closing angles were reduced significantly to smaller angles for both left and right gum-chewing (p < 0.05). Jerkiness during opening was reduced significantly for both left and right gum-chewing (p < 0.05). Jerkiness was significantly reduced during closing for right gum-chewing (p < 0.05), but not for left gum-chewing. See Table 5.

Table 5.Significant reductions in the frontal plane closing angles and opening jerkiness during left-sided and right-sided gum-chewing. Lesser changes in the frontal opening angles and closing jerkiness.
Left Chewing Frontal Angles and Jerkiness Frontal Opening Angle
(degrees)
Frontal Closing Angle
(degrees)
Opening Jerk
(mm/sec3)
Closing Jerk
(mm/sec3)
Pre-treatment Mean 87.8 73.7 6.0 3.2
Standard Deviation 23.6 20.8 3.7 1.1
Student's t test p < 0.0983 T 0.0102 0.00000001 0.2876 ns
Post-Treatment Mean 91.8 68.0 3.6 3.2
Standard Deviation 26.3 21.3 1.8 1.2
T = Trend, mm/sec3 = Jerk (rate of change of acceleration), ns = not significant
Frontal Angles and Jerkiness Frontal Opening Angle
(degrees)
Frontal Closing Angle
(degrees)
Opening Jerk
(mm/sec3)
Closing Jerk
(mm/sec3)
Pre-treatment Mean 99.0 73.0 7.4 7.4
Standard Deviation 30.5 25.9 10.8 16.3
Student's t test p < 0.1243 ns 0.0089 0.0008 0.0049
Post-Treatment Mean 95.0 65.0 3.7 2.7
Standard Deviation 21.7 18.0 2.3 1.0
Note: ns = not significant

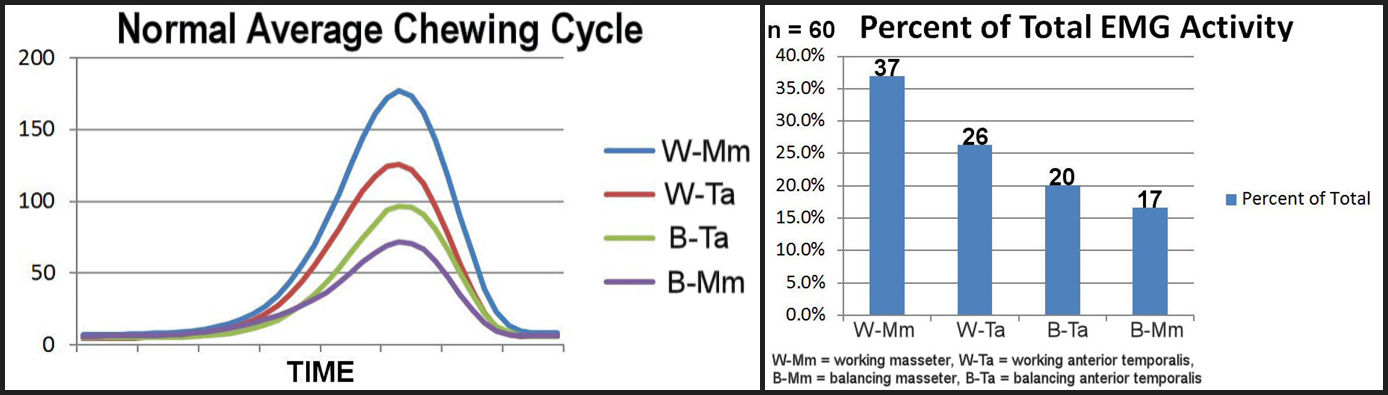
The overall effort of chewing is indicated by the mean levels of EMG activity in the 4 superficial elevator muscles measured from each given subject. All four muscles significantly reduced their activity after DTR treatment, both for left-sided gum-chewing and for right-sided gum-chewing (p < 0.05). See Table 6.

Table 6.Left-sided and right-sided gum-chewing effort as indicated by integrated EMG activity of elevator muscles was reduced after treatment.
Left Chewing Overall Effort Mean Area (mV-seconds)
TA-R
(NW)
MM-R
(NW)
MM-L
(W)
TA-L
(W)
Mean Activity Pre-treatment 34.7 34.2 40.5 54
Standard Deviation 52.99 44.03 42.74 106.8
Paired T-Test p < 0.0324 0.0230 0.00031 0.0300
Mean Activity Post-treatment 26.9 26.9 22.6 31.4
Standard Deviation 32.11 41.78 16.56 28.61
Combining all Muscles
Mean Activity Pre-treatment 40.9 microvolts
Student's t test p < 0.00001
Mean Activity Post-treatment 25.9 microvolts
NW = non-working, W = working, mV = microvolt, ns = not significant
Right Chewing Overall Effort Mean Area (mV-seconds)
TA-R
(W)
MM-R
(W)
MM-L
(NW)
TA-L
(NW)
Mean Activity Pre-treatment 43.0 60.2 42.8 72.9
Standard Deviation 50.97 114.3 69.8 143
Paired T-Test p < 0.0494 0.0428 0.0091 0.0070
Mean Activity Post-treatment 31.8 37.1 24.7 35.9
Standard Deviation 38.31 52.1 25.8 61.6
Combining all Muscles
Mean Activity Pre-treatment 54.7 microvolts
Student's t test p < 0.0000353
Mean Activity Post-treatment 32.3 microvolts
NW = non-working, W = working, mV = microvolt, ns = not significant

The coefficient of variation (the standard deviation divided by the mean) is an indication of the relative variability. Among this group of subjects, significant reductions were seen in the right-sided gum-chewing relative variability after their DTR treatments (p < 0.05). For the left-sided gum-chewing only the non-working temporalis varied significantly less (p < 0.05), although a trend was present in the reductions in the CV for non-working masseter and working temporalis muscles activities (p < 0.10). See Table 7.

Table 7.Mean relative chewing variability significantly decreased after DTR treatments.
Left Chewing Gum Variability Coefficient of Variation
TA-R
(NW)
MM-R
(NW)
MM-L
(W)
TA-L
(W)
Mean Activity Pre-treatment 0.44 0.40 0.46 0.45
Standard Deviation 0.32 0.22 0.24 0.23
Paired T-Test p < 0.0115 0.0698 T 0.172 ns 0.0971 T
Mean Activity Post-treatment 0.35 0.35 0.42 0.41
Standard Deviation 0.18 0.20 0.20 0.20
Combining all Muscles
Average Effort Pre-treatment 0.436
Student's t test p < 0.00063
Average Effort Post-treatment 0.383
NW = non-working side, W = working side, T = trend, ns = not significant
Right Chewing Gum Variability Coefficient of Variation
TA-R
(W)
MM-R
(W)
MM-L
(NW)
TA-L
(NW)
Mean Activity Pre-treatment 0.48 0.45 0.43 0.42
Standard Deviation 0.238 0.187 0.184 0.164
Paired T-Test p < 0.00014 0.0001 0.0052 0.00373
Mean Activity Post-treatment 0.36 0.37 0.37 0.36
Standard Deviation 0.202 0.222 0.201 0.195
Combining all Muscles
Average Effort Pre-treatment 0.446
Student's t test p < 0.000001
Average Effort Post-treatment 0.361
NW = non-working side, W = working side, T = trend, ns = not significant

The Peak Amplitude in microvolts is the highest level of contraction during the chewing cycle. Three of eight mean values revealed significant reductions in peak amplitude (p < 0.050, three reductions showed trends towards significant reductions (p < 0.10) and two showed non-significant reductions. See Table 8.

Table 8.Significant decreases were recorded in the Peak Amplitude levels of the EMG activity during maximum bolus crush after DTR treatment. The decreases were greater for left-sided gum-chewing, but also significant for the whole musculature for Right-sided Gum-chewing.
Highest Intensity of Left Chewing Peak Amplitude (microvolts)
TA-R
(NW)
MM-R
(NW)
MM-L
(W)
TA-L
(W)
Mean Activity Pre-treatment 93.3 79.5 108.8 135.0
Standard Deviation 93.19 64.23 79.24 145.72
Paired T-Test p < 0.0068 0.0005 0.0350 0.0507 T
Mean Activity Post-treatment 63.5 52.8 80.1 110.4
Standard Deviation 45.15 30.90 52.96 81.84
Combining all Muscles
Average Activity Pre-treatment 101.6 microvolts
Student's t test p < 0.000047
Average Activity Post-treatment 75.7 microvolts
NW = non-working side, W = working side, T = trend
Highest Intensity of Right Chewing Peak Amplitude (microvolts)
TA-R
(W)
MM-R
(W)
MM-L
(NW)
TA-L
(NW)
Mean Activity Pre-treatment 112.1 114.3 73.4 102.2
Standard Deviation 103.4 109.7 70.6 139.9
Paired T-Test p < 0.0722 T 0.225 ns 0.282 ns 0.0943 T
Mean Activity Post-treatment 94.6 105.1 68.9 79.1
Standard Deviation 76.7 75.5 47.5 85.2
Combining all Muscles
Average Activity Pre-treatment 100.5 microvolts
Student's t test p < 0.0188
Average Activity Post-treatment 86.9 microvolts
NW = non-working side, W = working side, T = trend towards significance

The significant decreases in mean cycle times were repeated for all four muscles in both left and right gum-chewing with shortened mean times from the onset of opening to the peak amplitude of each muscle’s contraction (p < 0.05). See Table 9.

Table 9.Time from onset of opening to the peak of the EMG activity showed a significant decrease for the four elevator muscles during both left-sided and right-sided gum-chewing.
Left-side Time to Peak Activity Time to Peak (milliseconds)
TA-R
(NW)
MM-R
(NW)
MM-L
(W)
TA-L
(W)
Mean Time Pre-treatment 470 479 495 468
Standard Deviation 294.3 231.9 278.9 174.4
Paired T-Test p < 0.01011 0.00683 0.0086 0.00217
Mean Time Post-treatment 396 410 424 414
Standard Deviation 167.9 159.3 153.3 145.2
Combining all Muscles
Average Time Pre-treatment 478 milliseconds
Student's t test p < 0.000001
Average Time Post-treatment 411 milliseconds
NW = non-working side, W = working side
Right-side Time to Peak Activity Time to Peak (milliseconds)
TA-R
(W)
MM-R
(W)
MM-L
(NW)
TA-L
(NW)
Mean Time Pre-treatment 554 615 568 615
Standard Deviation 626 937 654 880
Paired T-Test p < 0.0144 0.0311 0.00596 0.0241
Mean Time Post-treatment 414 424 389 427
Standard Deviation 197 176 152 208
Combining all Muscles
Average Time Pre-treatment 588 milliseconds
Student's t test p < 0.000017
Average Time Post-treatment 413 milliseconds
NW = non-working side, W = working side

Significantly shorter times from peak EMG amplitude to the end of closure (onset of occlusion time) was recorded in all four muscles during right-sided gum-chewing (p < 0.05). However, only the working temporalis’ reduction in time achieved significance during left-sided gum-chewing (p < 0.05). See Table 10.

Table 10.Timing from the peak of each muscle’s activity to the end of closure (beginning of occlusal phase of the chewing cycle). Left-sided gum-chewing showed a significant increase for the whole musculature, but the right-sided Gum-chewing only indicated a trend.
Left Timing from Peak to Occlusion Peak to Occlusion (milliseconds)
TA-R
(NW)
MM-R
(NW)
MM-L
(W)
TA-L
(W)
Mean Times Pre-treatment 23.4 29.6 12.8 36.0
Standard Deviation 164.6 122.2 160.1 222.5
Paired T-Test p < 0.145 ns 0.04701 0.04194 0.097 T
Mean Times Post-treatment 47.0 59.5 49.0 47.2
Standard Deviation 115.8 117.7 104.2 109.4
Combining all Muscles
Mean Time Pre-treatment 23.1 milliseconds
Student's t test p < 0.0021
Mean Time Post-treatment 50.7 Milliseconds
NW = non-working side, W = working side, ns = not significant
Right Time Peak to Occlusion Peak to Occlusion (milliseconds)
TA-R
(W)
MM-R
(W)
MM-L
(NW)
TA-L
(NW)
Mean Times Pre-treatment 46 33 43 24
Standard Deviation 115 116 112 123
Paired T-Test p < 0.143 ns 0.244 ns 0.449 ns 0.236 ns
Mean Times Post-treatment 62.4 43.2 45.0 35.0
Standard Deviation 126 111 97 117
Combining all Muscles
Mean Time Pre-treatment 36.6 milliseconds
Student's t test p < 0.0898 T
Mean Time Post-treatment 46.4 Milliseconds
NW = non-working side, W = working side

DISCUSSION

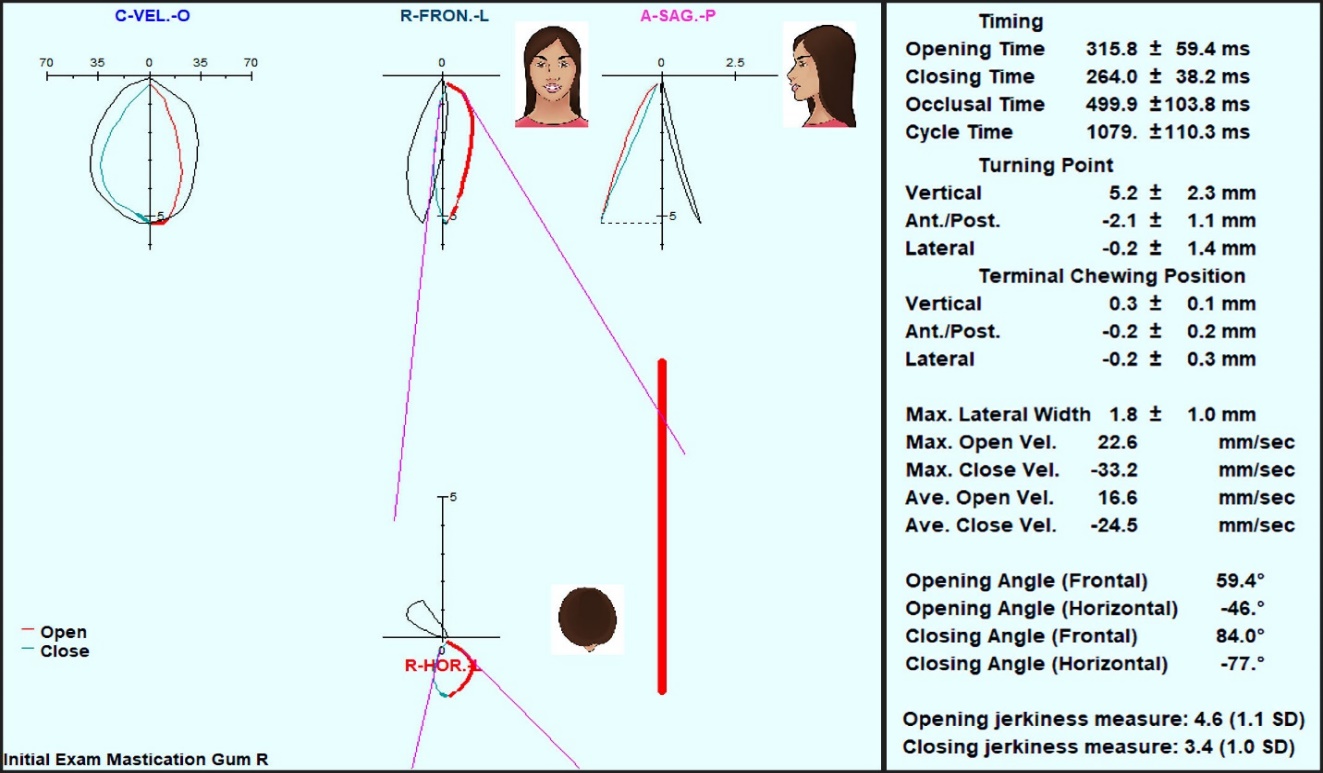
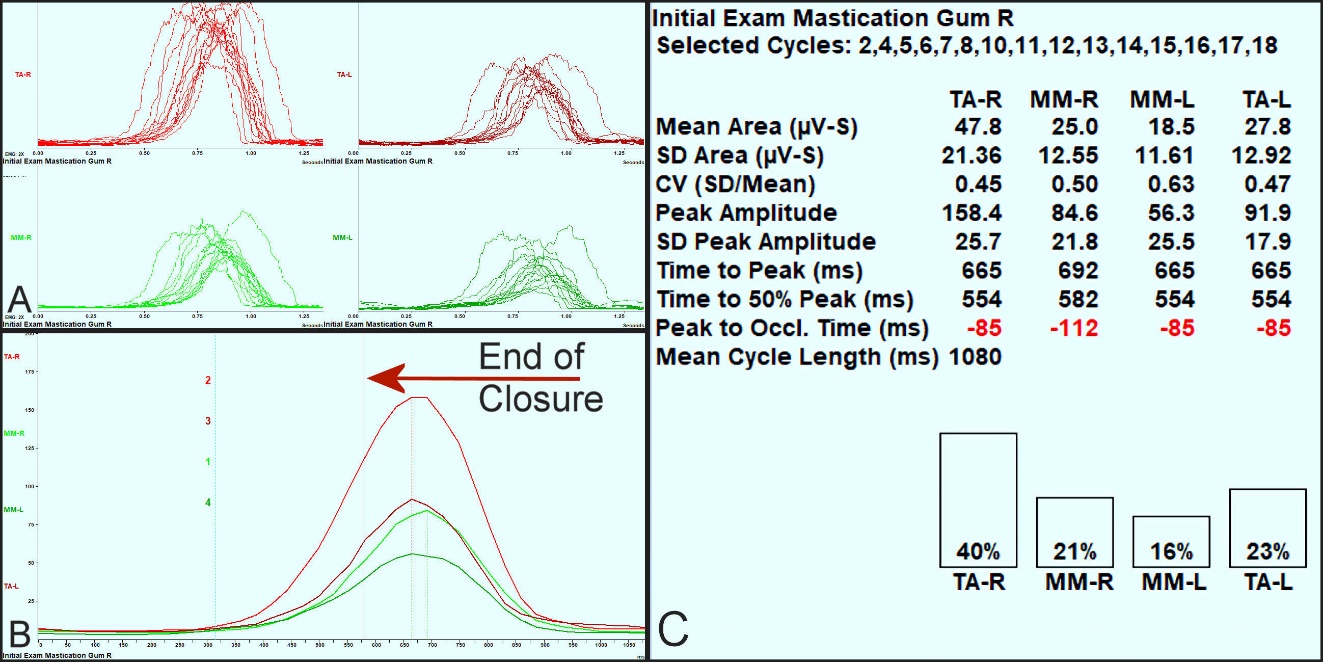
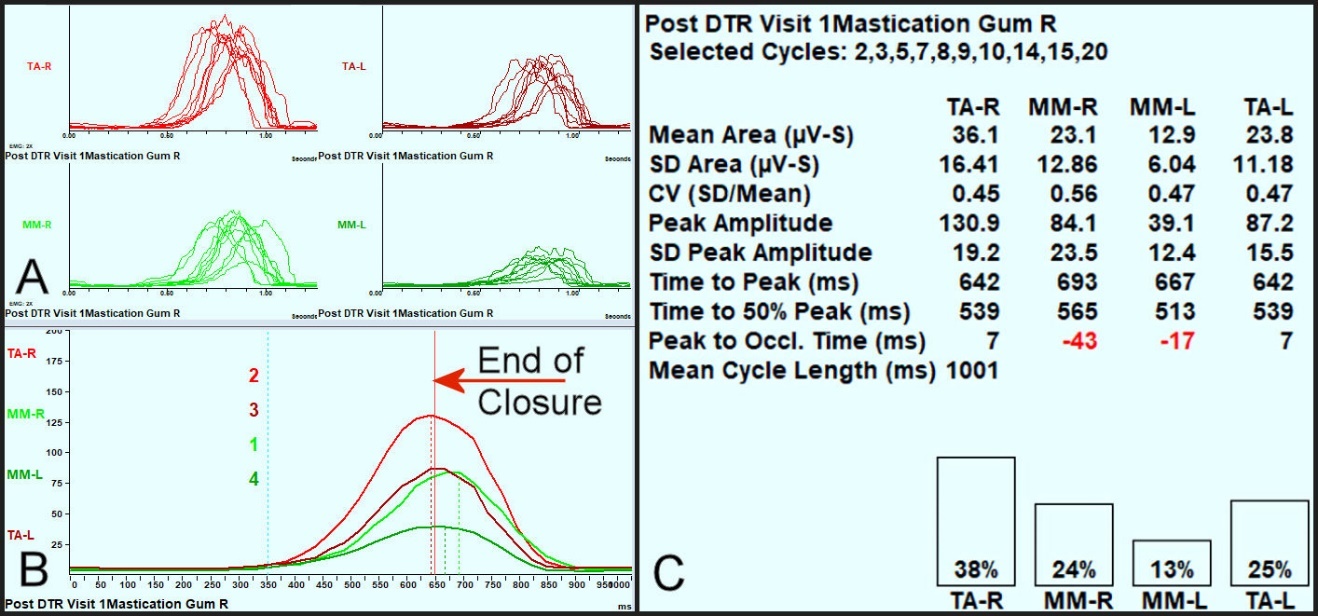
The results of this study corroborate the prior case report’s that observed MD symptom reductions following a measured occlusal adjustment therapy (DTR).36,37 EGN (jaw motion) and EMG (temporalis and masseter muscles) were recorded bilaterally and simultaneously and analyzed together. Figure 2. Shows an example of the pre-treatment Average Chewing Pattern (ACP) along with the timings, Turning Point, Terminal Chewing Position, velocities, angles and Jerkiness. The ACP was very small, slow and highly variable, all indications of masticatory dysfunction. In Figure 3 the right and left temporalis muscle bursts (in red) and R and L masseter muscle bursts (in green) during gum chewing pretreatment. The right temporalis was providing a disproportionate amount of effort compared to a normal muscle balance. Notice there was a delay in all the peaks of muscle contraction (red numbers) until after the end of closure. This indicates hesitancy, in retrospect, most likely due to muscles that were firing carefully to avoid occlusal interferences.

Figure 2
Figure 2.One sample patient’s Average Chewing Pattern (ACP) pre-treatment with numerical values. Vertical Turning Point is very small, (should be 10 – 22 mm), lateral Turning Point is on the wrong side, the terminal chewing position is too far from MIP (limited crushing of the bolus), opening and closing velocities are very slow and jerkiness is too high for opening and marginally adapted for closing. Black lines are the mean normal patterns scaled to the patient’s vertical dimension, red lines = opening, cyan lines = closing.
Figure 3
Figure 3.A) The same patient’s highly variable firing pattern of elevator muscles cycle to cycle shows poor coordination (gum chewing right side). B) The Average Chewing Cycle (ACC) of this patient’s activity shows the peaking of all 4 muscles was delayed abnormally past the end of closure. C) Masseter inhibition, high variability (CV > 0.3), long cycle time (1.08 seconds) and delayed closing peaks (after the end of closure) all reveal dysfunction.

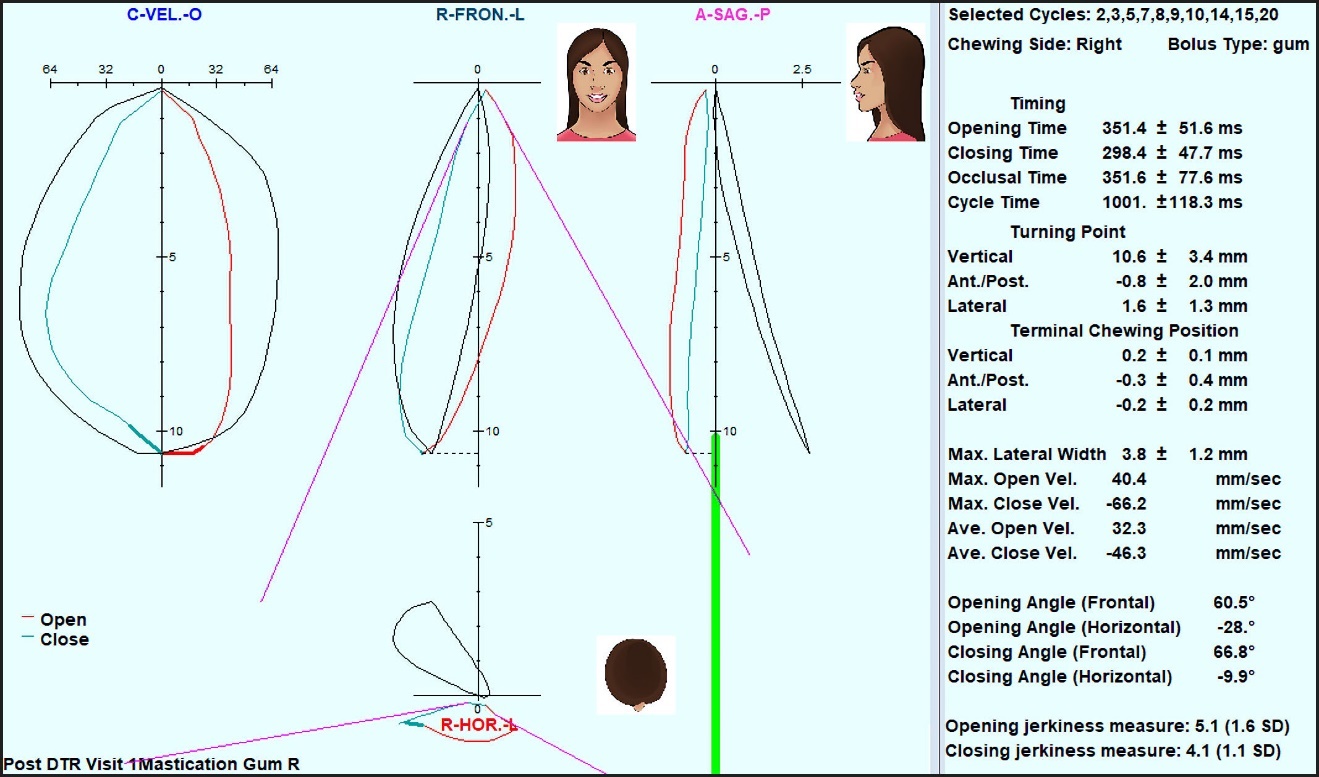
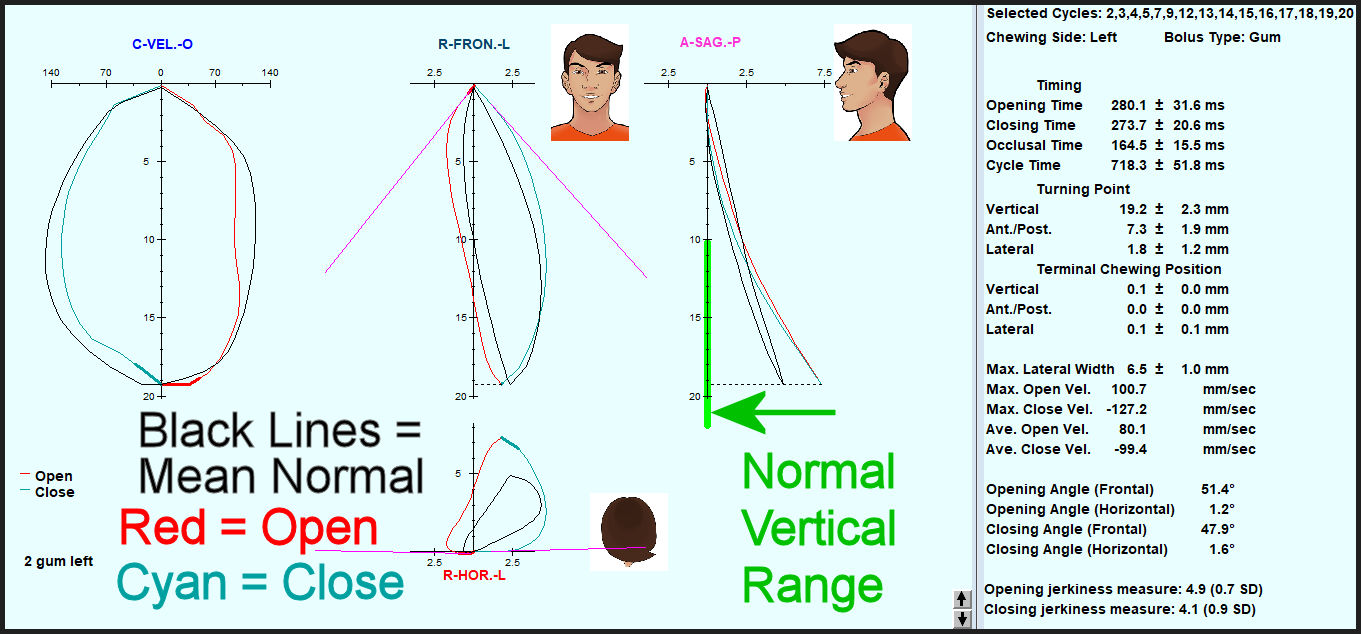
In Figure 4 the size of the ACP was increased dramatically (see Turning Point) and the velocities were increased towards normal values. The other numerical values were only changed slightly. In Figure 5, the same ACC data immediately following DTR therapy, the balance between the muscles was improved and only the masseter muscles peaked slightly delayed after the end of closure (red numbers in Figure 4). Synergy of muscle contraction was improved, and the ACC curve composite appears closer to a “normal” non-MD sufferer’s muscle pattern.

Figure 4
Figure 4.Average Chewing Pattern immediately following DTR treatment showing cycle time and occlusal time have shortened, vertical Turning Point has increased into normal range, lateral Turning Point has been corrected to the right side, and the opening and closing velocities have increased.
Figure 5
Figure 5.A) Immediately following DTR therapy the standard deviation of each muscle’s activity was reduced, B) the peaking of muscle activity occurred closer to the end of closure and C) increased working masseter activity along with reduced working temporalis activity.

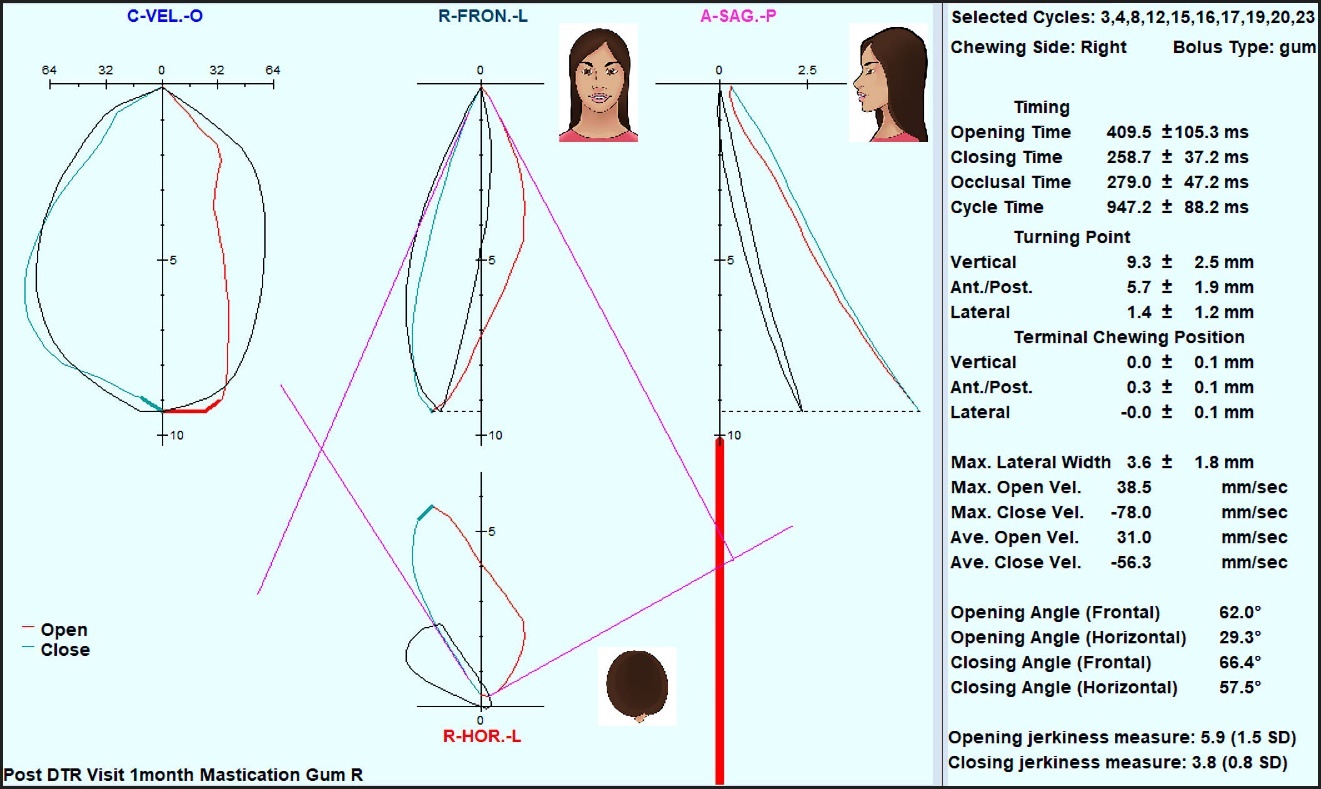
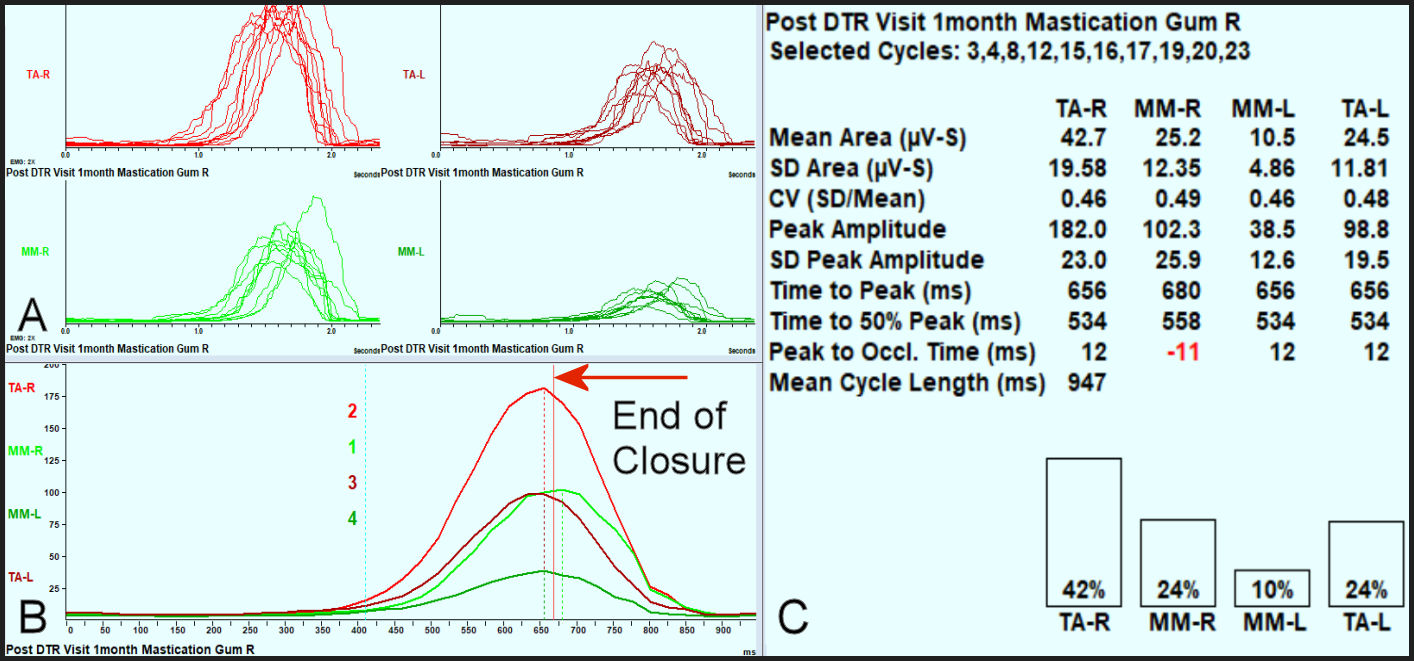
In Figure 6, one month post DTR, the closing time, occlusal time and cycle time were reduced and most importantly, the ACP shapes (red and cyan) were matching the mean normal shapes (black) very closely. Note: The overall shapes of the APCs are more indicative of normality than any single parameter. There was some opening interruption in the velocity, probably a left TMJ issue, which retained a retarded opening time and contributed to a longer than ideal cycle time. Figure 7 reveals the same ACC values one month post treatment. Only the right (working) masseter peak was still delayed to slightly after the end of closure (by 11 milliseconds) and the other three muscles peaked together prior to the end of closure. The amount of effort of the non-working masseter, an adaptation factor, and its variability were both reduced.

Figure 6
Figure 6.Further reduction in the cycle time towards the normal range with reduced. The Average Chewing Pattern shapes are closer to matching the mean normal patterns. The Terminal Chewing Position is normalized (very close to MIP). Closing velocity increased toward the normal range.
Figure 7
Figure 7.A) Four months post therapy the variability was more consistent between muscles, B) working masseter activity is increased and non-working masseter activity decreased and C) three of four muscles peak their activity before the end of closure.

Movements

Opening time delays are often caused by TMJ internal derangements, less often by occlusal interferences. Closing delays are more likely due to hesitancy, avoidance of occlusal interferences and uncertainty with respect to the Intercuspal position. For the left-sided gum-chewing (Table 1) the only timing factor of the group that did not show any reduction was the mean closing time. However, the pre-treatment mean closing time already fell within normal limits.53–55,59 The pre-treatment mean Opening Time was greater than the mean normal value but was reduced to within normal limits after treatment. For right-sided gum-chewing all 4 timing parameters were reduced by treatment to values within normal limits.53–55,59 Dysfunction slows down masticatory function such that any improvement in function shortens the timings.

The Turning Point (TP) is the point at the furthest opening where the transition occurs from opening to closing. The mean normal for vertical dimension is 16 mm with a range of 10 to 22 mm. The mean Vertical and Antero-posterior Turning Points increased significantly towards the mean normal value for left-sided gum-chewing, but the increase in the A/P Turning Point for right-sided gum-chewing did not achieve significance.53–55,59 The left gum-chewing lateral turning point showed a trend towards an increase (p < 0.10), while the right gum-chewing lateral turning point was already close to the mean normal value (2.3 mm) prior to treatment and changed little post-treatment. See Table 2.

The Terminal Chewing Position (TCP) indicates the extent of the bolus crush with smaller numbers indicating a more crushed bolus. Although the left-sided Terminal Chewing Position decreased in all three dimensions, only the lateral dimension decreased significantly. No significant changes were found in any dimension of the Terminal Chewing Position for right-sided gum-chewing. Since gum is a very soft bolus easily crushed, this result was not surprising and it means that as a group, most of these subjects were muscularly accommodating to their existing malocclusions. See Table 3.

The Maximum Lateral Width is the extreme lateral dimension of the frontal chewing pattern. While there was a significant decrease during right-sided gum chewing and a trend towards an increase in left-sided gum-chewing, all four mean values were found to be within normal limits prior to and post treatment.53–55,59 See Table 4. Significant increases in Maximum Opening Velocity were observed post-treatment in both the left and right-sided gum-chewing. The left-sided gum-chewing closing velocity increased significantly, while the right-sided gum-chewing only exhibited a trend towards a significant increase (p < 0.10). The mean normal values for opening (> 100 mm/second) and closing (> 120 mm/second) were nearly all achieved by this group post treatment.

The frontal opening angles did not change significantly for left-sided or right-sided gum chewing because both sides were within normal limits prior to treatment. Significant decreases towards more normal values (less restrictive) for frontal closing angles were found for both left-sided and right-sided gum-chewing. While opening jerkiness decreased significantly for both sides of gum-chewing, the closing jerkiness only decreased significantly for right-sided gum chewing because the left-sided gum-chewing was already within normal limits prior to treatment (3.2). Patients with un-adapted dysfunction tend to close carefully, which often reduces their closing jerkiness to within normal limits. See Table 5.

Muscle Function

The overall effort of chewing was significantly reduced for all four muscles after treatment (Bilateral masseter and anterior temporalis). When the need for accommodation to structural issues like malocclusion and/or temporomandibular joint dysfunction is reduced, the muscular effort required to chew is lessened. A simple change like removing pre-mature occlusal contacts, as done in this study, can significantly reduce extra muscular effort, especially from the non-working side muscles. See Table 6.

The coefficient of variation (CV) is a relative indicator of variability (the standard deviation divided by the mean). Although variability is expected with good masticatory function, excess variability occurs when dysfunction is present. For right-sided gum-chewing the variability was reduced significantly after treatment for all four muscles. For left-sided gum-chewing the variability decreased but significantly only for the non-working temporalis. The non-working masseter and the working temporalis exhibited a trend towards reduced variability (p < 0.10), but not the working masseter. See Table 7.

The Peak Amplitude represents the highest effort exhibited by the muscle. As the term suggests, it is a momentary level of highest intensity contraction within each cycle. In all muscles under both left and right-sided conditions there were reductions in all mean peak amplitudes. The changes were significant in 3 of the 4 muscles for left-sided gum-chewing, but not for right-sided gum-chewing. Only a trend towards a reduction occurred in both temporalis muscles (p < 0.10), but no significant change in the masseter peak contraction levels. See Table 8.

Table 9 concurs with Table 1 in that the significantly reduced cycle times post treatment also resulted in significantly reduced times from the onset of opening to the peak of the muscle activity for all 4 muscles and for both left-sided and right-sided gum-chewing.

The time from the peak of muscle activity to the onset of occlusion (end of closure) is normally a positive value meaning the peak occurs prior to the end of closure. Within this group of subjects, the mean values were positive both prior to and post treatment, but with significant reductions for right-sided gum-chewing (p < 0.05). For left-sided gum-chewing only the working temporalis timing was significantly reduced (p < 0.05). However, the variability was reduced for all muscles and for both chewing sides. See Table 10.

SUMMARY OF SIGNIFICANT FINDINGS

Improvements towards normality were seen in all 10 parameters used to evaluate the masticatory function of these Meniere’s Disease patients.

  1. The mean chewing timings improved towards mean normal values after DTR.

  2. The mean vertical turning point increased significantly towards the mean normal.

  3. The left-sided gum-chewing mean lateral terminal chewing position (TCP) significantly reduced.

  4. The mean opening and closing chewing velocities either increased significantly or showed a trend.

  5. The mean frontal closing angles significantly decreased towards more normal (less restrictive) values.

  6. The mean EMG chewing activity was significantly reduced for working and non-working muscles.

  7. The mean variability in the EMG muscle contraction activity patterns decreased for all muscles.

  8. The means of the peaks of EMG activity decreased for all muscles post treatment.

  9. Mean time to peak muscle activity was reduced significantly for all muscles and conditions.

  10. Time from peak muscle activity to the end of closure appeared to increase for all muscles.

These findings do correlate with MD symptoms improving as the mastication improves and support the findings of others investigating masticatory disfunction.63–69 We reject the null hypothesis.

LIMITATIONS

The ICAGD treatments via DTR therapy are standardized and have been successfully reported from different practitioners in previous studies.47,60–62,70–73 This study’s primary focus was treatment outcomes. No control subjects were utilized, but rather each subject served as their own control being compared to themselves pre vs post therapy. This was intentional in the study design because denying symptomatic subjects’ treatment or giving a placebo for several months carries ethical concerns and are difficult to maintain.

CONCLUSION

Eighty-six subjects with a confirmed diagnosis of Meniere’s Disease experienced reductions in frequency, duration and intensity of their MD symptoms following reductions in Disclusion Time and muscle activity via DTR through computer guided coronoplasty (Part 1). This study shows definitively that the pretreatment evaluation of masticatory function (through EGN and EMG) reveals dysfunction. The post therapy mastication data indicates more normalized function after therapy. Although occlusion has been overlooked in most of the medical and dental literature as a possible etiology of MD, the results of this study point to malocclusion, specifically bite force and bite timing, as the etiology for the symptoms in this group of subjects diagnosed with MD. These findings support occlusion as a major contributor to the function and disfunction of the masticatory system thus playing a significant role in symptomology. This includes symptoms such as hearing loss, vertigo, tinnitus and fullness of the ear, which in isolation from other symptoms suggests MD.


DECLARATION OF CONFLICTS STATEMENT

Drs. Ben Sutter, Prafulla Thumati, and Roshan Thumati claim no conflict of interest. John Radke is the Chairman of the Board of BioResearch Associates, Inc., the manufacturer of the BioEMG III and a distributor of the T-Scan. He receives no commission or other monetary incentive based upon sales of the T-Scan or the BioEMG III.

FUNDING STATEMENT

No funding from any source was provided to complete this study.

Accepted: August 15, 2023 CDT

References

1.
Méniere P. “Sur une forme de surdité grave dépendant d’une lésion de l’oreille interne” (On a form of severe deafness dependent on a lesion of the inner ear). Bulletin de l’Académie impériale de médecine. 1861;26:26241.
Google Scholar
2.
Perez-Carpena P, Lopez-Escamez JA. Current Understanding and Clinical Management of Meniere’s Disease: A Systematic Review. Semin Neurol. 2020;40(1):138-150. doi:10.1055/s-0039-3402065
Google Scholar
3.
Mancini F, Catalani M, Carru M, Monti B. History of Meniere’s disease and its clinical presentation. Otolaryngol Clin North Am. 2002;35(3):565-580. doi:10.1016/s0030-6665(02)00017-8
Google Scholar
4.
Oberman BS, Patel VA, Cureoglu S, Isildak H. The aetiopathologies of Ménière’s disease: a contemporary review. Acta Otorhinolaryngol Ital. 2017;37(4):250-263. doi:10.14639/0392-100x-793
Google ScholarPubMed CentralPubMed
5.
Harris JP, Nguyen QT. Meniere’s disease: 150 years and still elusive. Otolaryngol Clin North Am. 2010;43(5):xiii-xiv. doi:10.1016/j.otc.2010.05.011
Google Scholar
6.
Basura GJ, Adams ME, Monfared A, et al. Clinical Practice Guideline: Ménière’s Disease. Otolaryngol Head Neck Surg. 2020;162(S2):S1-S55. doi:10.1177/0194599820909438
Google Scholar
7.
Hegemann SCA. Menière’s disease caused by CGRP - A new hypothesis explaining etiology and pathophysiology. Redirecting Menière’s syndrome to Menière’s disease. J Vestib Res. 2021;31(4):311-314. doi:10.3233/ves-200716
Google Scholar
8.
Gürkov R, Pyykö I, Zou J, Kentala E. What is Menière’s disease? A contemporary re-evaluation of endolymphatic hydrops. J Neurol. 2016;263(S1):71-81. doi:10.1007/s00415-015-7930-1
Google ScholarPubMed CentralPubMed
9.
Christopher LH, Wilkinson EP. Meniere’s disease: Medical management, rationale for vestibular preservation and suggested protocol in medical failure. Am J Otolaryngol. 2021;42(1):102817. doi:10.1016/j.amjoto.2020.102817
Google Scholar
10.
Merchant SN, Adams JC, Nadol JBJr. Pathophysiology of Meniere’s syndrome: are symptoms caused by endolymphatic hydrops? Otol Neurotol. 2005;26(1):74-81. doi:10.1097/00129492-200501000-00013
Google Scholar
11.
Morgan DH. Tinnitus of TMJ Origin: A Preliminary Report. Cranio. 1992;10(2):124-129. doi:10.1080/08869634.1992.11677900
Google Scholar
12.
Iwasaki S, Shojaku H, Murofushi T, et al. Diagnostic and therapeutic strategies for Meniere’s disease of the Japan Society for Equilibrium Research. Auris Nasus Larynx. 2021;48(1):15-22. doi:10.1016/j.anl.2020.10.009
Google Scholar
13.
Foster CA, Breeze RE. Endolymphatic hydrops in Ménière’s disease: cause, consequence, or epiphenomenon? Otol Neurotol. 2013;34(7):1210-1214. doi:10.1097/mao.0b013e31829e83df
Google Scholar
14.
Cureoglu S, da Costa Monsanto R, Paparella MM. Histopathology of Meniere’s Disease. Oper Tech Otolayngol Head Neck Surg. 2016;27(4):194-204. doi:10.1016/j.otot.2016.10.003
Google ScholarPubMed CentralPubMed
15.
Harris JP, Nguyen QT. Meniere’s disease: 150 years and still elusive. Otolaryngol Clin North Am. 2010;43(5):xiii-xiv. doi:10.1016/j.otc.2010.05.011
Google Scholar
16.
Lopez-Escamez JA, Carey J, Chung WH, et al. Diagnostic criteria for Menière’s disease. J Vestib Res. 2015;25(1):1-7. doi:10.3233/ves-150549
Google Scholar
17.
Takumida M, Akagi N, Anniko M. A new animal model for Ménière’s disease. Acta Otolaryngol. 2008;128(3):263-271. doi:10.1080/00016480701497436
Google Scholar
18.
Kumagami H, Loewenheim H, Beitz E, et al. The effect of anti-diuretic hormone on the endolymphatic sac of the inner ear. Pflugers Arch. 1998;436(6):970-975. doi:10.1007/s004240050731
Google Scholar
19.
Feldman AM, Brusilow SW. Effects of cholera toxin on cochlear endolymph production: model for endolymphatic hydrops. Proc Natl Acad Sci USA. 1976;73(5):1761-1764. doi:10.1073/pnas.73.5.1761
Google ScholarPubMed CentralPubMed
20.
Cooper BC, Kleinberg I. Examination of a Large Patient Population for the Presence of Symptoms and Signs of Temporomandibular Disorders. Cranio. 2007;25(2):114-126. doi:10.1179/crn.2007.018
Google Scholar
21.
Peroz I. Dysfunctions of the stomatognathic system in tinnitus patients compared to controls. HNO. 2003;51(7):544-549. doi:10.1007/s00106-002-0750-5
Google Scholar
22.
Bjorne A, Agerberg G. Craniomandibular disorders in patients with Menière’s disease: a controlled study. J Orofac Pain. 1996;10(1):28-37.
Google Scholar
23.
Björne A. Assessment of temporomandibular and cervical spine disorders in tinnitus patients. Prog Brain Res. 2007;166:215-219. doi:10.1016/s0079-6123(07)66019-1
Google Scholar
24.
Gelb H, Gelb ML, Wagner ML. The relationship of tinnitus to craniocervical mandibular disorders. Cranio. 1997;15(2):136-143. doi:10.1080/08869634.1997.11746004
Google Scholar
25.
Ferendiuk E, Zajdel K, Pihut M. Incidence of otolaryngological symptoms in patients with temporomandibular joint dysfunctions. Biomed Res Int. 2014;2014(824684):1-5. doi:10.1155/2014/824684
Google ScholarPubMed CentralPubMed
26.
Wright EF, Syms CA III, Bifano SL. Tinnitus, dizziness, and nonotologic otalgia improvement through temporomandibular disorder therapy. Mil Med. 2000;165(10):733-736. doi:10.1093/milmed/165.10.733
Google Scholar
27.
Wright EF, Bifano SL. The Relationship between Tinnitus and Temporomandibular Disorder (TMD) Therapy. Int Tinnitus J. 1997;3(1):55-61.
Google Scholar
28.
Di Berardino F, Filipponi E, Schiappadori M, Forti S, Zanetti D, Cesarani A. The occlusal imaging and analysis system by T-scan III in tinnitus patients. Biomed J. 2016;39(2):139-144. doi:10.1016/j.bj.2016.04.001
Google ScholarPubMed CentralPubMed
29.
Kusdra PM, Stechman-Neto J, de Leão BLC, Martins PFA, de Lacerda ABM, Zeigelboim BS. Relationship between Otological Symptoms and TMD. Int Tinnitus J. 2018;22(1):30-34. doi:10.5935/0946-5448.20180005
Google Scholar
30.
Ramirez Aristeguieta LM, Sandoval Ortiz GP, Ballesteros LE. Theories on otic symptoms in temporomandibular disorders: past and present. Int J Morphol. 2005;23(2):141-156. doi:10.4067/s0717-95022005000200009
Google Scholar
31.
Stechman-Neto J, Porporatti AL, Porto de Toledo I, et al. Effect of temporomandibular disorder therapy on otologic signs and symptoms: a systematic review. J Oral Rehabil. 2016;43(6):468-479. doi:10.1111/joor.12380
Google Scholar
32.
Costen JB. A syndrome of ear and sinus symptoms dependent upon disturbed function of the temporomandibular joint. Ann Otol Rhinol Laryngol. 1934;43(1):1-15. doi:10.1177/000348943404300101
Google Scholar
33.
Bjorne A, Agerberg G. Symptom relief after treatment of temporomandibular and cervical spine disorders in patients with Meniere’s disease: a three-year follow-up. Cranio. 2003;21(1):50-60. doi:10.1080/08869634.2003.11746232
Google Scholar
34.
Bjorne A, Agerberg G. Reduction in sick leave and costs to society of patients with Meniere’s disease after treatment of temporomandibular and cervical spine disorders: a controlled six-year cost-benefit study. Cranio. 2003;21(2):136-143. doi:10.1080/08869634.2003.11746242
Google Scholar
35.
Bjorne A, Berven A, Agerberg G. Cervical signs and symptoms in patients with Meniere’s disease: a controlled study. Cranio. 1998;16(3):194-202. doi:10.1080/08869634.1998.11746057
Google Scholar
36.
Sutter BA. Two Case Reports of Meniere’s Disease That Responded to Computer-guided Occlusal Therapy. The Application of the Principles of Neuromuscular Dentistry to Clinical Practice. Anthology Vol XI, The International College of Cranio-Mandibular Orthopedics. 2016;11:89-98.
Google Scholar
37.
Sutter BA. Complex Medical Diagnoses with an Underlying Dental Etiology; Case Reviews. In: Kerstein RB, ed. Handbook of Research on Clinical Applications of Computerized Occlusal Analysis in Dental Medicine. IGI Global; 2019:1243-1315.
Google Scholar
38.
Kerstein RB. Disclusion Time reduction therapy with immediate complete anterior guidance development: the technique. Quintessence Int. 1992;23(11):735-747.
Google Scholar
39.
Kerstein RB, Radke J. Masseter and temporalis excursive hyperactivity decreased by measured anterior guidance development. Cranio. 2012;30(4):243-254. doi:10.1179/crn.2012.038
Google Scholar
40.
Kerstein RB, Radke J. Average Chewing Pattern improvements following Disclusion Time Reduction. Cranio. 2017;35(3):135-151. doi:10.1080/08869634.2016.1190526
Google Scholar
41.
Kerstein RB, Chapman R, Klein M. A comparison of ICAGD (Immediate Complete Anterior Guidance Development) to “mock ICAGD” for symptom reductions in chronic myofascial pain dysfunction patients. Cranio. 1997;15(1):21-37. doi:10.1080/08869634.1997.11745990
Google Scholar
42.
Thumati P, Sutter BA, Kerstein RB, Yiannios N, Radke J. Beck Depression Inventory changes in muscular TMD subjects after measured occlusal treatment. Adv Dent Tech. 2018;1(1):1-13. https://adtt.scholasticahq.com/article/5019-changes-in-the-beck-depression-inventory-ii-scores-of-tmd-subjects-after-measured-occlusal-treatment
Google Scholar
43.
Kerstein RB, Wright NR. Electromyographic and computer analyses of patients suffering from chronic myofascial pain-dysfunction syndrome: before and after treatment with immediate complete anterior guidance development. J Prosthet Dent. 1991;66(5):677-686. doi:10.1016/0022-3913(91)90453-4
Google Scholar
44.
Thumati P, Manwani R, Mahantshetty M. The effect of reduced Disclusion Time in the treatment of myofascial pain dysfunction syndrome using immediate complete anterior guidance development protocol monitored by digital analysis of occlusion. Cranio. 2014;32(4):289-299. doi:10.1179/2151090314y.0000000004
Google Scholar
45.
Thumati P, Thumati RP. The effect of disocclusion time-reduction therapy to treat chronic myofascial pain: A single group interventional study with 3 year follow-up of 100 cases. J Indian Prosthodont Soc. 2016;16(3):234-241. doi:10.4103/0972-4052.176529
Google ScholarPubMed CentralPubMed
46.
Yiannios N, Kerstein RB, Radke J. Treatment of frictional dental hypersensitivity (FDH) with computer-guided occlusal adjustments. Cranio. 2017;35(6):347-357. doi:10.1080/08869634.2016.1251692
Google Scholar
47.
Sutter B, Teragawa S, Radke J. Trigeminal Neuralgia Patients Treated with Disclusion Time Reduction (DTR): A Retrospective Cohort Study. Adv Dent Tech. 2020;2(2):90-105. https://adtt.scholasticahq.com/article/16786-trigeminal-neuralgia-patients-treated-with-disclusion-time-reduction-dtr-a-retrospective-cohort-study
Google Scholar
48.
Radke JC, Kamyszek GJ, Kull RS, Velasco GR. TMJ symptoms reduce chewing amplitude and velocity, and increase variability. Cranio. 2019;37(1):12-19. doi:10.1080/08869634.2017.1365421
Google Scholar
49.
Kerstein RB, Radke J. Average chewing pattern improvements following Disclusion Time reduction. Cranio. 2017;35(3):135-151. doi:10.1080/08869634.2016.1190526
Google Scholar
50.
Andrade KM, Alfenas BFM, Campos CH, Rodrigues Garcia RCM. Mandibular movements in older people with rheumatoid arthritis. Oral Surg Oral Med Oral Pathol Oral Radiol. 2017;123(5):e153-e159. doi:10.1016/j.oooo.2017.01.014
Google Scholar
51.
Vilanova LSR, Gonçalves TMSV, Pimentel MJ, Bavia PF, Rodrigues Garcia RCM. Mastication movements and sleep quality of patients with myofascial pain: occlusal device therapy improvements. J Prosthet Dent. 2014;112(6):1330-1336. doi:10.1016/j.prosdent.2014.07.008
Google Scholar
52.
Radke JC, Ketcham R, Glassman B, Kull R. Artificial neural network learns to differentiate normal TMJs and nonreducing displaced disks after training on incisor-point chewing movements. Cranio. 2003;21(4):259-264. doi:10.1080/08869634.2003.11746260
Google Scholar
53.
Kuwahara T, Bessette RW, Maruyama T. Characteristic chewing parameters for specific types of temporomandibular joint internal derangements. Cranio. 1996;14(1):12-22. doi:10.1080/08869634.1996.11745944
Google Scholar
54.
Kuwahara T, Bessette RW, Maruyama T. Chewing pattern analysis in TMD patients with unilateral and bilateral internal derangement. Cranio. 1995;13(3):167-172. doi:10.1080/08869634.1995.11678063
Google Scholar
55.
Kuwahara T, Bessette RW, Maruyama T. Chewing pattern analysis in TMD patients with and without internal derangement: Part I. Cranio. 1995;13(1):8-14. doi:10.1080/08869634.1995.11678035
Google Scholar
56.
Sfondrini G, Schiavi A, Mandurino M, de Rysky C. Electromyographic and electrognathographic analysis of patients with juvenile rheumatoid arthritis. Mondo Ortod. 1991;16(5):535-555.
Google Scholar
57.
Radke J, Ruiz-Velasco G, Kadamati P. Measuring the jerkiness of gum chewing: Verified TMJ internal derangement patients Vs control Subjects. Adv Dent Tech. 2020;2(2):77-84. https://adtt.scholasticahq.com/article/14592-measuring-the-jerkiness-of-gum-chewing-verified-tmj-internal-derangement-patients-vs-control-subjects
Google Scholar
58.
Ayinala M, Poovani S, Thumati P, Shetty G, Radke J. Mastication analysis of patients with mandibular Kennedy’s Class I situation with or without modifications, before & after treatment partial denture insertion; an in vivo study. Adv Dent Tech. Published online December 30, 2020. https://adtt.scholasticahq.com/article/18648-mastication-analysis-of-patients-with-mandibular-kennedy-s-class-i-situation-with-or-without-modifications-before-after-treatment-partial-denture-i
Google Scholar
59.
Radke JC, Kull RS, Sethi MS. Chewing movements altered in the presence of temporomandibular joint internal derangements. CRANIO. 2014;32(3):187-192. doi:10.1179/0886963413z.00000000028
Google Scholar
60.
Kerstein RB, Radke J. Masseter and temporalis excursive hyperactivity decreased by measured anterior guidance development. Cranio. 2012;30(4):243-254. doi:10.1179/crn.2012.038
Google Scholar
61.
Thumati P, Poovani S, Bharathi B, Mounika A, Kerstein RB, Radke J. A disclusion time reduction randomized controlled adjustment trial. Adv Dent Tech. Published online April 27, 2020. https://adtt.scholasticahq.com/article/12683-a-disclusion-time-reduction-randomized-controlled-occlusal-adjustment-trial
Google Scholar
62.
Yiannios N, Coleman T, Radke J. Digitally measured anterior guidance development reduces cold-water and air-indexing hypersensitivity. Adv Dent Tech. Published online June 20, 2019. https://adtt.scholasticahq.com/article/9673-digitally-measured-anterior-guidance-development-reduces-cold-water-and-air-indexing-tooth-hypersensitivity
Google Scholar
63.
Radke J, Velasco GR, Kadamati P. Measuring the Jerkiness of Gum Chewing: Verified TMJ Internal Derangement Patients Vs Control Subjects. Adv Dent Tech. Published online August 17, 2020. https://adtt.scholasticahq.com/article/14592-measuring-the-jerkiness-of-gum-chewing-verified-tmj-internal-derangement-patients-vs-control-subjects
Google Scholar
64.
Thumati P, Radke J, Thumati RP, Vijayakumar M. EMG and Jaw Tracking Evaluation of Masticatory Function after Full Mouth Reconstruction. Adv Dent Tech. Published online August 30, 2021. https://adtt.scholasticahq.com/article/27923-emg-and-jaw-tracking-evaluation-of-masticatory-function-after-full-mouth-reconstruction
Google Scholar
65.
Matos M, Thumati P, Sutter B, et al. Are Temporomandibular Disorders Really Somatic Symptom Disorders? Part III – Masticatory Function as Revealed by EMG and EGN. Adv Dent Tech. Published online November 22, 2021. https://adtt.scholasticahq.com/article/30028-are-temporomandibular-disorders-really-somatic-symptom-disorders-part-iii-masticatory-function-as-revealed-by-emg-and-egn
Google Scholar
66.
Radke J, Kadamati P, Velasco GR. Delayed Peak sEMG of Elevator Muscles in Dysfunctional Mastication. Adv Dent Tech. Published online August 4, 2020:68-76. https://adtt.scholasticahq.com/article/14486-delayed-peak-semg-of-elevator-muscles-in-dysfunctional-mastication
Google Scholar
67.
Kerstein RB, Radke J. Computer-guided Occlusal Treatment Improves the Smoothness Timing and Velocity of Gum Chewing Galley Proof 3-12-2018. Adv Dent Tech. Published online March 6, 2019:12-22. https://adtt.scholasticahq.com/article/7829-computer-guided-occlusal-treatment-improves-the-smoothness-timing-and-velocity-of-gum-chewing-galley-proof-3-12-2018
Google Scholar
68.
Radke JC, Kull RS, Sethi MS. Chewing movements altered in the presence of temporomandibular joint internal derangements. Cranio. 2014;32(3):187-192. doi:10.1179/0886963413z.00000000028
Google Scholar
69.
English JD, Buschang PH, Throckmorton GS, Austin D, Wintergerst AM. Does malocclusion affect masticatory performance? Angle Orthod. 2002;72:21-27.
Google Scholar
70.
Radke J, Yiannios N, Sutter B, Kerstein RB. TMJ vibration changes following Immediate Complete Anterior Guidance Development. Adv Dent Tech. Published online September 7, 2018. https://adtt.scholasticahq.com/article/5018-tmj-vibration-changes-following-immediate-complete-anterior-guidance-development
Google Scholar
71.
Sutter BA, Girouard P. Posture Stability and Forward Head Posture Before and After Disclusion Time Reduction (DTR). A Five-Year Cohort Study. Adv Dent Tech. Published online July 20, 2021. https://adtt.scholasticahq.com/article/25911-posture-stability-and-forward-head-posture-before-and-after-disclusion-time-reduction-dtr-a-five-year-cohort-study
Google Scholar
72.
Kerstein R, Sutter B, Radke J. Increased Mastication Smoothness After Disclusion Time Reduction. Adv Dent Tech. Published online December 30, 2021. https://adtt.scholasticahq.com/article/31750-increased-mastication-smoothness-after-disclusion-time-reduction
Google Scholar
73.
Shopova D, Bozhkova T, Yordanova S, Yordanova M. Case Report: Digital analysis of occlusion with T-Scan Novus in occlusal splint treatment for a patient with bruxism. F1000Res. 2021;10:915. doi:10.12688/f1000research.72951.2
Google ScholarPubMed CentralPubMed

APPENDIX

Definitions

Timings: The averaged opening, closing, occlusal and cycle times of gum-chewing movements.

Turning Point (TP): The point most open and furthest from the intercuspal position that marks the transition from opening to closing.

Terminal Chewing Position (TCP): The most closed position crushing the bolus maximally.

Maximum Lateral Width: The maximum left to right distance produced while chewing.

Maximum Velocities: The fastest mean speed at any point of opening or closing.

Frontal Angles: The angle of opening from or closing into occlusion during chewing.

Jerkiness: The number transitions between acceleration and deceleration during opening or closing while chewing.

Mean Area: The EMG activity rectified and integrated for each chewing burst.

Coefficient of Variation: The standard deviation of the mean area divided by the mean area.

Peak Amplitude: The point of the highest intensity muscle contraction within the chewing burst of each cycle.

Time to Peak Amplitude: The time from the beginning of opening to the peak activity of the muscle contraction.

Peak to Occlusion: The time from the peak activity of the muscle contraction to the end of closure.

Figure 1A
Figure 1A.Mean Normal Average Chewing Pattern (ACP) of chewing motion (black lines) with a control subject’s data superimposed (red opening and cyan closing). Normal vertical range of Turning Point combining both sexes is 10 to 22 mm for one stick of chewing gum.
Figure 2A
Figure 2A.Mean Normal Average Chewing Cycle (ACP) of bilateral masseter and anterior temporalis muscles’ chewing EMG activity. The working masseter is most active, and the balancing masseter is the least active in Angle’s Class I patients. In Class II patients the temporalis is more active with a W-Ta, B-Ta, W-Mm, B-Mm normal pattern.
Table 1A.TMD vs MD Symptomology Comparison indicates that Menière’s Disease symptoms fall within the broad category of temporomandibular disorders.
MENIERE'S SYMPTOMS
Vertigo/Dizziness
Fullness of the ear
Tinnitus
Decreased hearing
TMD SYMPTOMS
HEAD PAIN EAR PROBLEMS
Headaches Vertigo /Dizziness
Forehead Fullness of the Ear
Temples Tinnitus
Migraine type Decreased Hearing
Sinus type Ear pain/ache but no infection
Shooting pain up the back of the head
Hair or scalp painful to touch JAW PROBLEMS
Brain fog Clicking or popping jaw joints
Grating sounds
EYES Pain in cheek muscles
Pain behind the eyes Uncontrollable jaw movements
Bloodshot eyes Uncontrollable tongue movements
Eyes Bulge out
Sensitive to sunlight NECK PROBLEMS
Weeping eyes Lack of mobility or stiffness
double vision Neck pain
Problems tracking while reading Tired, sore muscles
Eye muscle twitching Shoulder or back aches
Arm or finger numbness
MOUTH
Discomfort THROAT
Limited amount of opening Swallowing difficulties
Inability to open smoothly Laryngitis
Jaw deviates to one side Sore throat no infection
Locks open or shut Voice irregularities
Can't find the bite Feeling of object stuck in throat
Frequent coughing or clearing of throat
TEETH Feeling of hand resting on throat
Clenching and/or grinding
Looseness and soreness of teeth
Sensitivity to cold or ice